Economics > QUESTIONS & ANSWERS > University of Maryland, Baltimore CountyECON 102chapter 2. (All)
University of Maryland, Baltimore CountyECON 102chapter 2.
Document Content and Description Below
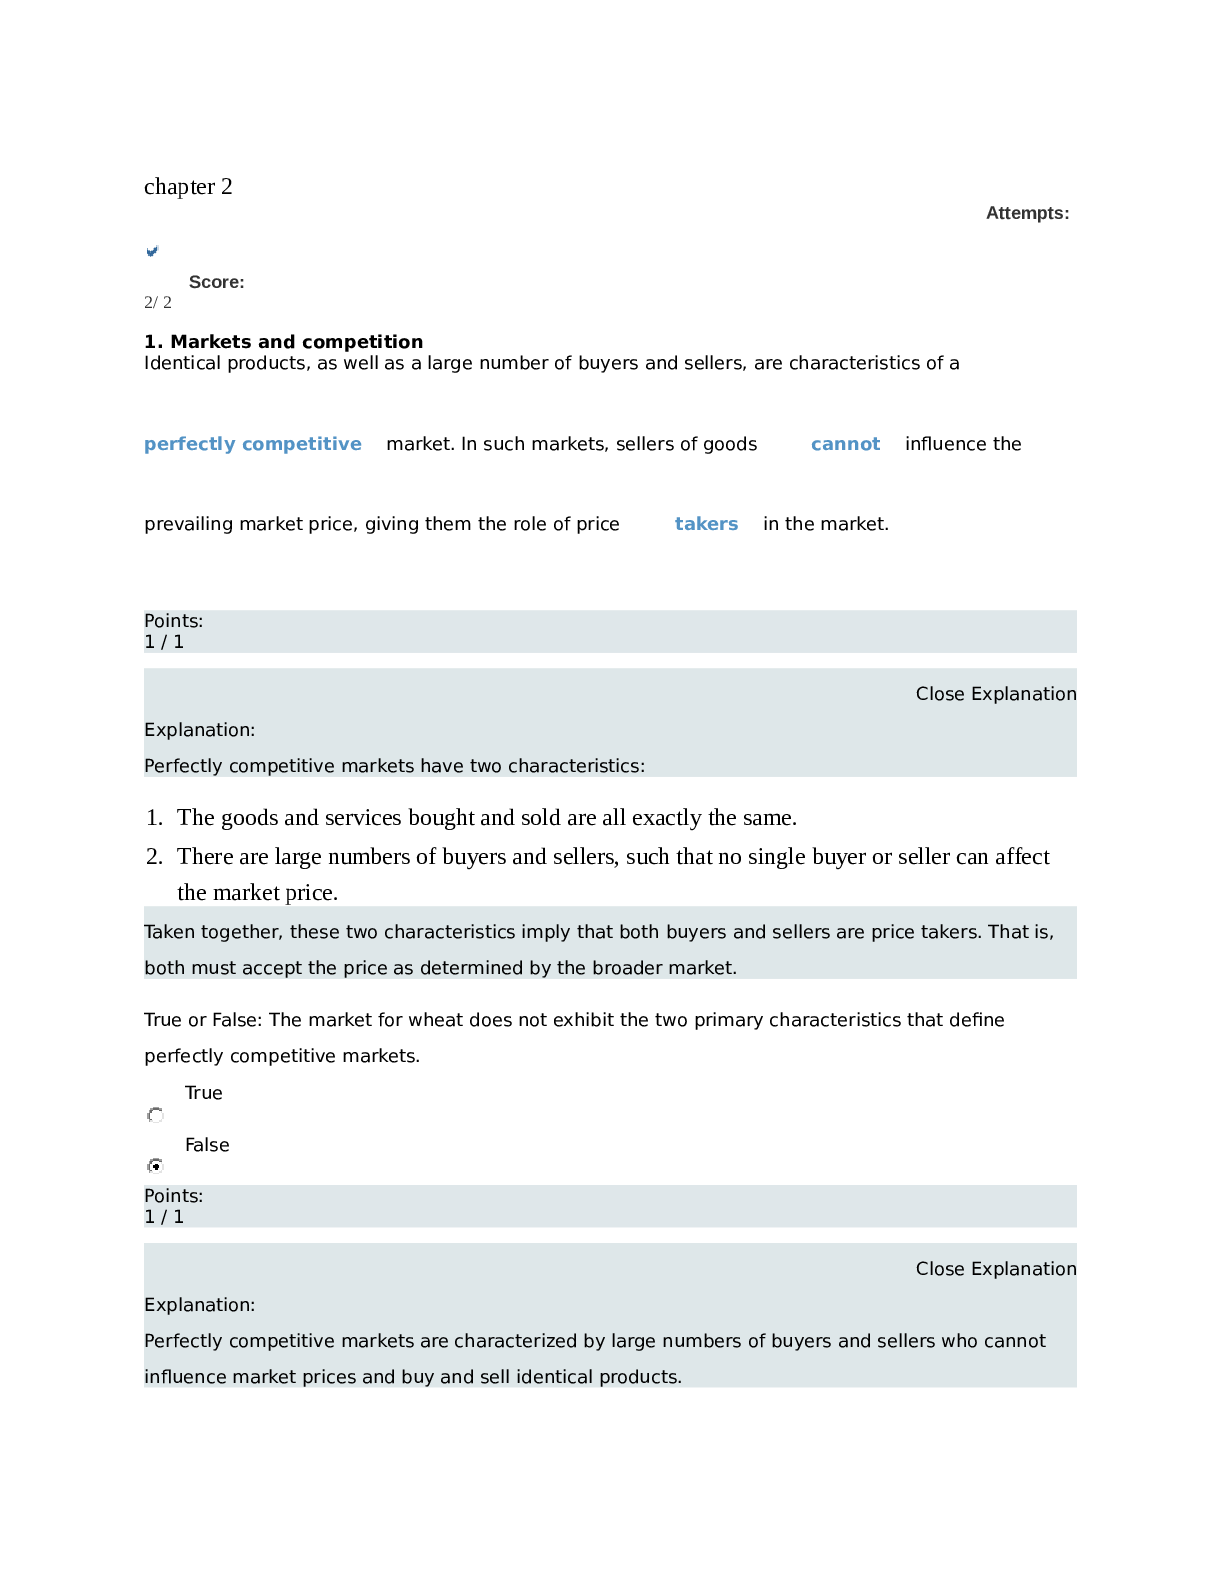
chapter 2 Attempts: Score: 2/ 2 1. Markets and competition Identical products, as well as a large number of buyers and sellers, are characteristics of a perfectly competitive market. In such mar... kets, sellers of goods cannot influence the prevailing market price, giving them the role of price takers in the market. Points: 1 / 1 Close Explanation Explanation: Perfectly competitive markets have two characteristics: 1. The goods and services bought and sold are all exactly the same. 2. There are large numbers of buyers and sellers, such that no single buyer or seller can affect the market price. Taken together, these two characteristics imply that both buyers and sellers are price takers. That is, both must accept the price as determined by the broader market. True or False: The market for wheat does not exhibit the two primary characteristics that define perfectly competitive markets. True False Points: 1 / 1 Close Explanation Explanation: Perfectly competitive markets are characterized by large numbers of buyers and sellers who cannot influence market prices and buy and sell identical products.Although in reality, most markets do not perfectly adhere to the assumptions of the perfectly competitive markets, some markets are very close to perfect competition. For example, the market for wheat has millions of consumers who buy wheat, as well as thousands of farmers producing and selling wheat. These consumers and producers take the market price as given and make their production and consumption decisions based on this prevailing price. Continue < Back to Assignment Attempts: Score: 2 / 2 2. Demand terminology Complete the following table by selecting the term that matches each definition. Definition Quantity Demanded Demand Curve Demand Schedule Law of Demand A graphical object showing the relationship between the price of a good and the amount of the good that buyers are willing and able to purchase at various prices A table showing the relationship between the price of a good and the amount that buyers are willing and able to purchase at various prices The claim that, with other things being equal, the quantity demanded of a good falls whenDefinition Quantity Demanded Demand Curve Demand Schedule Law of Demand the price of that good rises The amount of a good that buyers are willing and able to purchase at a given price Points: 1 / 1 Close Explanation Explanation: The quantity demanded of any good is the amount of the good that buyers are willing and able to purchase at a given price. This is different from a demand curve, which is a graph that shows the entire relationship between the price of a good and the quantity of the good demanded. A demand schedule, on the other hand, is a table that shows this relationship. The law of demand states that, other things being equal, the quantity demanded of a good falls when the price of the good rises. You can see the law of demand graphically in the downward-sloping demand curve. Apply your understanding of the previous key terms by completing the following scenario with the appropriate terminology. Your professor claims that one of the curves found on the following graph correctly illustrates the demand curve for CDs: 01234567891020181614121086420PRICE (Dollars per CD)QUANTITY (Millions of CDs)D1D2 Because you understand the law of demand, you can deduce that the correct graphical representation of the demand for CDs must be D1D1 . Moreover, you know that at a price of $10 per CD, the quantity demanded is five million CDs. Points: 1 / 1Close Explanation Explanation: The law of demand claims that, all else equal, the quantity demanded of a good falls when the price of that good rises. This implies a negative relationship between quantity and price and, thus, a downward-sloping demand curve. Therefore, D1D1 is the more likely demand curve for CDs. This curve shows the relationship between the price of CDs and the amount buyers are willing and able to purchase, known as the quantity of CDs demanded. For example, at a price of $10 per CD, the quantity demanded is five million CDs, according to the demand curve. The curve shows you the entire relationship between prices and quantities. Continue < Back to Assignment Attempts: Score: 1 / 1 3. Individual and market demand Suppose that Carlos and Deborah are the only consumers of pizza slices in a particular market. The following table shows their weekly demand schedules: Price Carlos’s Quantity Demanded Deborah’s Quantity Demanded (Dollars per slice) (Slices) (Slices) 1 8 16 2 5 12 3 3 8 4 1 4 5 0 2 On the following graph, plot Carlos’s demand for pizza slices using the green points (triangle symbol). Next, plot Deborah’s demand for pizza slices using the purple points (diamond symbol). Finally, plot the market demand for pizza slices using the blue points (circle symbol). Line segments will automatically connect the points. Remember to plot from left to right. Your AnswerCarlos’s DemandDeborah’s DemandMarket Demand048121620246543210PRICE (Dollars per slice)QUANTITY (Slices) Correct Answer Points:1 / 1 Close Explanation Explanation: Each point on an individual’s demand curve corresponds to one of the entries in the individual’s demand schedule. For example, when the price of pizza is $1, Carlos demands 8 slices per week and Deborah demands 16 slices per week. Therefore, the point (8, 1) lies on Carlos’s demand curve, and the point (16, 1) lies on Deborah’s demand curve. You can find the points of the market demand curve by adding up the quantity demanded by each individual in the market. For example, when the price of pizza is $1, Carlos demands 8 slices and Deborah demands 16 slices; therefore, total market demand is 8+16=248+16=24 slices per week. Repeating this process, you can construct the following market demand schedule: [Show More]
Last updated: 2 years ago
Preview 1 out of 26 pages
Buy this document to get the full access instantly
Instant Download Access after purchase
Buy NowInstant download
We Accept:

Reviews( 0 )
$11.00
Can't find what you want? Try our AI powered Search
Document information
Connected school, study & course
About the document
Uploaded On
Jul 13, 2021
Number of pages
26
Written in

Additional information
This document has been written for:
Uploaded
Jul 13, 2021
Downloads
0
Views
60

.png)

.png)
.png)
.png)


.png)


