1/13/2019 Week 1: Homework: Statistics for Decision-Making - 10558
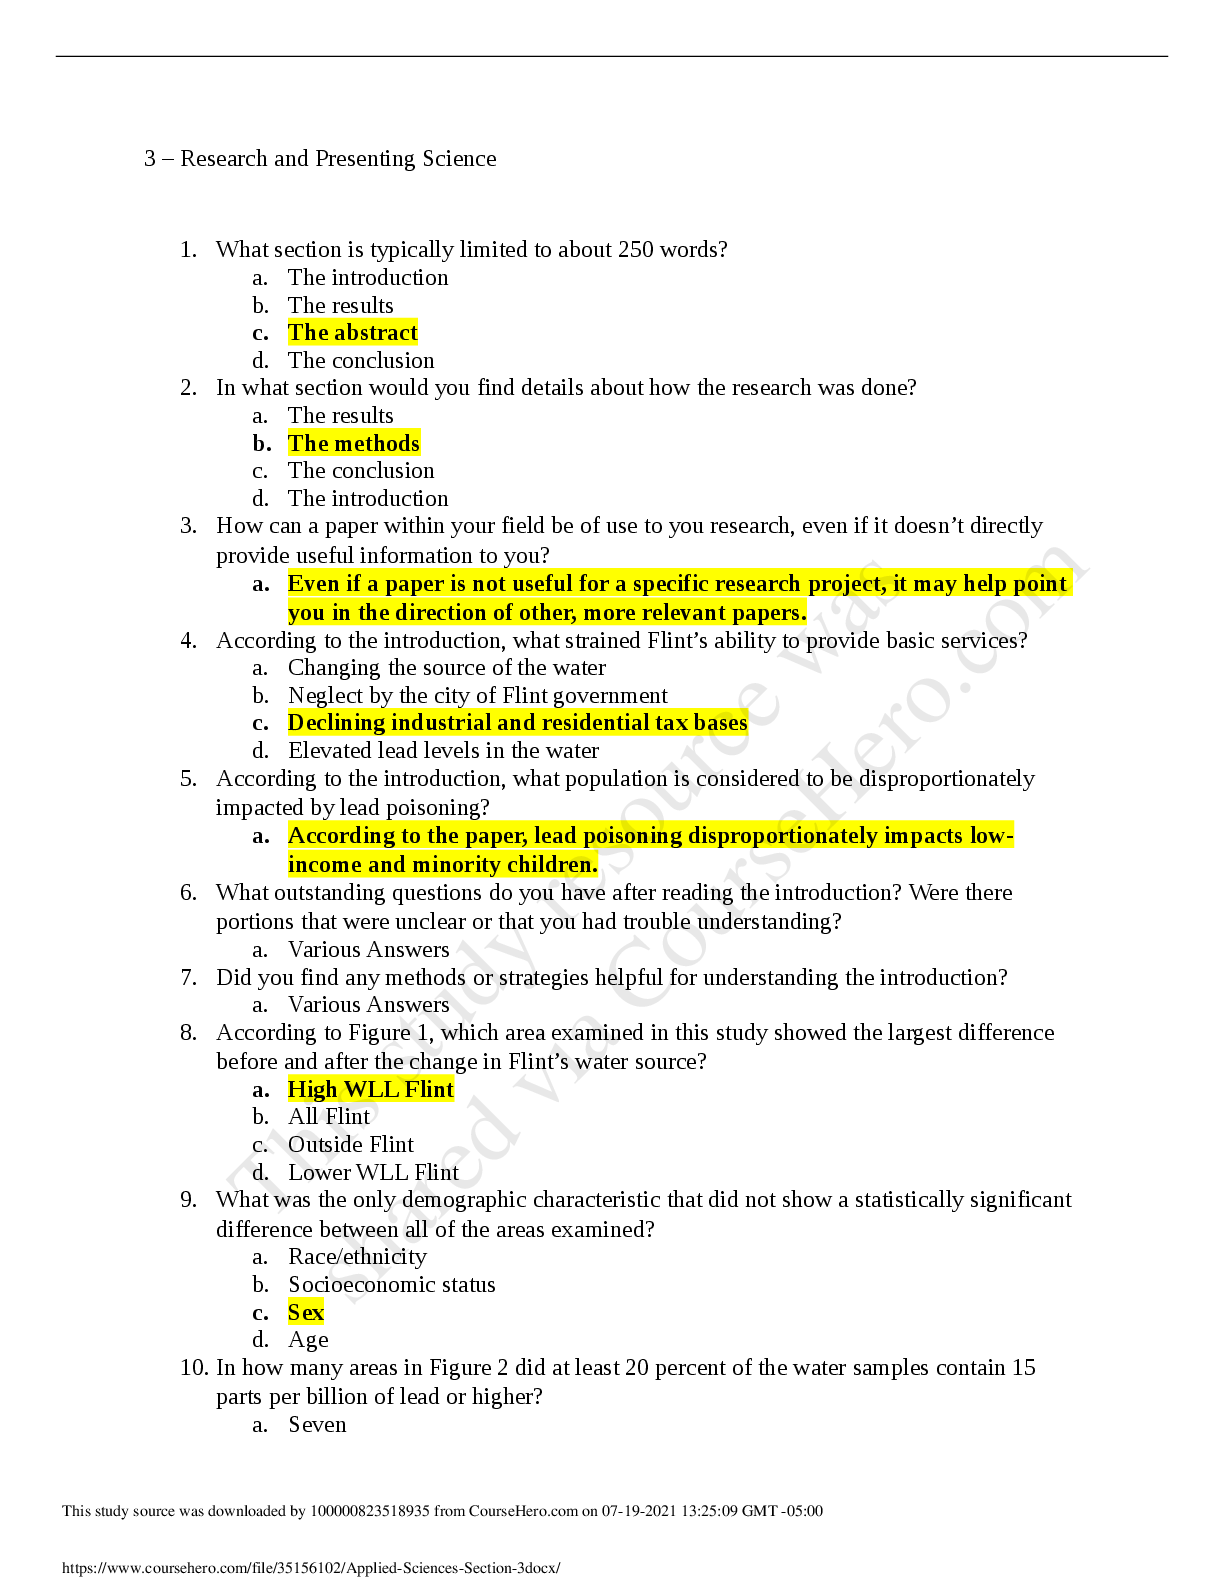
https://devryu.instructure.com/courses/36675/quizzes/122841 1/11
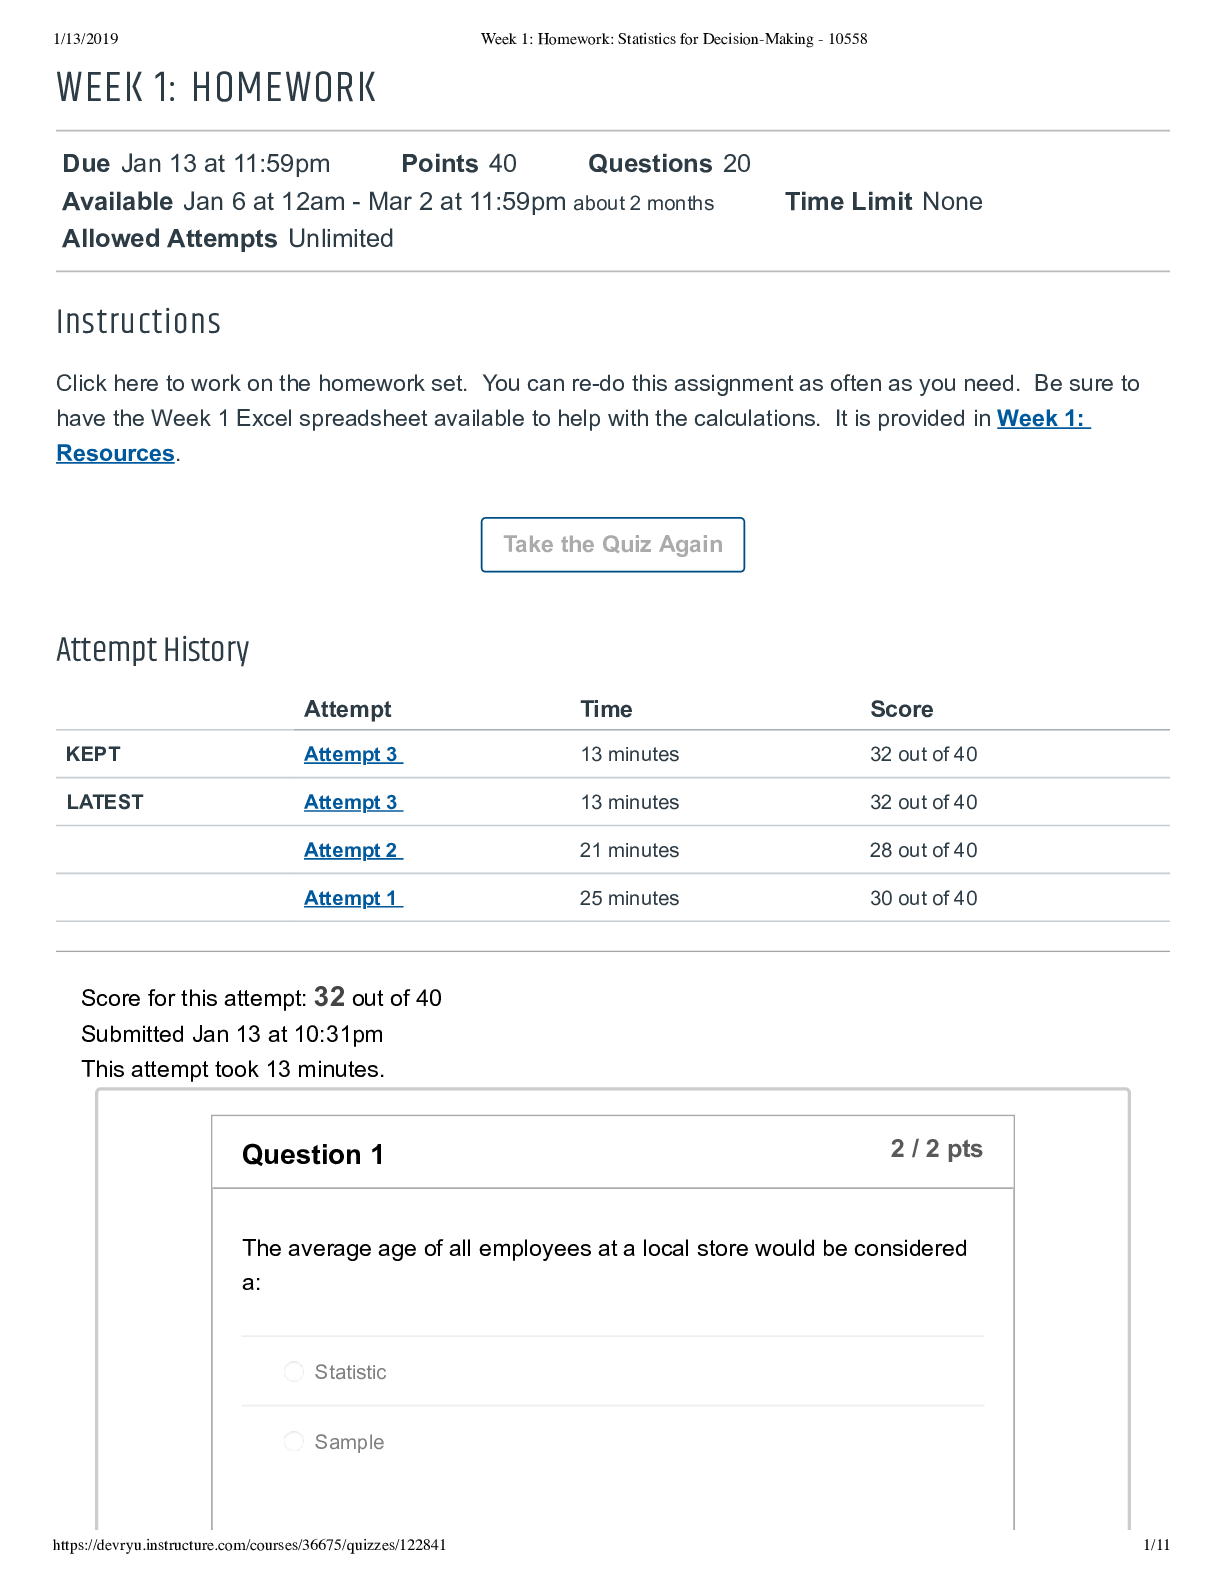
WEEK 1: HOMEWORK
Due Jan 13 at 11:59pm Points 40 Questions 20
Available Jan 6 at 12a
...
1/13/2019 Week 1: Homework: Statistics for Decision-Making - 10558
https://devryu.instructure.com/courses/36675/quizzes/122841 1/11
WEEK 1: HOMEWORK
Due Jan 13 at 11:59pm Points 40 Questions 20
Available Jan 6 at 12am Mar 2 at 11:59pm about 2 months Time Limit None
Allowed Attempts Unlimited
Instructions
Attempt History
Attempt Time Score
KEPT Attempt 3 13 minutes 32 out of 40
LATEST Attempt 3 13 minutes 32 out of 40
Attempt 2 21 minutes 28 out of 40
Attempt 1 25 minutes 30 out of 40
Score for this attempt: 32 out of 40
Submitted Jan 13 at 10:31pm
This attempt took 13 minutes.
Click here to work on the homework set. You can redo this assignment as often as you need. Be sure to
have the Week 1 Excel spreadsheet available to help with the calculations. It is provided in Week 1:
Resources.
Take the Quiz Again
Question 1 2 / 2 pts
The average age of all employees at a local store would be considered
a:
Statistic
Sample1/13/2019 Week 1: Homework: Statistics for Decision-Making - 10558
https://devryu.instructure.com/courses/36675/quizzes/122841 2/11
Correct! Correct! Parameter
Population
Question 2 2 / 2 pts
In a survey of 1000 adults, 34% found they prefer charcoal to gas grills.
The 1000 would be considered a:
Correct! Correct! Sample
Statistic
Population
Parameter
Question 3 0 / 2 pts
Inferential statistics is when sample data is used to:
Calculate a mean
Correct Answer Correct Answer Say something about the population
Y You Answered ou Answered Determine when an event is most likely to occur
Influence a decision maker1/13/2019 Week 1: Homework: Statistics for Decision-Making - 10558
https://devryu.instructure.com/courses/36675/quizzes/122841 3/11
Question 4 2 / 2 pts
The hair color of the players on a tennis team would be considered:
Ordinal data
Correct! Correct! Nominal data
Interval data
Ratio data
Question 5 0 / 2 pts
Marriage status (married, single, etc.) of the faculty at a university would
be considered:
Y You Answered ou Answered Ordinal data
Correct Answer Correct Answer Qualitative data
Quantitative data
Ratio data
Question 6 0 / 2 pts
The nationalities (for example, Asian, European, etc.) listed in a recent
survey would be considered:1/13/2019 Week 1: Homework: Statistics for Decision-Making - 10558
https://devryu.instructure.com/courses/36675/quizzes/122841 4/11
Correct Answer Correct Answer Nominal data
Y You Answered ou Answered Ordinal data
Ratio data
Interval data
Question 7 2 / 2 pts
Sixteen students are randomly selected from each grade level at a high
school and asked about their eating habits. This sampling technique is
called:
Convenience
Correct! Correct! Stratified
Cluster
Random
Question 8 2 / 2 pts
Cameras are set up to watch an intersection and determine how many
cars are let through with each green light interval. This study design
would be considered:
Survey
Correct! Correct! Observational1/13/2019 Week 1: Homework: Statistics for Decision-Making - 10558
https://devryu.instructure.com/courses/36675/quizzes/122841 5/11
Experimental
Simulation
Question 9 2 / 2 pts
Which of the following would be the mean of this data set: 5, 7, 12, 56,
4, 2, 33, 21
Correct! Correct! 17.5
140.0
8.0
18.7
Question 10 2 / 2 pts
Which of the following would be the standard deviation of this sample
data set: 67, 54, 30, 77, 92, 41, 75, 81
Correct! Correct! 21.2
517.0
19.9
64.61/13/2019 Week 1: Homework: Statistics for Decision-Making - 10558
https://devryu.instructure.com/courses/36675/quizzes/122841 6/11
Question 11 2 / 2 pts
Which of the following would be the variance of this population data set:
3, 6, 8, 9, 4, 5, 7, 1, 9, 7, 5, 4, 13, 9
12.00
9.49
Correct! Correct! 8.82
2.97
Question 12 2 / 2 pts
The difference between cluster sampling and stratified sampling would
be:
Cluster divides the population into groups and uses all in selected group
while stratified uses some only in selected groups.
Each divides the population into groups. Stratified sampling uses some
in each group while cluster uses all in selected groups.
Correct! Correct!
There is no difference. It is two names for the same type of sampling.
Each divides the population into groups. Cluster sampling uses some in
each group while stratified uses all in selected groups.1/13/2019 Week 1: Homework: Statistics for Decision-Making - 10558
https://devryu.instructure.com/courses/36675/quizzes/122841 7/11
Question 13 0 / 2 pts
If data set A has a larger mean than data set B, what would be different
about their distributions?
The distribution of data set A would generally be to the left of the
distribution of data set B
Y You Answered ou Answered
Data set A would have flatter distribution with more data in each tail
The distribution of data set A would generally be to the right of the
distribution of data set B
Correct Answer Correct Answer
Data set A would have more data near the center of the distribution
Question 14 2 / 2 pts
In a normally distributed data set a mean of 55 where 99.7% of the data
fall between 47.5 and 62.5, what would be the standard deviation of that
data set?
Correct! Correct! 2.5
5.0
5.7
7.51/13/2019 Week 1: Homework: Statistics for Decision-Making - 10558
https://devryu.instructure.com/courses/36675/quizzes/122841 8/11
Question 15 2 / 2 pts
Which of the following data sets would you expect to have the highest
standard deviation?
The number of phones a person owns
Amount of soda in an unopened can (in ounces)
Correct! Correct! Ages of people taking college classes (in years)
Weight of an orange (in ounces)
Question 16 2 / 2 pts
Which data outcome of the speed of cars would best support removing
a speed camera?
High mean with small standard deviation
Low mean with high standard deviation
High mean with high standard deviation
Correct! Correct! Low mean with low standard deviation
Question 17 2 / 2 pts
In manufacturing, convenience sampling could be used to determine if
the machines are operating correctly. Which of the following best
describes this type of sampling?1/13/2019 Week 1: Homework: Statistics for Decision-Making - 10558
https://devryu.instructure.com/courses/36675/quizzes/122841 9/11
Products are put into groups and some are randomly selected from each
group
Every 10th product in the line is selected
Products are put into groups and all are included from several randomly
selected groups
Correct! Correct! Samples are randomly selected throughout the day
Question 18 2 / 2 pts
A graph shows a line connecting the tops of vertical bars with the
number of data points on the yaxis and groups on the xaxis. This
graphic is most likely to be:
A stemleaf plot
A frequency histogram
Correct! Correct! A frequency polygon
A dot plot
Question 19 2 / 2 pts
Match the terms and their definitions
Vertical bar chart that
shows frequency on the yCorrect! Correct! Histogram1/13/2019 Week 1: Homework: Statistics for Decision-Making - 10558
https://devryu.instructure.com/courses/36675/quizzes/122841 10/11
axis
A sample where the
population is divided into
groups and several
groups are randomly
selected from all from
those selected groups are
sampled
Correct! Correct! Cluster sample
Collection of all counts
that are of interest
Correct! Correct! Populaƭon
A subset or part of a
population
Correct! Correct! Sample
A sample where the
population is divided into
groups and several are
randomly sampled form
each group
Correct! Correct! Straƭfied sample
Consists of attributes,
labels, or nonnumerical
entries
Correct! Correct! Qualitaƭve data
Question 20 2 / 2 pts
Match the terms and their definitions
The most frequent number
appearing in a dataset
Correct! Correct! Mode
Correct! Correct! The average Mean1/13/2019 Week 1: Homework: Statistics for Decision-Making - 10558
https://devryu.instructure.com/courses/36675/quizzes/122841 11/11
The percentage of data
that falls within 1, 2, or 3
standard deviations of the
mean in a symmetrical,
bellshaped distribution
Correct! Correct! Empirical Rule
The square root of the
variance
Correct! Correct! Standard deviaƭon
Show how far a particular
data point is from the
mean in terms of the
number of standard
deviations
Correct! Correct! Standard score
Quiz Score: 32 out of 40
[Show More]


.png)


 Block 1 to 7.png)
.png)


 Charles Herrick - 100 Q&A About Alcoholism & Drug Addiction-Jones and Bartlett Publishers, Inc.png)