NR 503
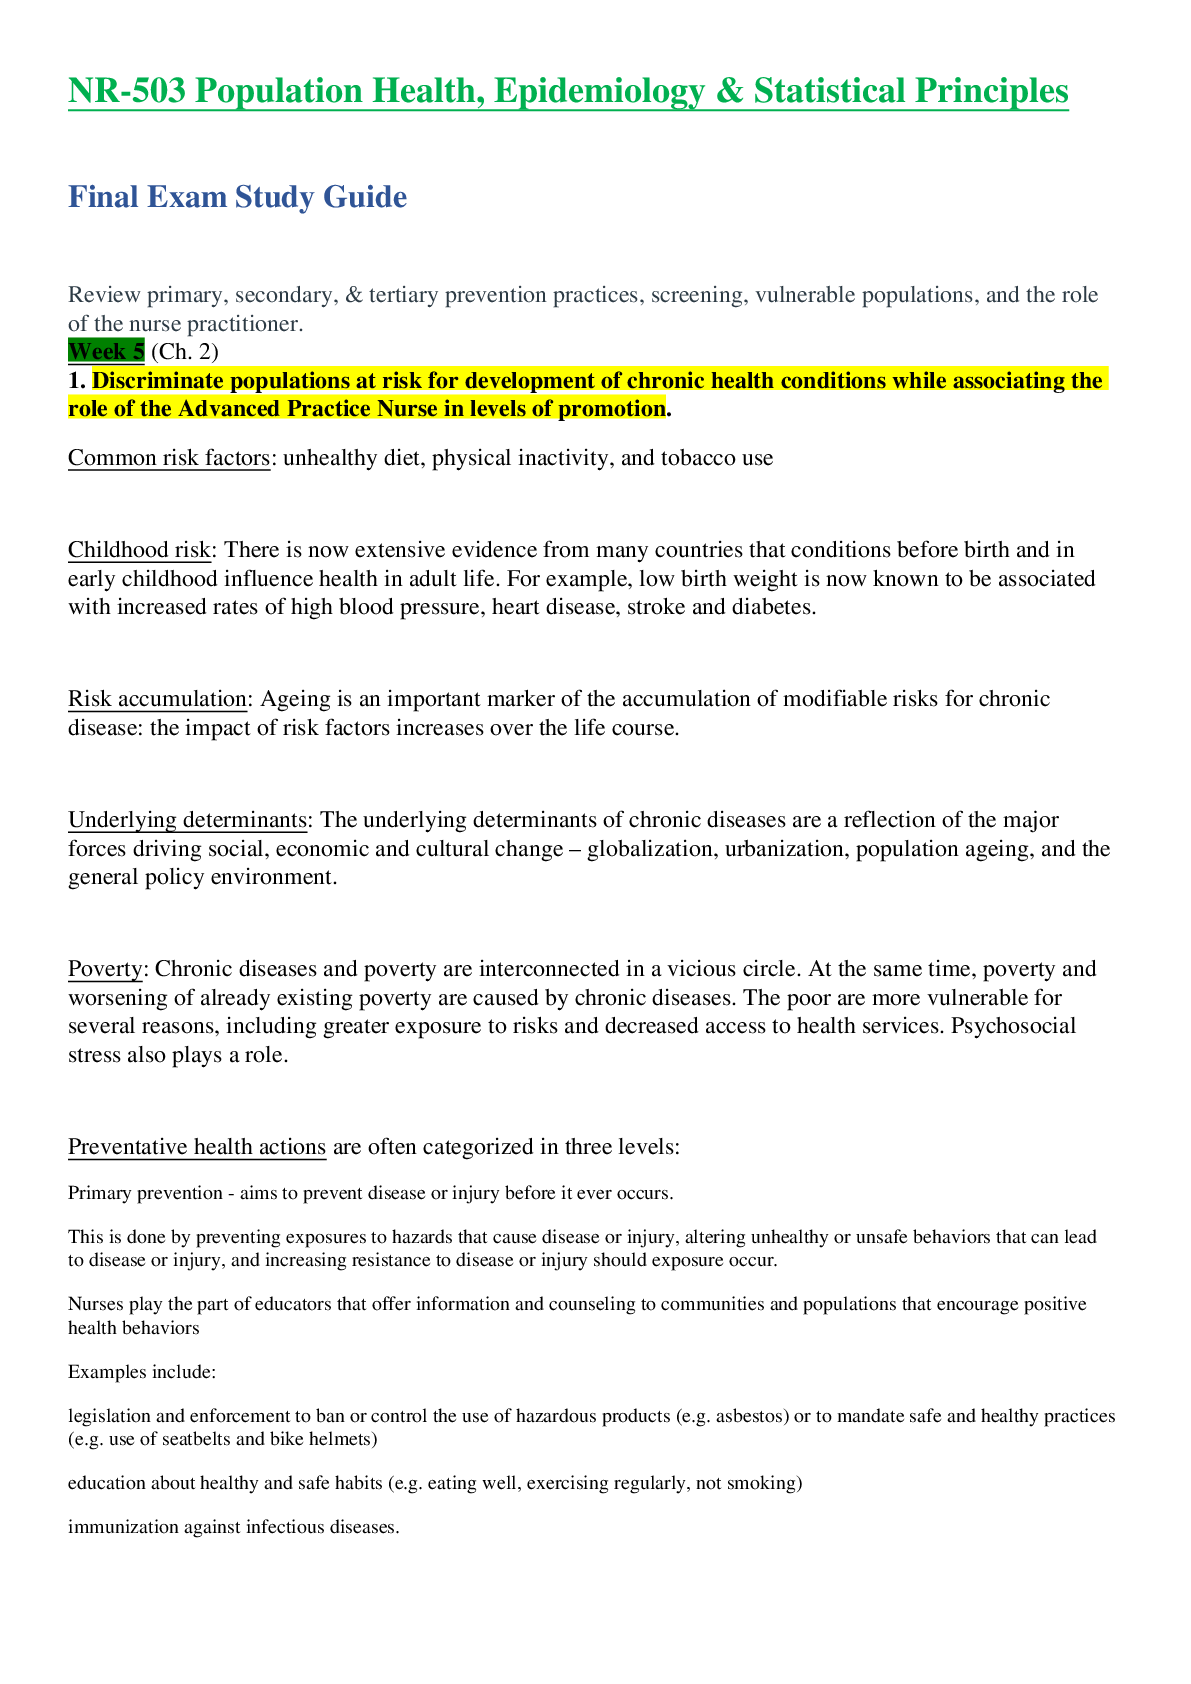
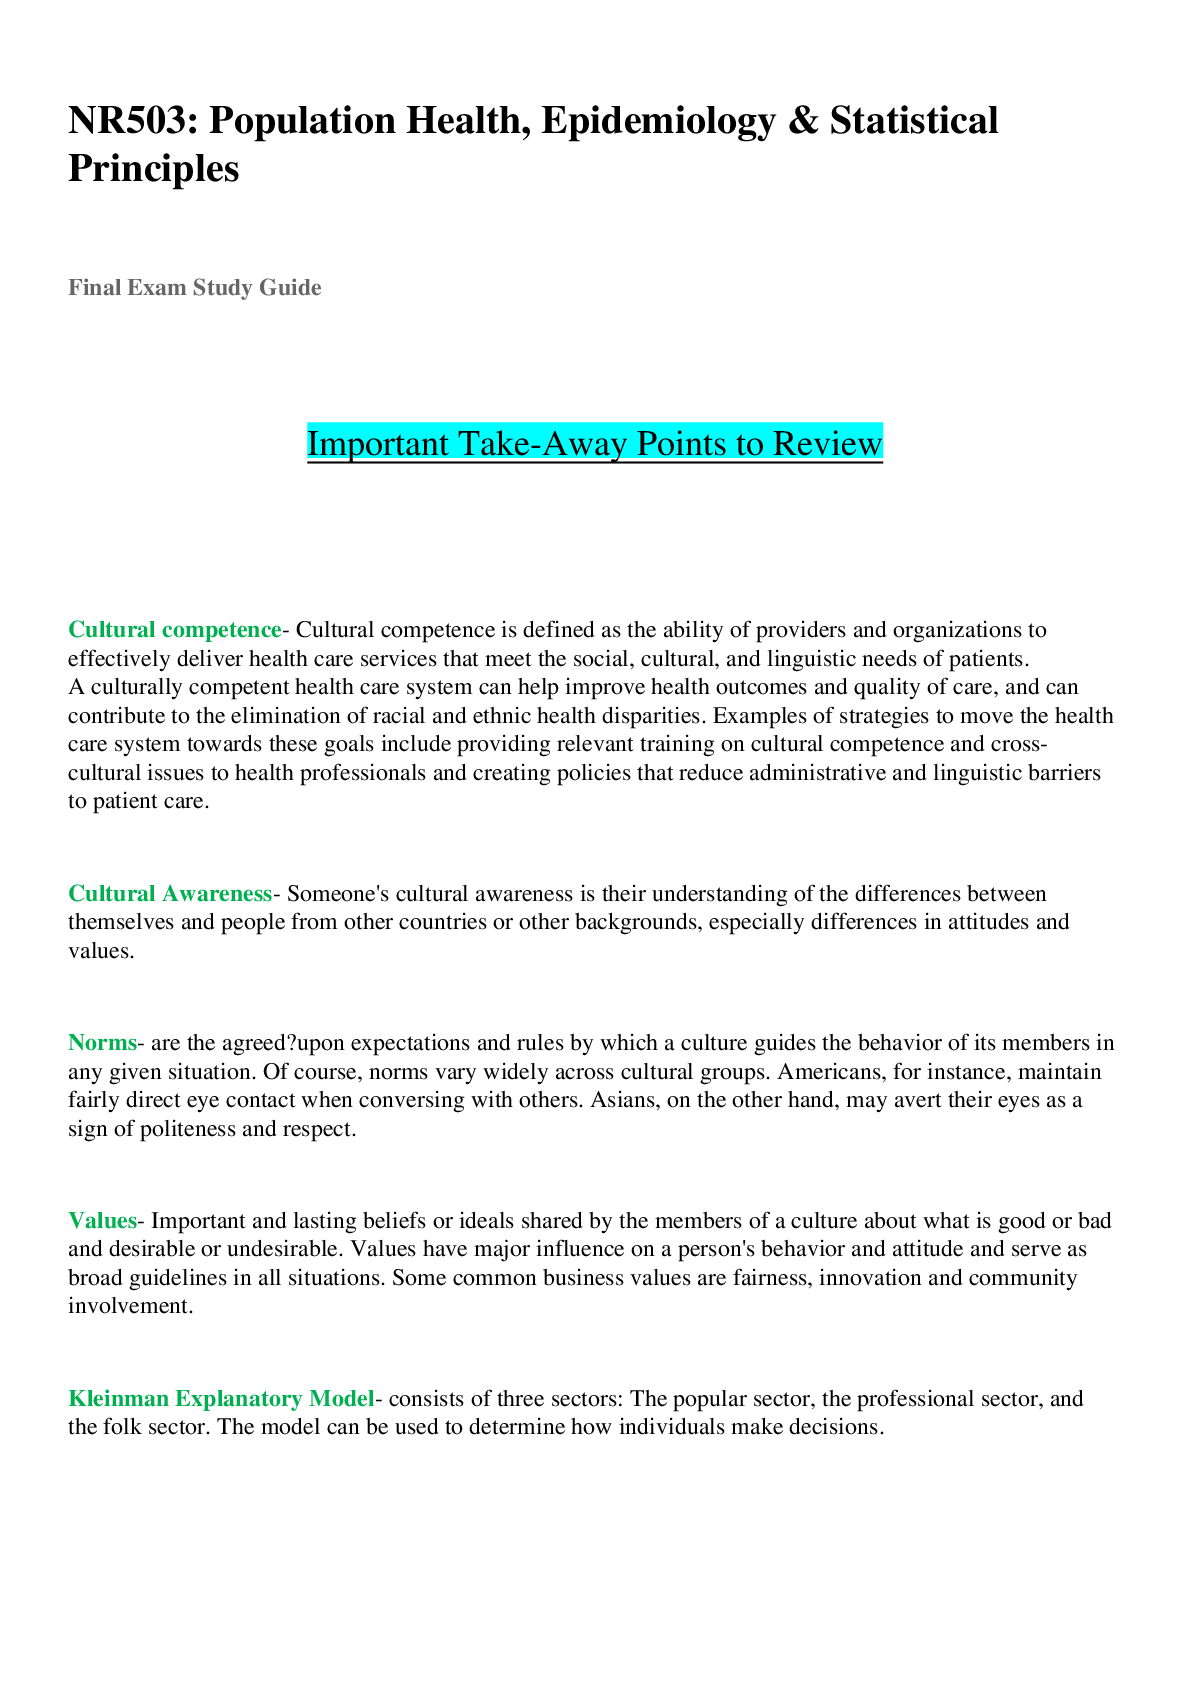
Study Guide for Final Exam
1. Objectives of epidemiology
a. Understand the aetiology or cause of a disease (risk factors)
b. Find out the extent that a disease or health problem affects a community or popula
...
NR 503
Study Guide for Final Exam
1. Objectives of epidemiology
a. Understand the aetiology or cause of a disease (risk factors)
b. Find out the extent that a disease or health problem affects a community or population
c. Determine the natural history or prognosis
d. Evaluate existing and newly developed preventative therapeutic measures and modes of healthcare delivery
2. Define, compare, calculate, and interpret Measures of Morbidity
a. Incidence rate: measurement of the number of new individuals who contract a disease during a particular period of time
i. Calculation: Number of new cases of disease or injury during specified period DIVIDED BY Size of population at start of period
b. Attack rate: Same as risk, proportion of individuals in a population (initially free of disease) who develop the disease within a specified time interval.
i. Calculation: Total number of new cases DIVIDED BY The total population
c. Prevalence: measurement of all individuals affected by the disease at a particular time
i. Calculation: Number of new cases of disease or injury during specified period DIVIDED BY Time each person was observed, totaled for all persons
d. These rates are used to measure disease occurrence and make comparisons between population groups. They are commonly used measures that help our understanding of the distribution of disease in a given population.
3. Understand why incidence data are important for measuring risk.
a. Incidence is important for measuring risk because it tells you the rate at which new people are contracting the disease
4. Define, compare, calculate, and interpret Measures of Mortality
a. Mortality: a measure of the frequency of occurrence of death in a defined population during a specified interval. Morbidity and mortality measures are often the same mathematically; it's just a matter of what you choose to measure, illness or death.
i. Calculation: Deaths occurring during a given time period DIVIDED BY Size of the population among which the deaths occurred TIMES 10n
b. Cause-specific mortality rate: The mortality rate from a specified cause for a population.
i. Calculation: The number of deaths attributed to a specific cause DIVIDED BY The size of the population at the midpoint of the time period
c. Annual mortality rate: The rate of death in a one-year period.
i. Calculation: Deaths occurring within the one-year period DIVIDED BY Size of population in which the deaths occured
d. Case-fatality: the proportion of deaths within a designated population of "cases" (people with a medical condition) over the course of the disease
i. Calculation: he number of deaths from a specified disease over a defined period of time DIVIDED BY The number of individuals diagnosed with the disease during that time TIMES 100 (final answer should be percentage)
e. Proportionate mortality: the proportion of deaths in a particular population over a specified period of time, attributable to different causes
i. Calculation: Number of deaths within a population due to a specific disease or cause DIVIDED BY the total number of deaths in the population during a time period such as a year.
5. Assess the Validity and Reliability of Diagnostic and Screening Tests
a. Define, compare and calculate measures of validity, including sensitivity and specificity.
i. Sensitivity identifies the proportion of individuals who truly DO have the disease AND are given a positive test result. I find it helpful to remember: sensiTivity = sensitive to the Truth (i.e. do have disease + do have positive result)
1. We want to know what proportion of individuals who have the disease (a+c) were given a positive test result (a), therefore…
a. Sensitivity = a/(a+c)
ii. Specificity identifies the proportion of individuals who truly DO NOT have the disease AND were given the correct negative test result. I find it helpful to remember: specificity = speciFies the False (i.e. do not have disease and do not have positive test result
1. This time we want to know what proportion of people who do not have the disease (b+d) were given the correct negative test result (d), therefore…
a. Specificity = d/(b+d).
b. Define and calculate positive predictive value.
i. Positive Predictive Value: The probability that subjects with a positive screening test truly have the disease.
1. Calculation: a/(a+c)
c. Understand positive predictive value (PPV) and relationship to disease prevalence and specificity of a screening test.
i. Higher prevalence/specificity rates=higher ppv rates
6. Epidemiologic transition
a. Phase of development witnessed by a sudden and stark increase in population growth rates brought by improved food security and innovations in public health and medicine, followed by a re-leveling of population growth due to subsequent declines in fertility rates.
7. Study designs (case-control, cross sectional, prospective and retrospective cohort, clinical trial)
a. Case-control study: An observational study that compares patients who have a disease or outcome of interest (cases) with patients who do not have the disease or outcome (controls) and looks back retrospectively to compare how frequently the exposure to a risk factor is present in each group to determine the relationship between the risk factor and the disease.
i. Incidence Density Sampling: the selection of controls is governed by the diagnoses of cases. Every time a case is diagnosed one or more controls are selected. from other members of the cohort who, at that time, do not have the diagnosis.
ii. Selection Bias: cases (or controls) are included in (or excluded from) a study because of some characteristic they exhibit which is related to exposure to the risk factor under evaluation
b. Cross-Sectional study: A type of observational study that analyzes data from a population, or a representative subset, at a specific point in time
i. Nonresponse Bias: Non-response can result in bias of the measures of outcome. This is a particular problem when the characteristics of non-responders differ from responders.
c. Prospective Cohort study: longitudinal cohort study that follows over time a group of similar individuals (cohorts) who differ with respect to certain factors under study, to determine how these factors affect rates of a certain outcome.
i. Information Bias: collect different quality and extent of information from exposed and not exposed groups
d. Retrospective Cohort study: A longitudinal study where the participants already have a known disease or outcome. The study looks back into the past to try to determine why the participants have the disease or outcome and when they may have been exposed
i. Recall bias: but subjects may have difficulty remembering past exposures, and their recollection may be biased
e. Clinical Trial: any research study that prospectively assigns human participants or groups of humans to one or more health-related interventions to evaluate the effects on health outcomes.
i. Detection bias: systematic differences between groups in how outcomes are determined
8. Causal Inferences
a. Identify, define and provide examples for common biases in different epidemiological studies, including selection bias and information bias (e.g., recall, misclassification, differential classification, etc.).
i. Selection Bias: ^
ii. Information Bias: ^
iii. Recall Bias: ^
iv. Misclassification bias: Also refereed to as information bias
v. Differential Classification bias: happens when the information errors differ between groups. In other words, the bias is different for exposed and non-exposed, or between those who have the disease and those do have not.
b. Factors that could increase or decrease bias.
i. Increase: poorly researched or gathered data
ii. Decrease: blind studies
c. Define confounding and be able to identify confounding factors in a study and approaches to handling confounding.
i. Confounding: A situation in which the effect or association between an exposure and outcome is distorted by the presence of another variable. Positive confounding (when the observed association is biased away from the null) and negative confounding (when the observed association is biased toward the null) both occur.
1. also known as a third variable or a mediator variable, influences both the independent variable and dependent variable. Being unaware of or failing to control for confounding variables may cause the researcher to analyze the results incorrectly
9. Understand the guidelines for determining if an observed association is causal (Bradford-Hill criterion)
a. Temporal: Exposure always precedes the outcome. If factor "A" is believed to cause a disease, then it is clear that factor "A" must necessarily always precede the occurrence of the disease. This is the only absolutely essential criterion.
b. Strength of association: This is defined by the size of the association as measured by appropriate statistical tests. The stronger the association, the more likely it is that the relation of "A" to "B" is causal.
c. Dose-response: An increasing amount of exposure increases the risk. If a dose-response relationship is present, it is strong evidence for a causal relationship.
d. Replication of findings (Consistency): The association is consistent when results are replicated in studies in different settings using different methods. That is, if a relationship is causal, we would expect to find it consistently in different studies and among different populations.
e. Biologic plausibility: The association agrees with currently accepted understanding of pathological processes. In other words, there needs to be some theoretical basis for positing an association between a vector and disease, or one social phenomenon and another.
f. Alternate explanations: In judging whether a reported association is causal, it is necessary to determine the extent to which researchers have taken other possible explanations into account and have effectively ruled out such alternate explanations.
g. Cessation of exposure: may not reverse or appreciably slow the progression of disease. In some cases, multiple risk factors, including diet, exercise, smoking, chemical exposures, and genetic predisposition can contribute to disease onset and progression.
h. Consistency with other knowledge: The association should be compatible with existing theory and knowledge. In other words, it is necessary to evaluate claims of causality within the context of the current state of knowledge within a given field and in related fields.
i. Specificity of the association: This is established when a single putative cause produces a specific effect. This is considered by some to be the weakest of all the criteria. The diseases attributed to cigarette smoking, for example, do not meet this criteria. When specificity of an association is found, it provides additional support for a causal relationship. However, absence of specificity in no way negates a causal relationship.
10. Estimating Risks (risk measures)
a. Calculate and interpret relative risk in a cohort study (i.e., estimate of the risk measure).
i. Relative Risk: the ratio of the probability of an event occurring (for example, developing a disease, being injured) in an exposed group to the probability of the event occurring in a comparison, non-exposed group.
1. Calculation: the probability of an event occurring for group 1 DIVIDED BY the probability of an event occurring for group 2
b. Interpret an odds ratio in a cohort study and in a case-control study
i. Odds Ratio: they refer to the ratio of the odds of an event occurring in the exposed group versus the unexposed group.
ii. Relative Risk is very similar to Odds Ratio, however, RR is calculated by using percentages, whereas Odds Ratio is calculated by using the ratio of odds
c. Calculate and interpret absolute risk
i. Absolute Risk: is the absolute difference in outcomes between one group (usually the control group) and the group receiving treatment. The percentage tells you how much the risk of something happening decreases if a certain intervention happens.
1. Calculation: the number of events (good or bad) in treated or control groups DIVIDED BY the number of people in that group.
d. Purpose of matching in case-control studies
i. Matching of cases and controls is frequently employed to control the effects of known potential confounding variables.
11. Attributable Risk
a. Calculate and interpret the attributable risk for an exposed group and a population.
i. Attributable Risk: also known as excess risk, this is the difference in rate of a condition between an exposed population and an unexposed population.
1. Calculation: AR=Ie-Iu
a. Once AR is calculated, then percent can be determined
i. 100 TIMES (Ie-Iu)/Ie
b. Ie = Incidence in exposed
c. Iu = Incidence in unexposed
b. Comparison of relative risk and attributable risk
i. Relative risk estimates the magnitude of an association between exposure and disease, based on the incidence of disease in the exposed group relative to the unexposed group. Attributable risk, or risk difference, is the absolute difference in incidence between an exposed and unexposed group.
12. Randomized trials
a. Internal validity: how well an experiment is done, especially whether it avoids confounding (more than one possible independent variable [cause] acting at the same time). The less chance for confounding in a study, the higher its internal validity is.
b. Generalizability (external validity): the validity of generalized (causal) inferences in scientific research, usually based on experiments as experimental validity. In other words, it is the extent to which the results of a study can be generalized to other situations and to other people.
13. Evaluating Screening Programs
a. Sources of bias that must be taken into account in assessing study findings, including referral bias, length-biased sampling, lead-time bias, five-year survival, and over-diagnosis bias.
i. Referral Bias: a situation where the chance of exposed cases being admitted to the study is different to exposed controls. This happens frequently when cases are selected in a hospital whose activity is linked to the studied exposure.
ii. Length-Biased sampling: a form of selection bias, a statistical distortion of results that can lead to incorrect conclusions about the data. Length time bias can occur when the lengths of intervals are analysed by selecting intervals that occupy randomly chosen points in time or space.
iii. Lead-time Bias: the length of time between the detection of a disease (usually based on new, experimental criteria) and its usual clinical presentation and diagnosis (based on traditional criteria).
iv. Five-Year Survival: a type of survival rate for estimating the prognosis of a particular disease, normally calculated from the point of diagnosis. Lead time bias from earlier diagnosis can affect interpretation of the five-year survival rate.
v. Over-Diagnosis Bias: the diagnosis of "disease" that will never cause symptoms or death during a patient's ordinarily expected lifetime. Overdiagnosis is a side effect of screening for early forms of disease.
14. Considerations when evaluating individual data
a) Are the characteristics of the two groups comparable—demographically, medically, and in terms of factors relating to prognosis?
b) Are the measurement methods comparable (e.g., diagnostic methods and the way disease is classified) in both groups?
15. Calculations and interpretations
a. Risk ratio: the ratio of the probability of an event occurring (for example, developing a disease, being injured) in an exposed group to the probability of the event occurring in a comparison, non-exposed group.
b. Relative risk: See ^
c. Odds ratio: they refer to the ratio of the odds of an event occurring in the exposed group versus the unexposed group
d. Attributable risk: also known as excess risk, this is the difference in rate of a condition between an exposed population and an unexposed population.
e. Incidence rate: measurement of the number of new individuals who contract a disease during a particular period of time
f. Disease incidence: conveys information about the risk of contracting the disease
g. Annual mortality rate: or death rate, is a measure of the number of deaths (in general, or due to a specific cause) in a particular population, scaled to the size of that population, per unit of time.
h. Positive predictive value: The probability that subjects with a positive screening test truly have the disease.
i. Sensitivity: identifies the proportion of individuals who truly DO have the disease AND are given a positive test result.
j. Specificity: identifies the proportion of individuals who truly DO NOT have the disease AND were given the correct negative test result.
k. Prevalence: indicates how widespread the disease is
l. Concordance rate: the probability that a pair of individuals will both have a certain characteristic, given that one of the pair has the characteristic.
[Show More]