MAT 300 Final Exam Answers Sophia (A GUARANTEED)
1
Adam tabulated the values for the average speeds on each day of his road trip as 60.5, 63.2, 54.7, 51.6,
72.3, 70.7, 67.2, and 65.4 mph. The sample standard deviatio
...
MAT 300 Final Exam Answers Sophia (A GUARANTEED)
1
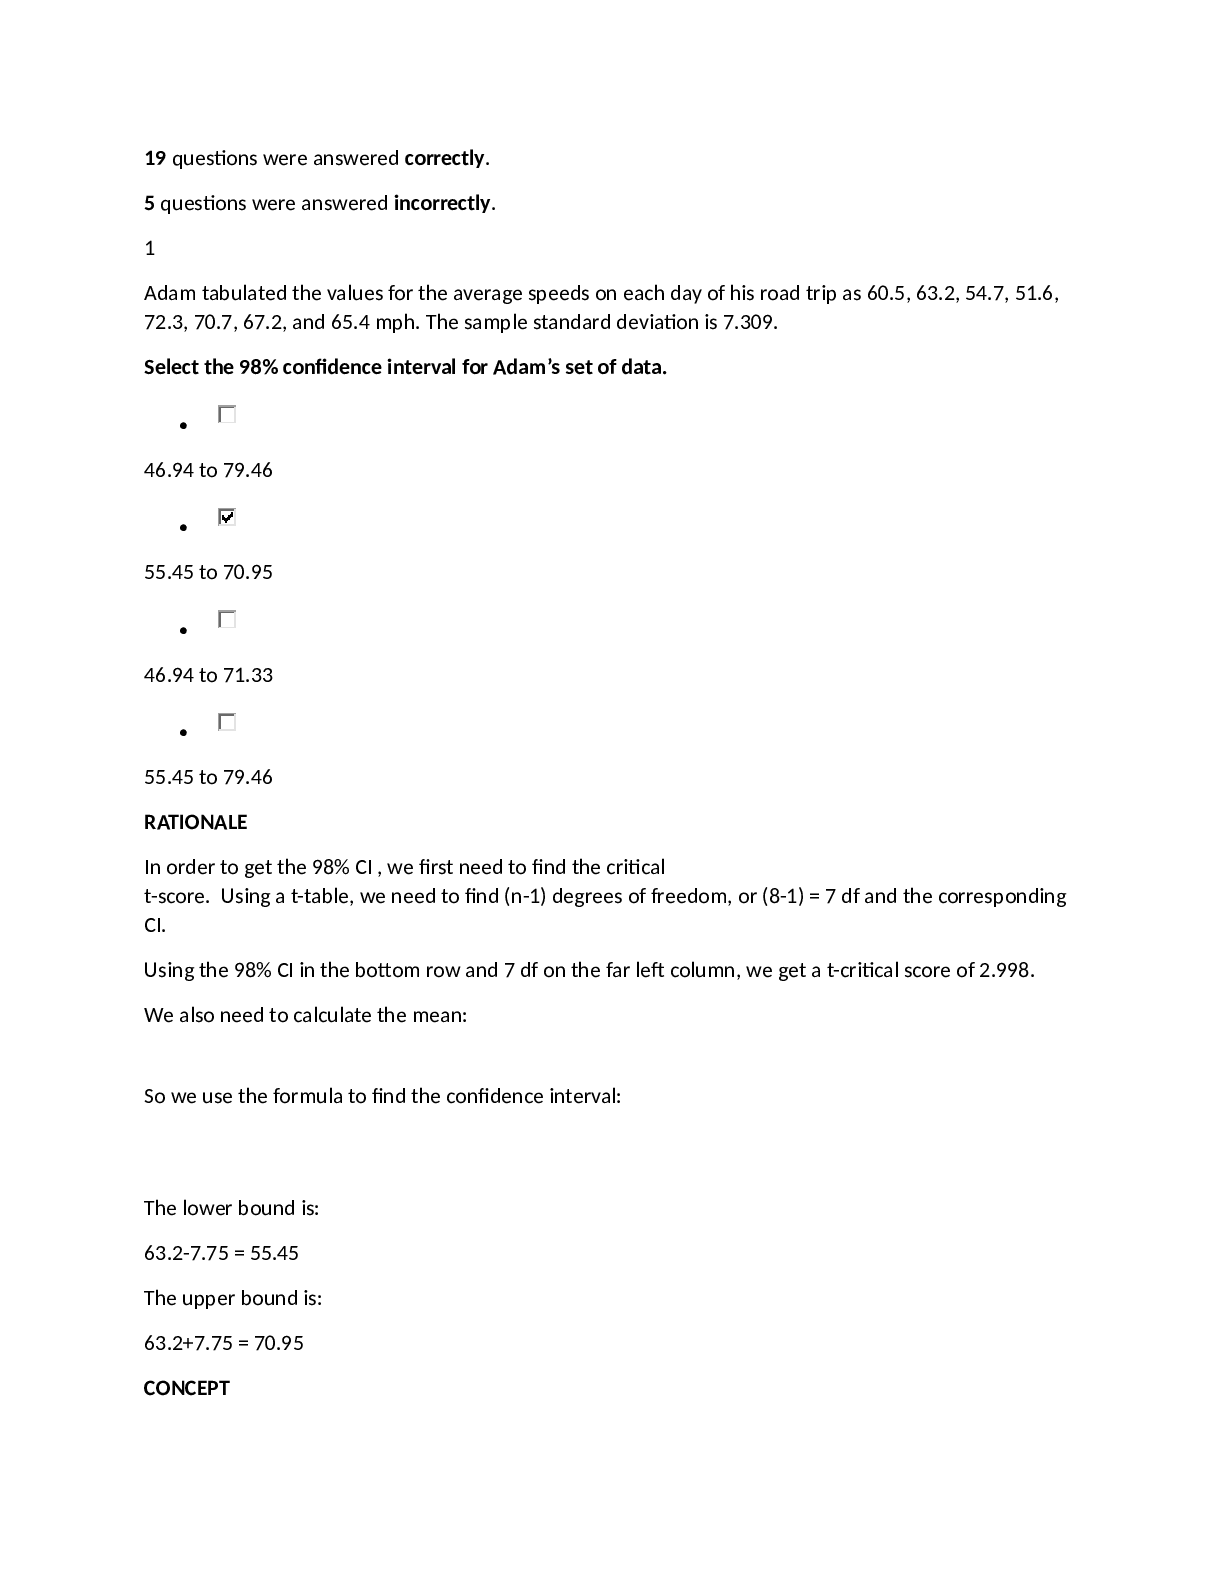
Adam tabulated the values for the average speeds on each day of his road trip as 60.5, 63.2, 54.7, 51.6,
72.3, 70.7, 67.2, and 65.4 mph. The sample standard deviation is 7.309.
Select the 98% confidence interval for Adam’s set of data.
46.94 to 79.46
55.45 to 70.95
46.94 to 71.33
55.45 to 79.46
RATIONALE
In order to get the 98% CI , we first need to find the critical
t-score. Using a t-table, we need to find (n-1) degrees of freedom, or (8-1) = 7 df and the corresponding
CI.
Using the 98% CI in the bottom row and 7 df on the far left column, we get a t-critical score of 2.998.
We also need to calculate the mean:
So we use the formula to find the confidence interval:
The lower bound is:
63.2-7.75 = 55.45
The upper bound is:
63.2+7.75 = 70.95
CONCEPT
Confidence Intervals Using the T-Distribution
2
A table represents the number of students who passed or failed an aptitude test at two different
campuses.
South Campus North Campus
Passed 42 31
Failed 58 69
In order to determine if there is a significant difference between campuses and pass rate, the chi-square
test for association and independence should be performed.
What is the expected frequency of South Campus and passed?
50 students
36.5 students
42 students
43.7 students
RATIONALE
In order to get the expected counts we can note the formula is:
CONCEPT
Chi-Square Test for Homogeneity
3
Sukie interviewed 125 employees at her company and discovered that 21 of them planned to take an
extended vacation next year.
What is the 95% confidence interval for this population proportion? Answer choices are rounded to
the hundredths place.
0.10 to 0.23
0.16 to 0.17
0.11 to 0.16
0.11 to 0.21
RATIONALE
In order to get the CI we want to use the following form.
First, we must determine the corresponding z*score for 95% Confidence Interval. Remember, this
means that we have 5% for the tails, meaning 5%, or 0.025, for each tail. Using a z-table, we can find
the upper z-score by finding (1 - 0.025) or 0.975 in the table.
This corresponding z-score is at 1.96.
We can know
So putting it all together:
The lower bound is:
0.168-0.065 =0.103 or 0.10
The upper bound is:
0.168+0.065 =0.233 or 0.23
CONCEPT
Confidence Interval for Population Proportion
4
A market research company conducted a survey of two groups of students from different schools. They
found that students from school A spent an average of 90 minutes studying daily, while the students
from school B spent an average of 75 minutes daily.
They want to find out if the difference in the mean times spent studying by the students of the two
schools is statistically significant.
Which of the following sets shows the correct null hypothesis and alternative hypothesis?
Null Hypothesis: There is no difference in the mean times spent by the schools' students.
Alternative Hypothesis: There is at least some difference in the mean times spent by the schools'
students.
Null Hypothesis: There is at least some difference in the mean times spent by the schools' students.
Alternative Hypothesis: The students from school B spend more time studying than the students from
school A.
Null Hypothesis: The difference in the mean times spent by the schools' students is 15 minutes.
Alternative Hypothesis: There is no difference in the mean times spent by the schools' students.
Null Hypothesis: School B students spend more time studying than School A.
Alternative Hypothesis: The difference in the mean times spent by the schools' students is 15 minutes.
RATIONALE
Recall that the null hypothesis is always of no difference.
So the null hypothesis (Ho) is that the mean time studying for group A = mean for group B. This would
indicate no difference between the two groups.
The alternative hypothesis (Ha) is that there is difference in the mean study time between the two
groups.
CONCEPT
Hypothesis Testing
5
Carl recorded the number of customers who visited his new store during the week:
Day Customers
Monday 17
Tuesday 13
Wednesday 14
Thursday 16
He expected to have 15 customers each day. To answer whether the number of customers follows a
uniform distribution, a chi-square test for goodness of fit should be performed. (alpha = 0.10)
[Show More]