Mathematics > EXAM > Stat-1031 (Introduction to Statistics) Test 1 Review (All)
Stat-1031 (Introduction to Statistics) Test 1 Review
Document Content and Description Below
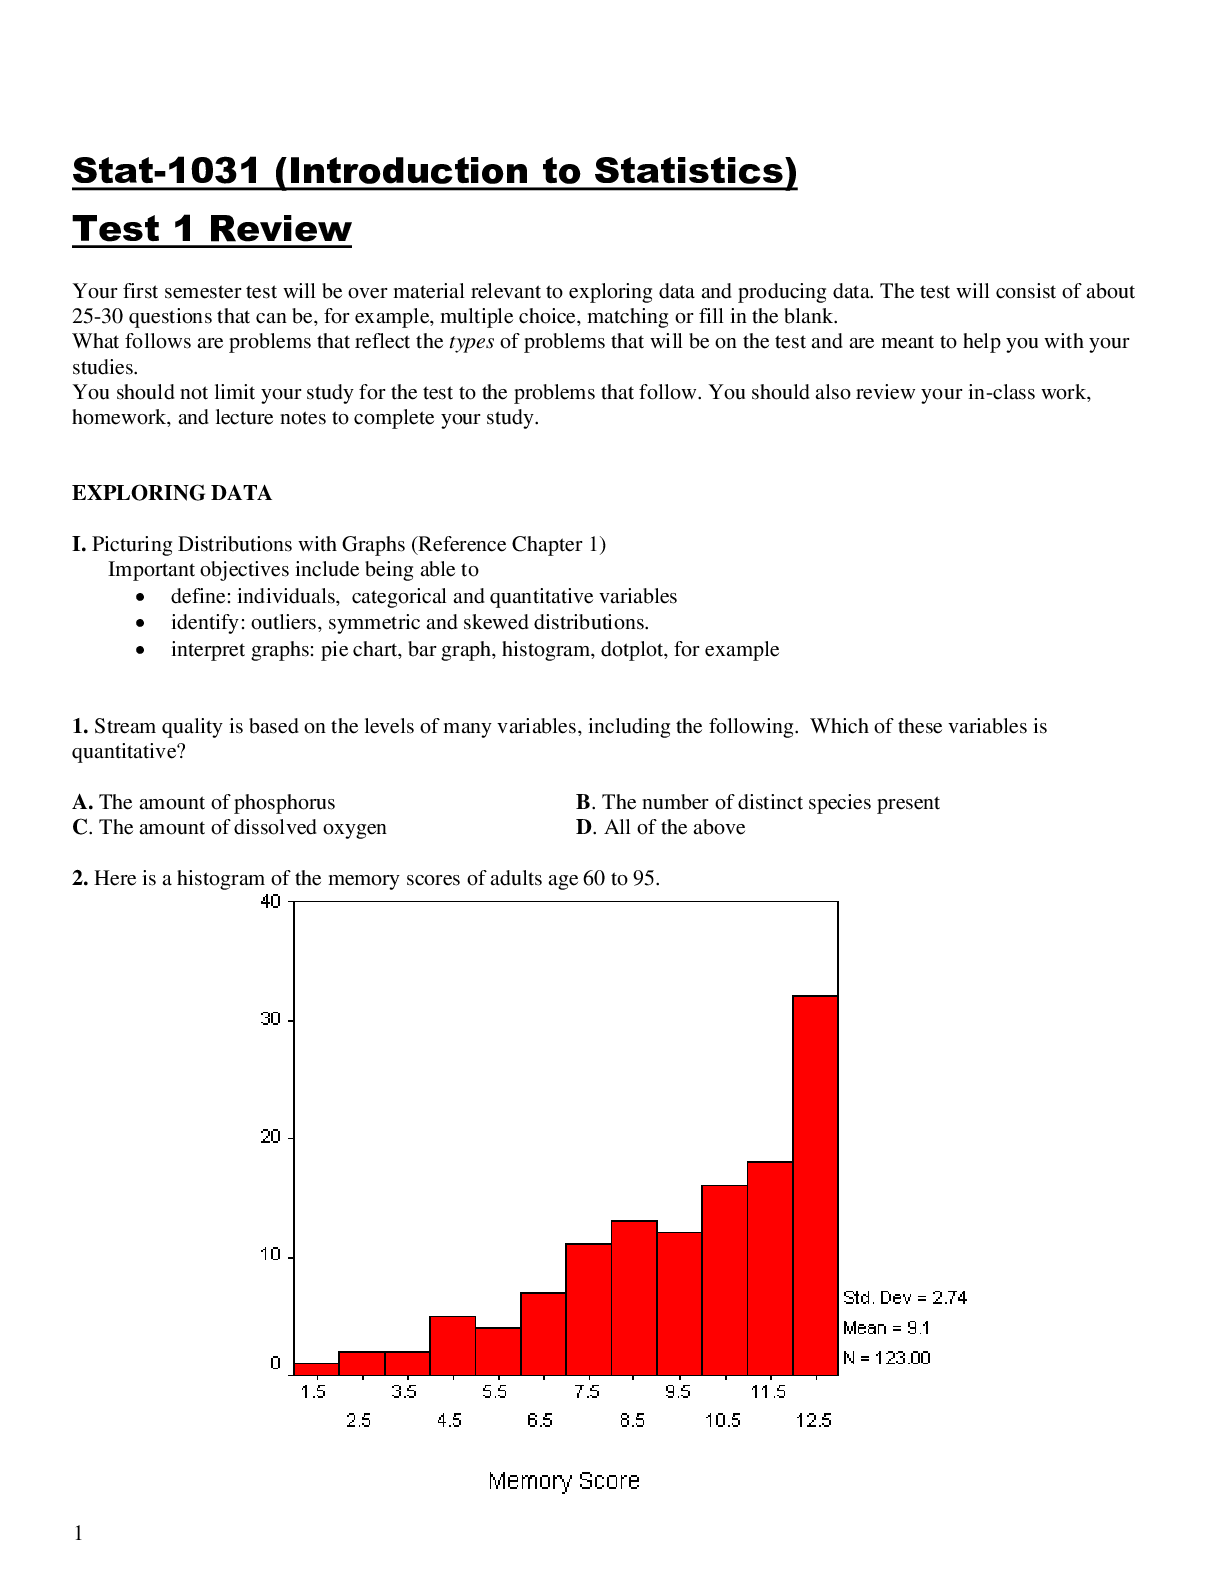
I. Picturing Distributions with Graphs (Reference Chapter 1) Important objectives include being able to • define: individuals, categorical and quantitative variables • identify: outliers, symmet... ric and skewed distributions. • interpret graphs: pie chart, bar graph, histogram, dotplot, for example 1. Stream quality is based on the levels of many variables, including the following. Which of these variables is quantitative? A. The amount of phosphorus B. The number of distinct species present C. The amount of dissolved oxygen D. All of the above 2. Here is a histogram of the memory scores of adults age 60 to 95. What is the best description of the overall shape of the distribution? A. Bimodal B. Skewed to the right C. Skewed to the left D. Roughly symmetric with a few outliers 3. Here is a dotplot that shows the number of passengers in a department store elevator at a random selection of times during the day. Which of the below is the best description of the distribution of the number of passengers in the elevator? A. symmetric with 3 outliers. B. left-skewed. C. right-skewed. D. multimodal. ...............................................................CONTINUED.................................. [Show More]
Last updated: 2 years ago
Preview 1 out of 14 pages
Buy this document to get the full access instantly
Instant Download Access after purchase
Buy NowInstant download
We Accept:

Reviews( 0 )
$10.00
Can't find what you want? Try our AI powered Search
Document information
Connected school, study & course
About the document
Uploaded On
Jul 29, 2021
Number of pages
14
Written in

Additional information
This document has been written for:
Uploaded
Jul 29, 2021
Downloads
0
Views
54