Bundle > Sophia_Learning_Introduction_to_Statistics & Foundation_of_Statistics_Final_Milestone _2022 - University of Nevada
Sophia_Learning_Introduction_to_Statistics & Foundation_of_Statistics_Final_Milestone _2022 - University of Nevada
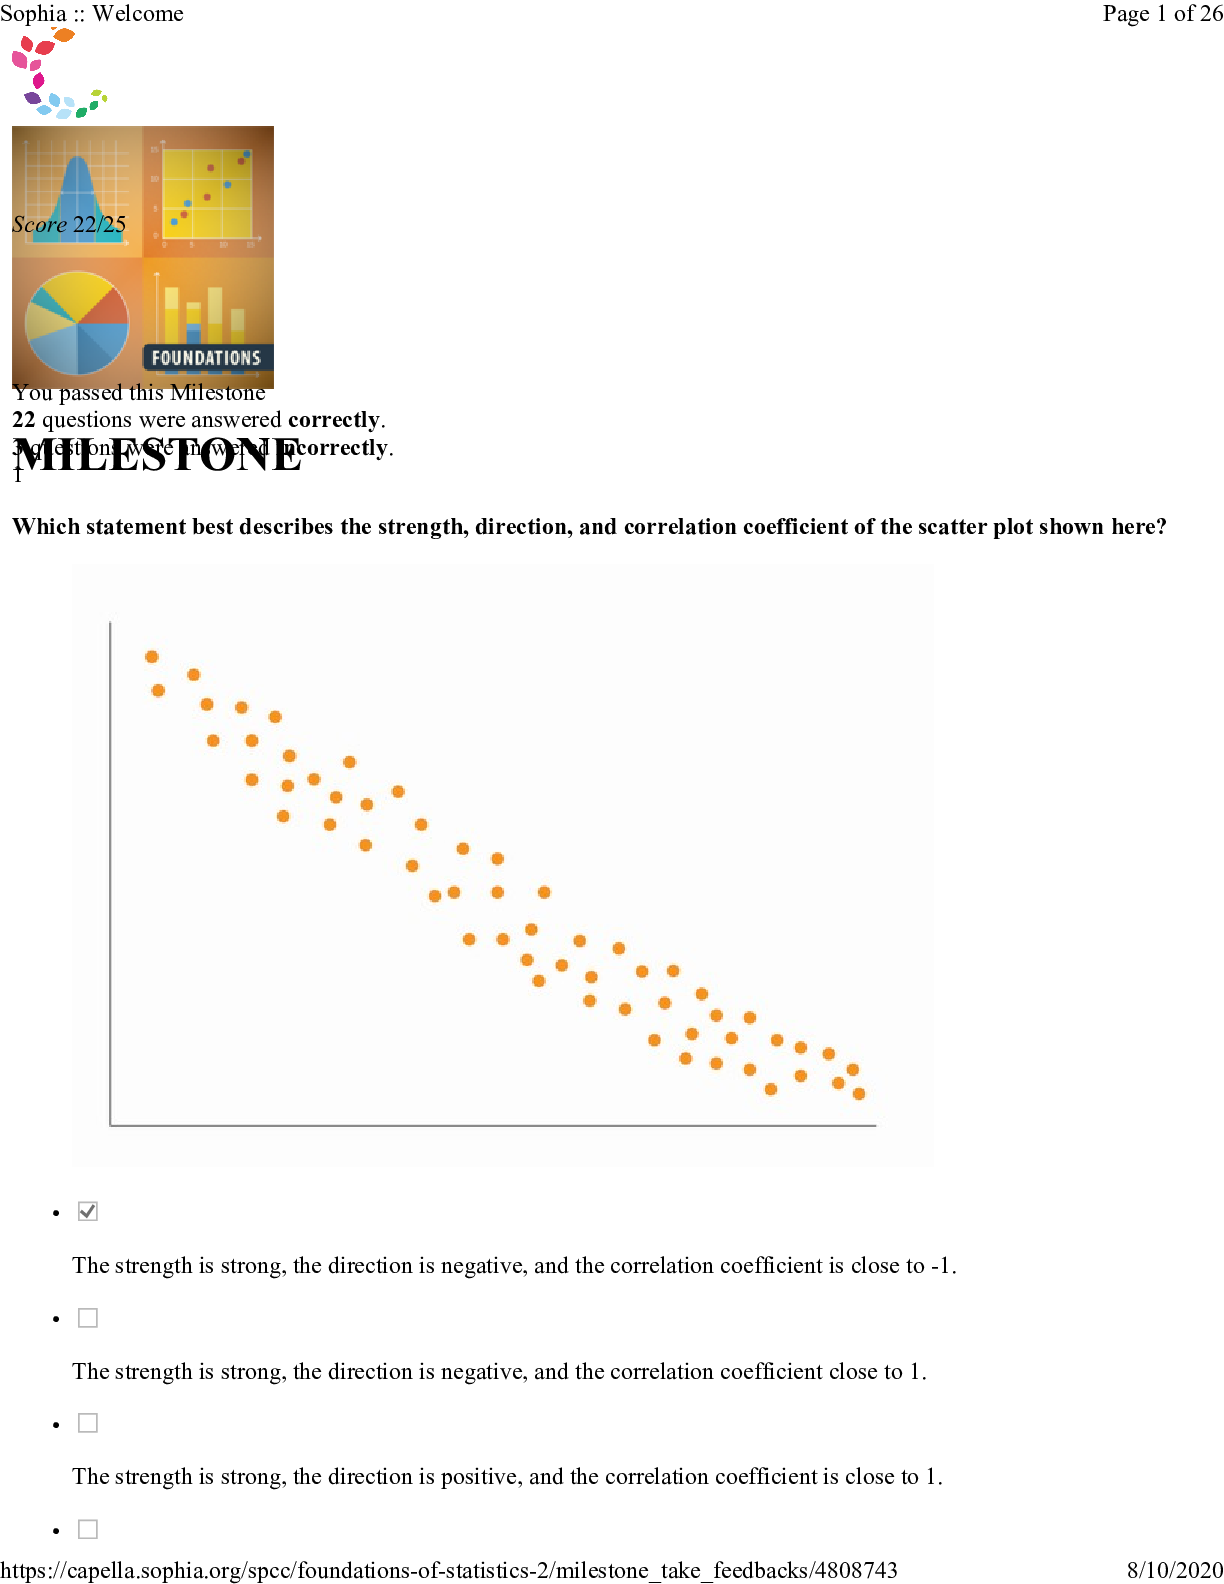
MILESTONE Score 22/25 You passed this Milestone 22 questions were answered correctly. 3 questions were answered incorrectly. 1 Which statement best describes the strength, direction, and correlation c... oefficient of the scatter plot shown here? • The strength is strong, the direction is negative, and the correlation coefficient is close to -1. • The strength is strong, the direction is negative, and the correlation coefficient close to 1. • The strength is strong, the direction is positive, and the correlation coefficient is close to 1. • Sophia :: Welcome Page 1 of 26 RATIONALE The closer the data looks to a straight line, the stronger the relationship is. A negative relationship is identified when, as one variable decreases, the second variable increases. Also, if the data is pretty linear and shows a decreasing trend, the correlation is close to -1. CONCEPT Using Data to Identify a Relationship Between Variables 2 Gwen was having issues with her laundry detergent. Her whites were not as bright as she wanted them to be, so she decided to change brands. Before she washed her next set of clothes, she made a hypothesis as to the outcome of using a new detergent. Which of the following would be the null hypothesis? • The new detergent will make the clothes whiter than the old detergent. • The difference between the new detergent and the old detergent will be significant. • The new detergent could be better or worse compared to the old detergent. • There will be no difference between the new detergent and the old detergent. RATIONALE Gwen is not sure that the new detergent will make them brighter or less bright so we always set the null hypothesis to say that there is no difference between the two. CONCEPT Identifying a Reason for Performing an Experiment 3 Deon was searching through a list of movies on his streaming movie service and wanted to only look at movies that were rated 4 out of 5 stars or higher. There are a total of 150 movies listed. If 20 of those movies have ratings of 4 stars and 10 have ratings of 5 stars, what is the probability that Deon will randomly select a movie with at least a 4-star rating? • Sophia :: Welcome Page 2 of 26 • • RATIONALE For Deon to select a movie with at least 4 stars it means he has to select a movie with either 4 stars OR 5 stars. have a rating of 4 stars and have a rating of 5 stars. Remember that an "OR" probability means we add them: CONCEPT An Introduction to Probability 4 Marco was a genetic anthropologist interested in determining the heights of third grade children in his community to compare to the national average height. To get his data, Marco traveled to several locations across his city and, at each location, gathered 70 different samples of people's heights. Next Marco found the mean height of each of those samples and plotted the sample means. Which graph shows the correct distribution of sample means if the population mean was a height of 100 centimeters? • Sophia :: Welcome Page 3 of 26 • Sophia :: Welcome Page 4 of 26 RATIONALE When you take many samples and plot their means, the mean values of all those sample means will end up being equal to the population mean. Since normal distribution shows the mean at the center of the distribution on the horizontal axis, the population mean must be at the center of the distribution. Since 100 centimeters is the population mean, this graph is the best answer choice. Sophia :: Welcome Page 5 of 26 Working with Data from Multiple Samples 5 Gaurav was conducting a test to determine if the average amount of medication his patients were taking was similar to the national average. He wants to use a 5% significance level for his test to help ensure that his patients do not receive too little or too much medication. If Gaurav were to conduct a test, what probability value would indicate that his null hypothesis (that there is no significant difference between the amount of medication Gaurav's patients are receiving and the national average) would be rejected? • 50.45% • 95.78% • 5.23% • 1.45% RATIONALE If we are considering a 5% significance level, then this means that we are accounting for 95% of the data. If we picture this on a normal distribution curve, we would say that 2.5% of the data in the left tail is not accounted for and 2.5% of the data in the right tail is not accounted for. Therefore, probability values that are below 2.5% or above 97.5% indicate that the null hypothesis should be rejected. This is because if the null hypothesis were true for a 5% significance level, then it is very unlikely that we would get probabilities below 2.5% or above 97.5% by accident. CONCEPT Introduction to Significance Levels 6 The following data set [Show More]
Last updated: 3 years ago
Bundle contains 2 items

This Bundle Contains 2 Items
Statistics> QUESTIONS & ANSWERS > Sophia_Learning_Foundation_of_Statistics_Final_Milestone_2022 - University of Nevada | Foundation_of_Statistics_Final_Milestone (All)
Sophia_Learning_Foundation_of_Statistics_Final_Milestone_2022 - University of Nevada | Foundation_of_Statistics_Final_Milestone
MILESTONE Score 22/25 You passed this Milestone 22 questions were answered correctly. 3 questions were answered incorrectly. 1 Which statement best describes the strength, direction, and correla...
By Nutmegs
QUESTIONS & ANSWERS
$13
0
Statistics> QUESTIONS & ANSWERS > Sophia_Learning_Introduction_to_Statistics_Final_Milestone_2022 - University of Nevada | Introduction_to_Statistics_Final_Milestone (All)
Sophia_Learning_Introduction_to_Statistics_Final_Milestone_2022 - University of Nevada | Introduction_to_Statistics_Final_Milestone
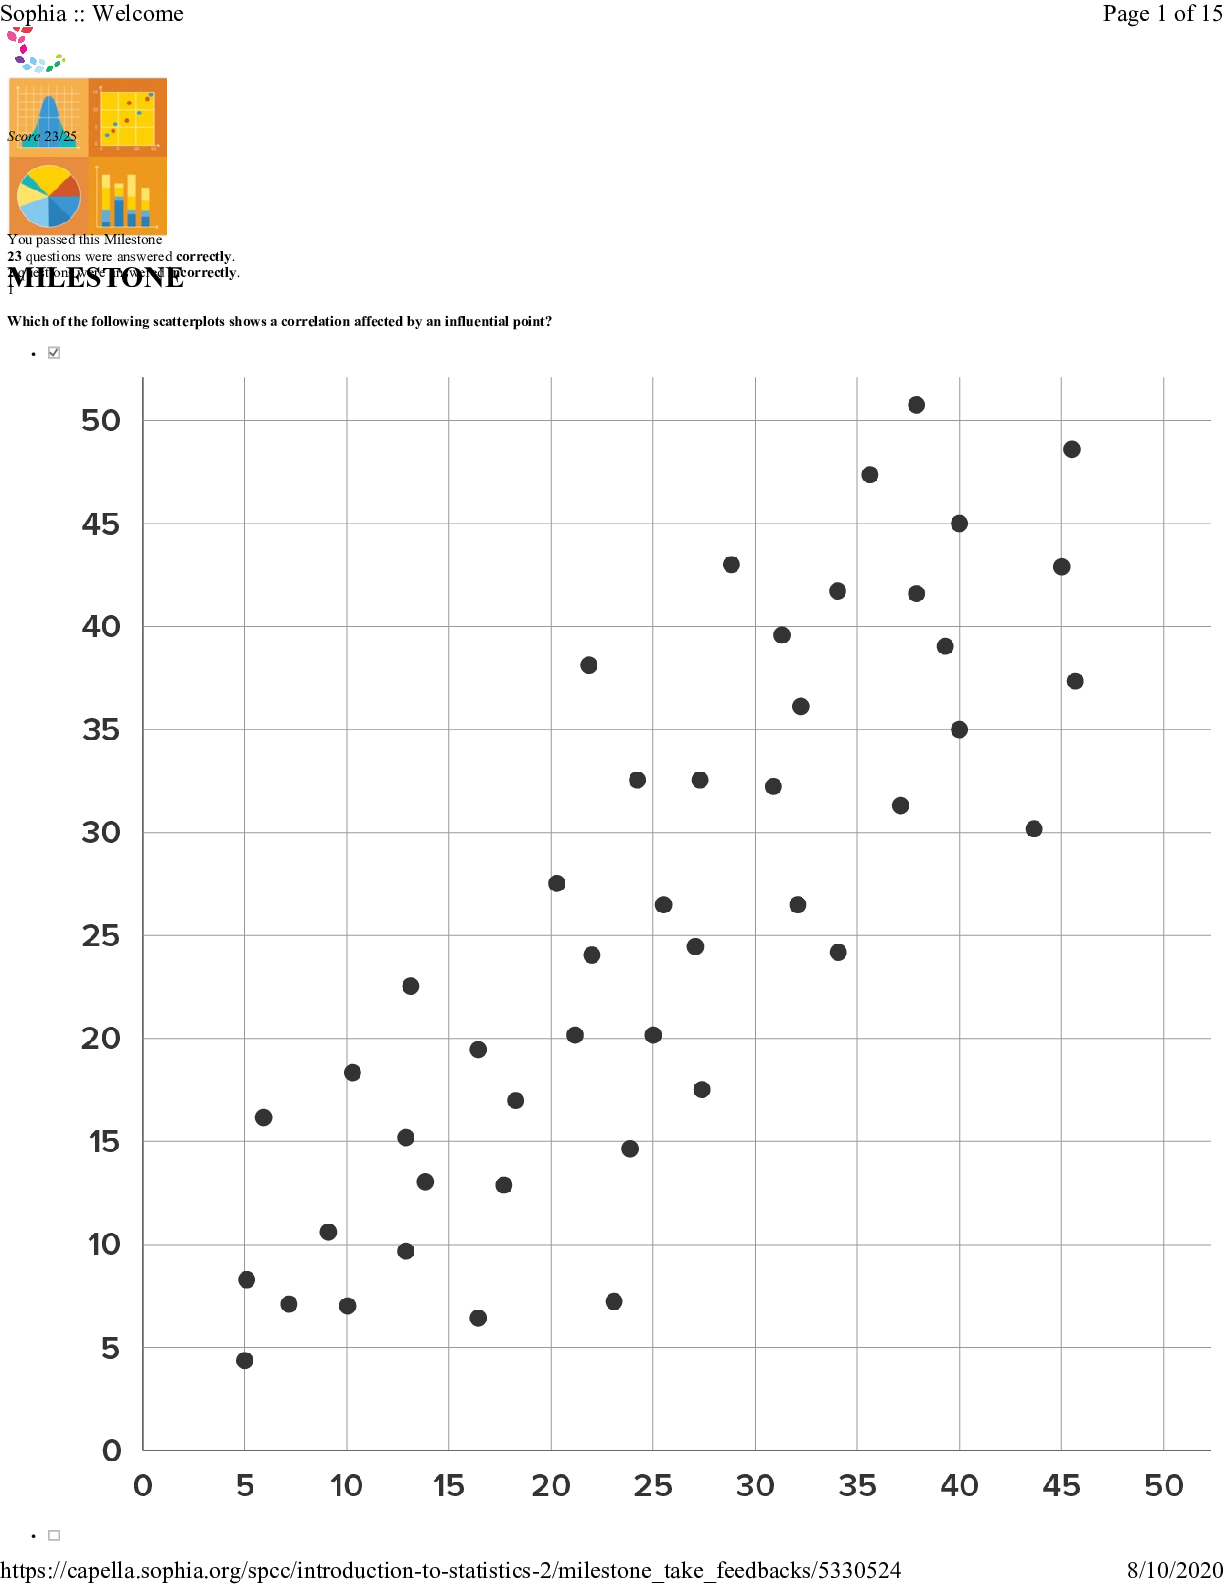
MILESTONE Score 23/25 You passed this Milestone 23 questions were answered correctly. 2 questions were answered incorrectly. 1 Which of the following scatterplots shows a correlation affected by...
By Nutmegs
QUESTIONS & ANSWERS
$13
0
Reviews( 0 )
More information
Uploaded On
Apr 11, 2022
Language
English
Type
Bundle
Number of Documents:
2


