Statistics > QUESTIONS & ANSWERS > Sophia_Learning_Introduction_to_Statistics_Final_Milestone_2022 - University of Nevada | Introductio (All)
Sophia_Learning_Introduction_to_Statistics_Final_Milestone_2022 - University of Nevada | Introduction_to_Statistics_Final_Milestone
Document Content and Description Below
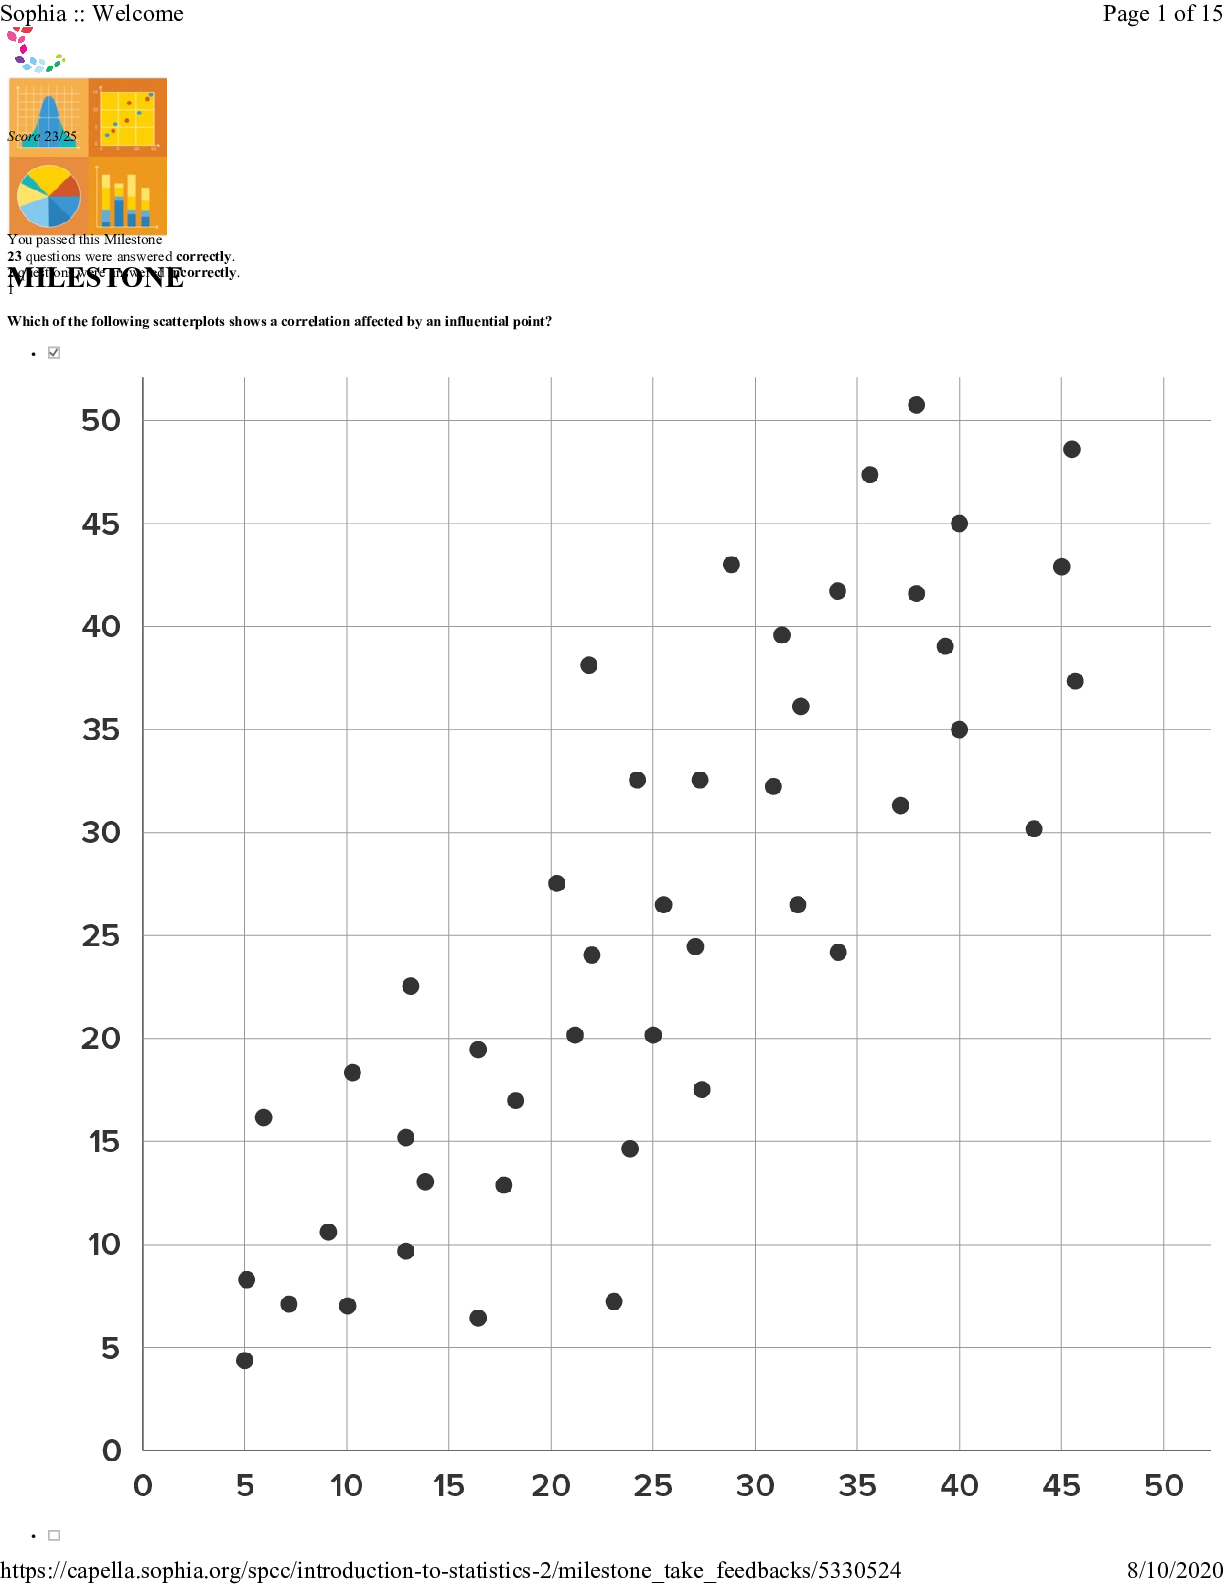
MILESTONE Score 23/25 You passed this Milestone 23 questions were answered correctly. 2 questions were answered incorrectly. 1 Which of the following scatterplots shows a correlation affected by ... an influential point? • • Sophia :: Welcome Page 1 of 15https://capella.sophia.org/spcc/introduction-to-statistics-2/milestone_take_feedbacks/5330524 8/10/2020 • Sophia :: Welcome Page 2 of 15https://capella.sophia.org/spcc/introduction-to-statistics-2/milestone_take_feedbacks/5330524 8/10/2020 • Sophia :: Welcome Page 3 of 15https://capella.sophia.org/spcc/introduction-to-statistics-2/milestone_take_feedbacks/5330524 8/10/2020 RATIONALE An influential point will influence correlation that doesn't lie in the range of the other data. This graphs shows an outlier that is above the other data and lower in the x-direction. CONCEPT Cautions about Correlation 2 The owner of a pizza parlor called every fifth person who ordered pizza last week to rate the pizza. What type of statistical study is this? • An observational study • A survey • A census Sophia :: Welcome Page 4 of 15https://capella.sophia.org/spcc/introduction-to-statistics-2/milestone_take_feedbacks/5330524 8/10/2020 • An experiment RATIONALE Since the owner asked patrons about the pizza and gathered information from them, this is an example of a survey. CONCEPT Surveys 3 Shawna reads a scatterplot that displays the relationship between the number of cars owned per household and the average number of citizens who have health insurance in neighborhoods across the country. The plot shows a strong positive correlation. Shawna recalls that correlation does not imply causation. In this example, Shawna sees that increasing the number of cars per household would not cause members of her community to purchase health insurance. Identify the lurking variable that is causing an increase in both the number of cars owned and the average number of citizens with health insurance. • Average income per household • The number of cars on the road • Average mileage per vehicle • The number of citizens in the United States RATIONALE Recall that a lurking variable is something that must be related to the outcome and explanatory variable that when considered can help explain a relationship between 2 variables. Since higher income is positively related to owning more cars and having health insurance, this variable would help explain w [Show More]
Last updated: 3 years ago
Preview 1 out of 15 pages
Buy this document to get the full access instantly
Instant Download Access after purchase
Buy NowInstant download
We Accept:

Also available in bundle (1)
Click Below to Access Bundle(s)
Sophia_Learning_Introduction_to_Statistics & Foundation_of_Statistics_Final_Milestone _2022 - University of Nevada
MILESTONE Score 22/25 You passed this Milestone 22 questions were answered correctly. 3 questions were answered incorrectly. 1 Which statement best describes the strength, direction, and correlation c...
By Nutmegs 3 years ago
$18
2
Reviews( 0 )
$13.00
Can't find what you want? Try our AI powered Search
Document information
Connected school, study & course
About the document
Uploaded On
Apr 10, 2022
Number of pages
15
Written in
All

Additional information
This document has been written for:
Uploaded
Apr 10, 2022
Downloads
0
Views
186


.png)