tats with Python
Statistics with Python | 1 | Descriptive Statistics
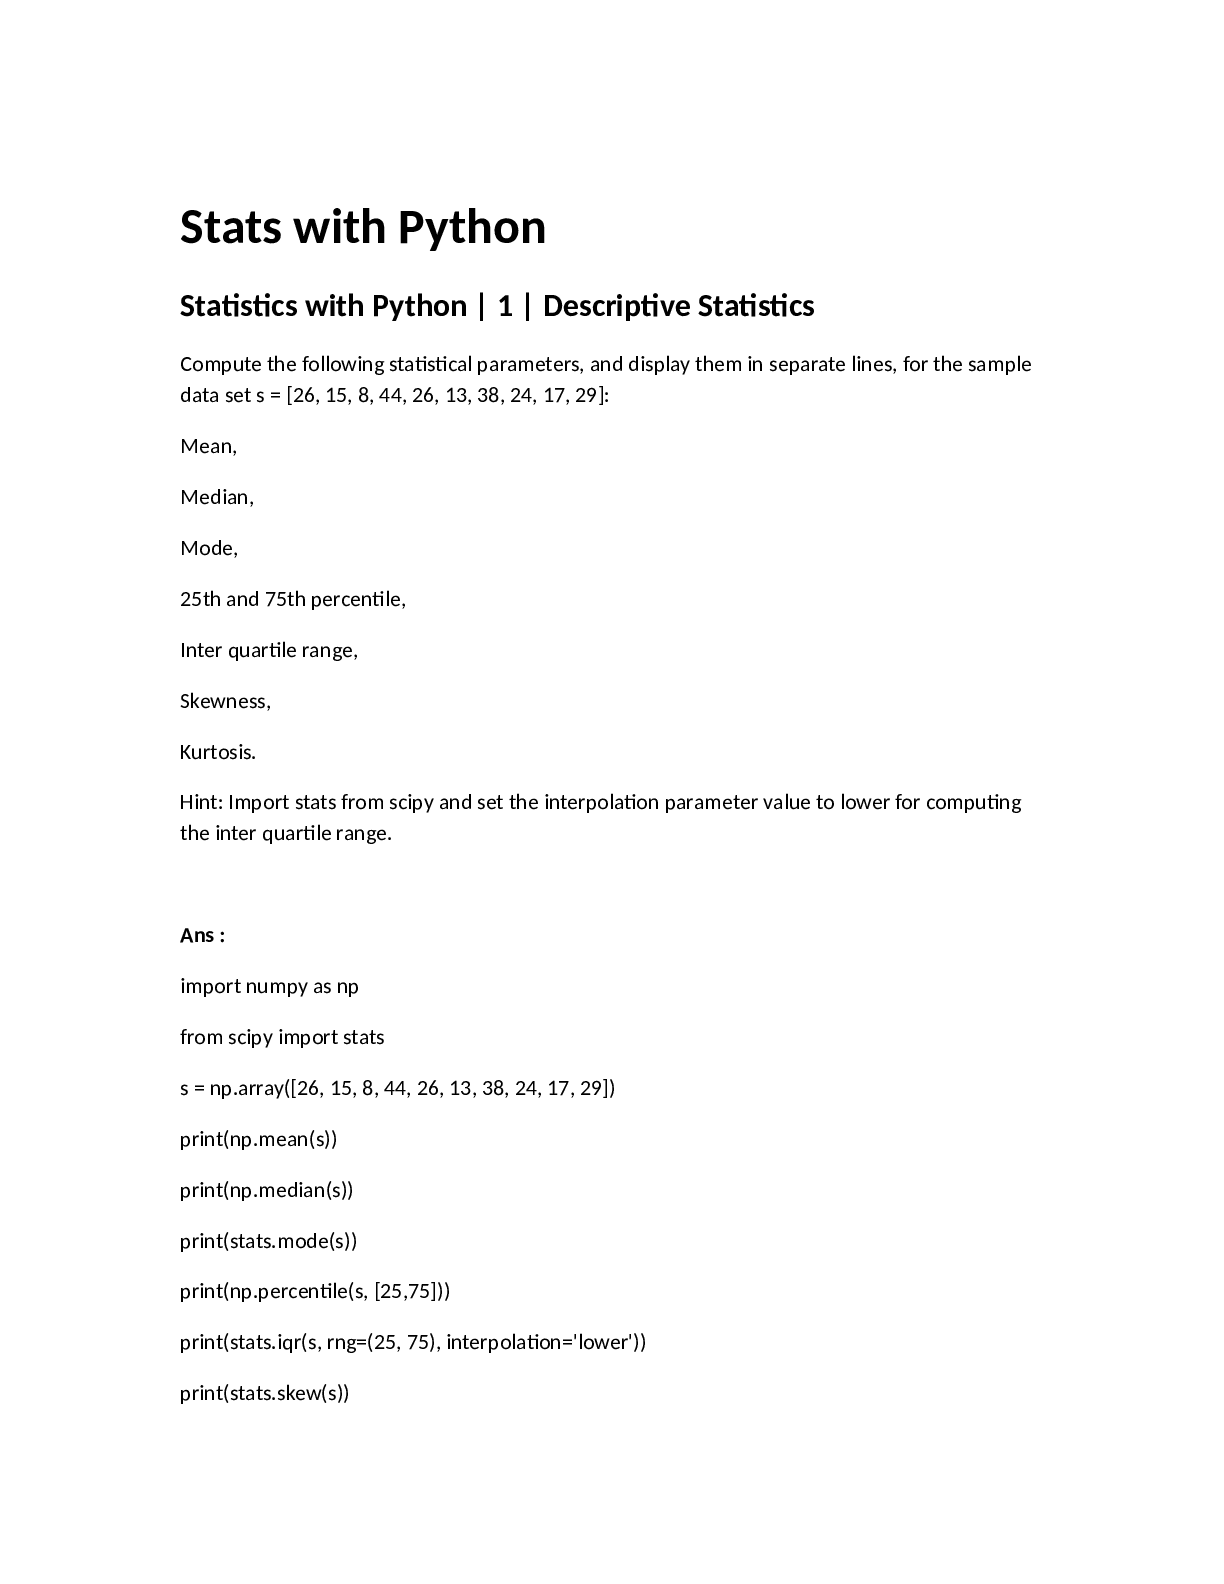
Compute the following statistical parameters, and display them in separate lines, for the sample
data set s = [26, 15, 8, 44, 26, 13, 38, 24, 17, 29
...
tats with Python
Statistics with Python | 1 | Descriptive Statistics
Compute the following statistical parameters, and display them in separate lines, for the sample
data set s = [26, 15, 8, 44, 26, 13, 38, 24, 17, 29]:
Mean,
Median,
Mode,
25th and 75th percentile,
Inter quartile range,
Skewness,
Kurtosis.
Hint: Import stats from scipy and set the interpolation parameter value to lower for computing
the inter quartile range.
Ans :
import numpy as np
from scipy import stats
s = np.array([26, 15, 8, 44, 26, 13, 38, 24, 17, 29])
print(np.mean(s))
print(np.median(s))
print(stats.mode(s))
print(np.percentile(s, [25,75]))
print(stats.iqr(s, rng=(25, 75), interpolation='lower'))
print(stats.skew(s))
print(stats.kurtosis(s))
Statistics with Python | 2 | Random Distributions
Problem Statement
Create a normal distribution with mean 32 and standard deviation 4.5.
Set the random seed to 1, and create a random sample of 100 elements from the above defined
distribution.
Compute the absolute difference between the sample mean and the distribution mean.
Hint: Use the functions available in numpy and scipy.
Ans :
from scipy.stats import norm
import numpy as np
np.random.seed(1)
distribution_mean = 32
sample = norm.rvs(loc=distribution_mean, scale=4.5, size=100)
sample_mean = np.mean(sample)
print('sample:', sample)
print('sample mean:', sample_mean)
abs_diff = abs(sample_mean - distribution_mean)
print('absolute difference:', abs_diff)
Statistics with Python | 3 | Random Experiment
Problem Statement
Simulate a random experiment of tossing a coin 10000 times, and determine the count of Heads
returned.
Hint: Define a binomial distribution with n = 1 and p = 0.5.
Use binom function from scipy.stats.
Set the random seed to 1.
Draw a sample of 10000 elements from a defined distribution. Assume that the values '0' and '1'
represent Heads and Tails respectively.
Count the number of 'Heads' and display it. Make used of the 'bincount' method available in
'numpy'.
Ans :
import numpy as np
from scipy.stats import binom
np.random.seed(1)
data_binom = binom.rvs(n=1,p=0.5,size=10000)
y = np.bincount(data_binom)
head = print(y[0])
print(head)
Statistics with Python | 4 | Hypothesis Testing 1
Problem Statement
Consider the following independent samples s1 and s2:
s1 = [45, 38, 52, 48, 25, 39, 51, 46, 55, 46]
s2 = [34, 22, 15, 27, 37, 41, 24, 19, 26, 36]
The samples represent the life satisfaction score (computed through a methodology) of older
adults and younger adults respectively.
Compute t-statistic for the above two groups, and display the t-score and p value in separate
lines.
Hint: Use the ttest_ind function available in scipy.
Ans:
from scipy import stats
import numpy as np
s1 = [45, 38, 52, 48, 25, 39, 51, 46, 55, 46]
s2 = [34, 22, 15, 27, 37, 41, 24, 19, 26, 36]
t, p = stats.ttest_ind(s1, s2)
print(t)
print(p)
Statistics with Python | 5 | Hypothesis Testing 2
Problem Statement
A researcher noted the number of chocolate chips consumed by 10 rats, with and without
electrical stimulation.
The data set s1 represents consumption with stimulation, and s2 without simulation.
s1 = [12, 7, 3, 11, 8, 5, 14, 7, 9, 10]
s2 = [8, 7, 4, 14, 6, 7, 12, 5, 5, 8]
Compute t-statistic for the above samples, and display the t-score and p-value in separate lines.
Hint: Use the ttest_rel function available in scipy.
Ans :
from scipy import stats
import numpy as np
s1 = [12, 7, 3, 11, 8, 5, 14, 7, 9, 10]
s2 = [8, 7, 4, 14, 6, 7, 12, 5, 5, 8]
t, p = stats.ttest_ind(s1, s2)
print(t)
print(p)
Statistics with Python | 6 | Linear Regression 1
Problem Statement
Perform the following tasks:
Load the R dataset mtcars.
Capture the data as a pandas dataframe.
Build a linear regression model with independent variable wt, and dependent variable mpg.
Fit the model with data, and display the R-squared value.
Ans:
import statsmodels.api as sm
import statsmodels.formula.api as smf
mtcars_df = sm.datasets.get_rdataset("mtcars")
mtcars_df = mtcars_df.data
linear_model = smf.ols('wt ~ mpg', mtcars_df)
linear_result = linear_model.fit()
print(linear_result.rsquared)
Statistics with Python | 7 | Linear Regression 2
Problem Statement
Load the R data set mtcars as a pandas dataframe.
Build another linear regression model by considering the log of independent variable wt, and log
of dependent variable mpg.
Fit the model with data, and display the R-squared value.
Ans:
import statsmodels.api as sm
import statsmodels.formula.api as smf
import numpy as np
mtcars_df = sm.datasets.get_rdataset("mtcars")
mtcars_df = mtcars_df.data
linear_model = smf.ols('np.log(wt) ~ np.log(mpg)', mtcars_df)
linear_result = linear_model.fit()
print(linear_result.rsquared)
Statistics with Python | 8 | Logistic R
[Show More]


.png)


.png)
.png)
