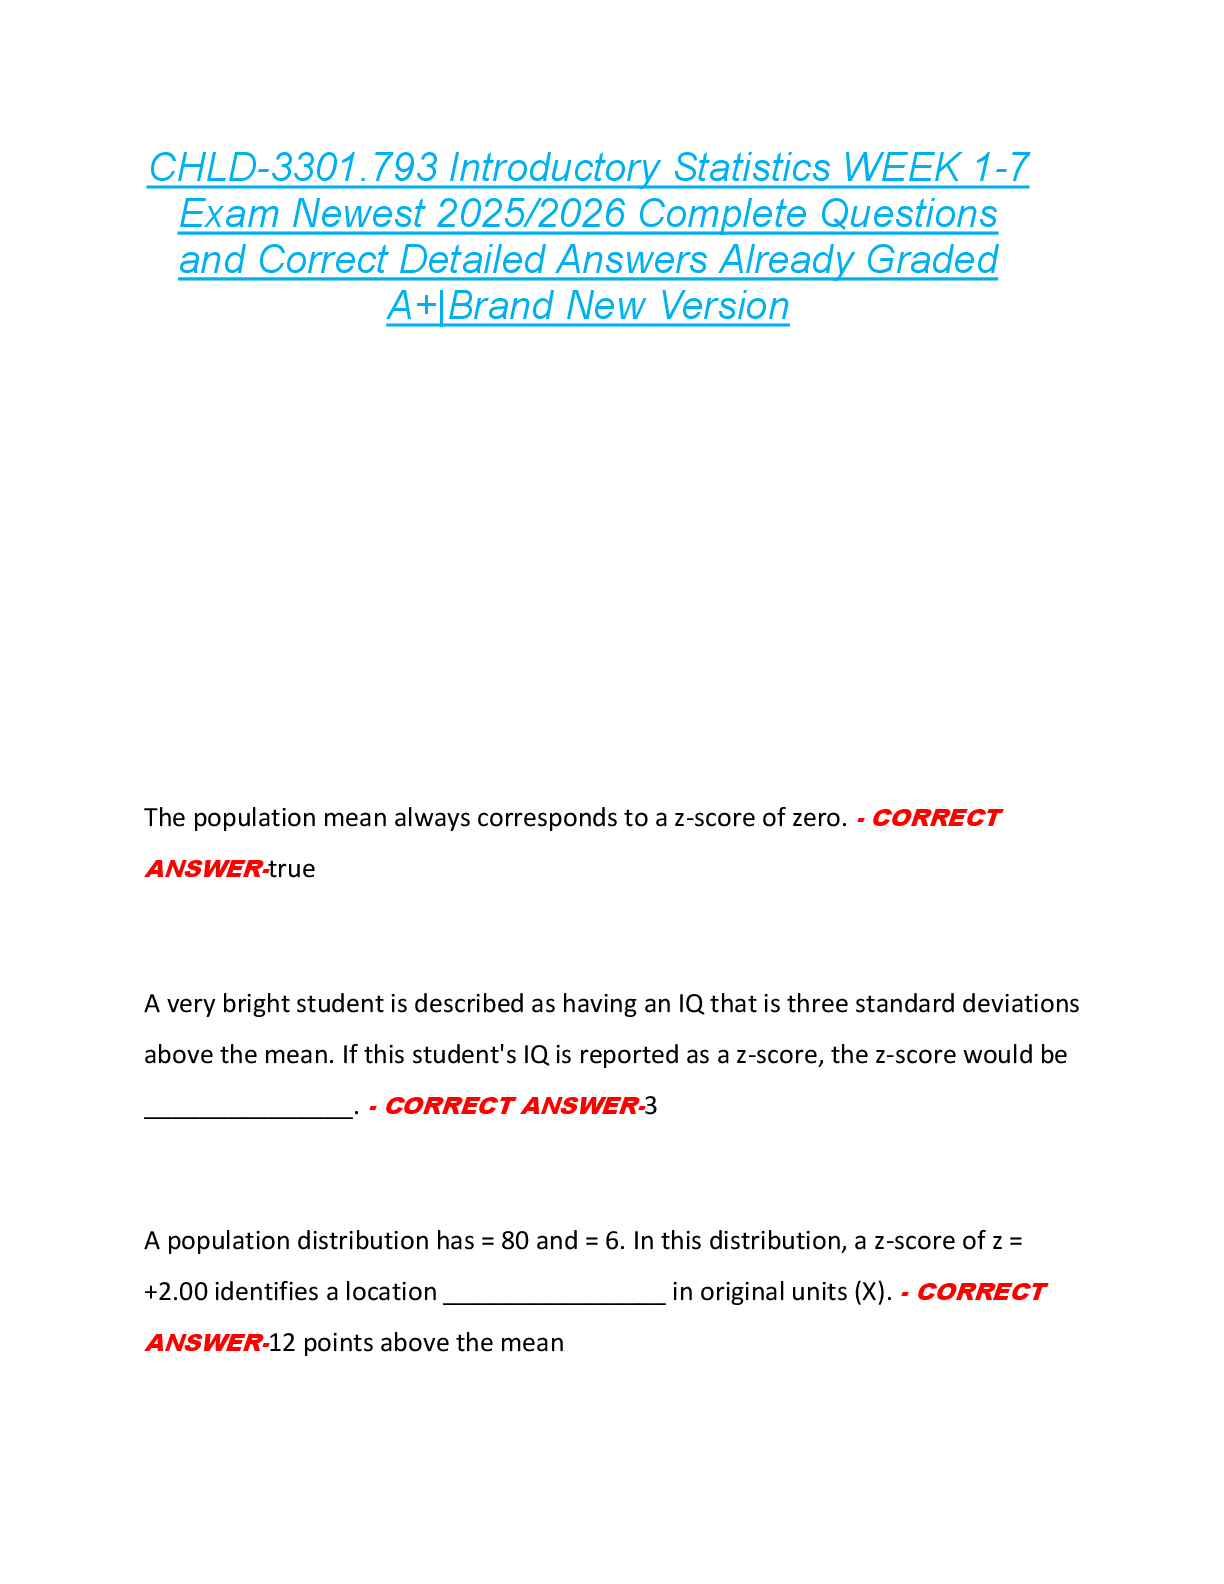
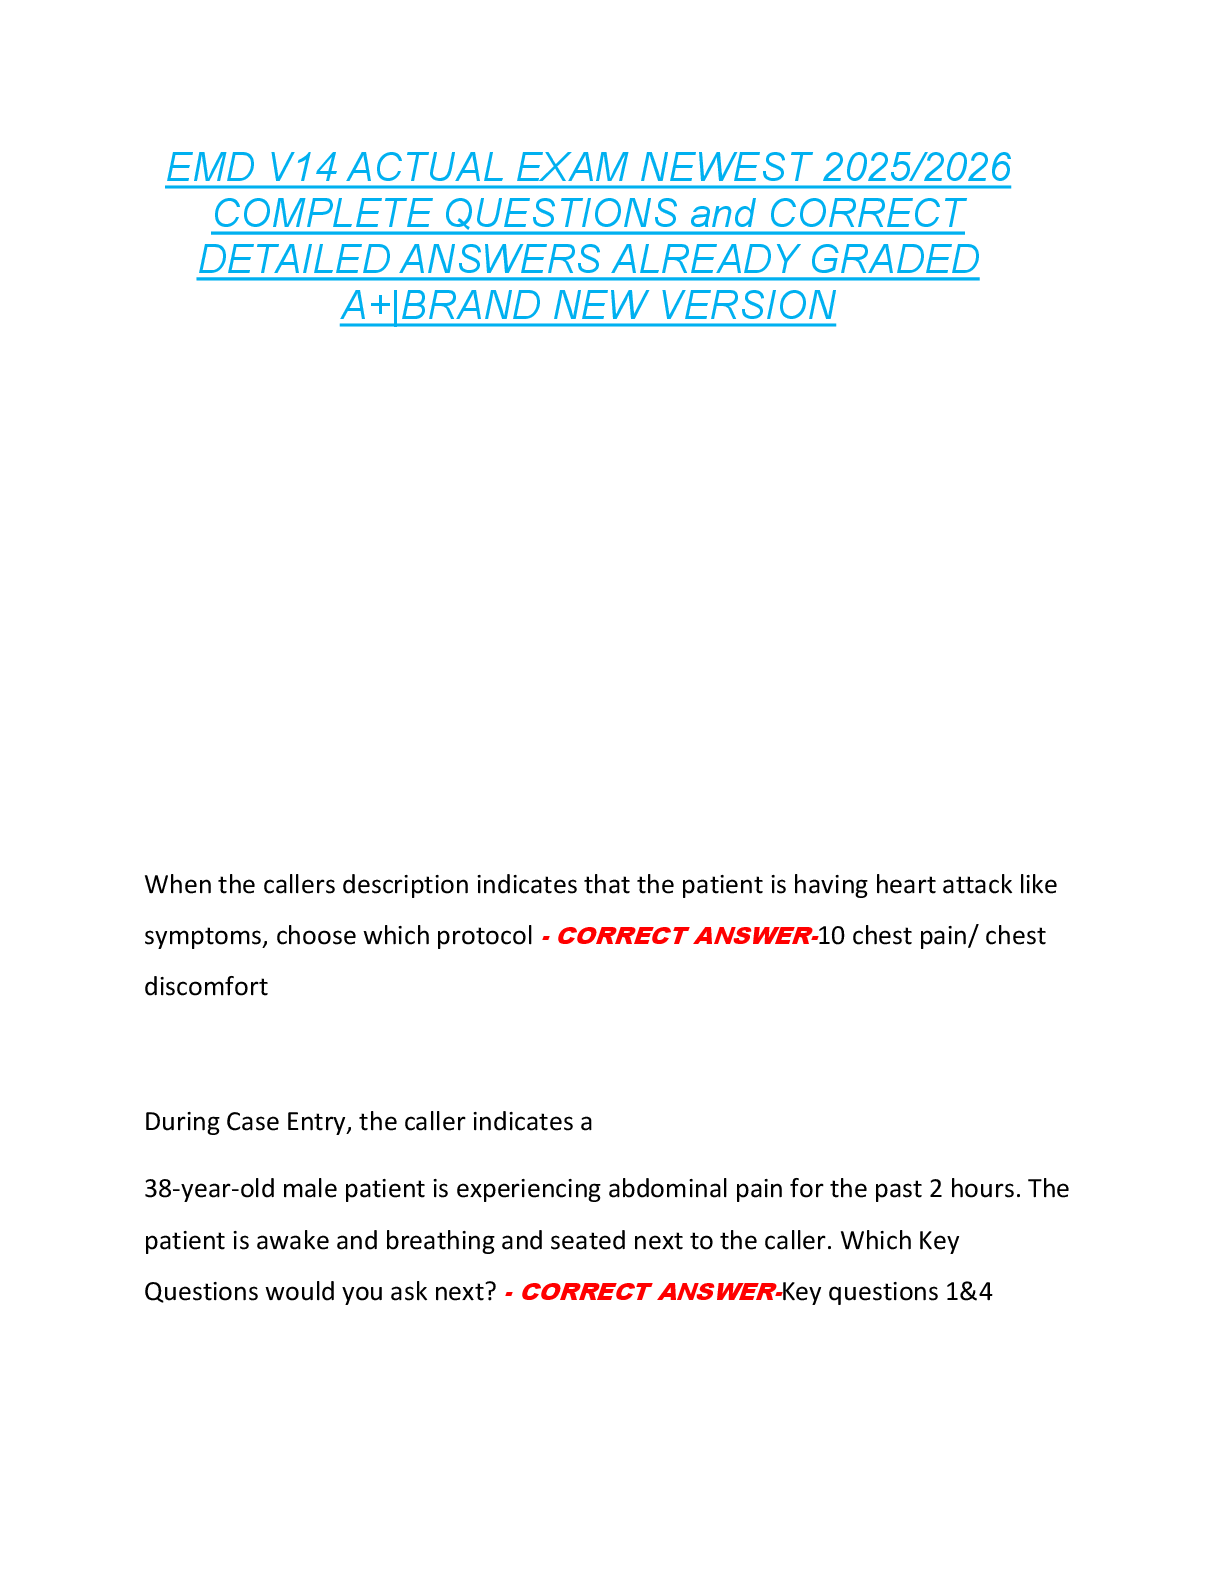
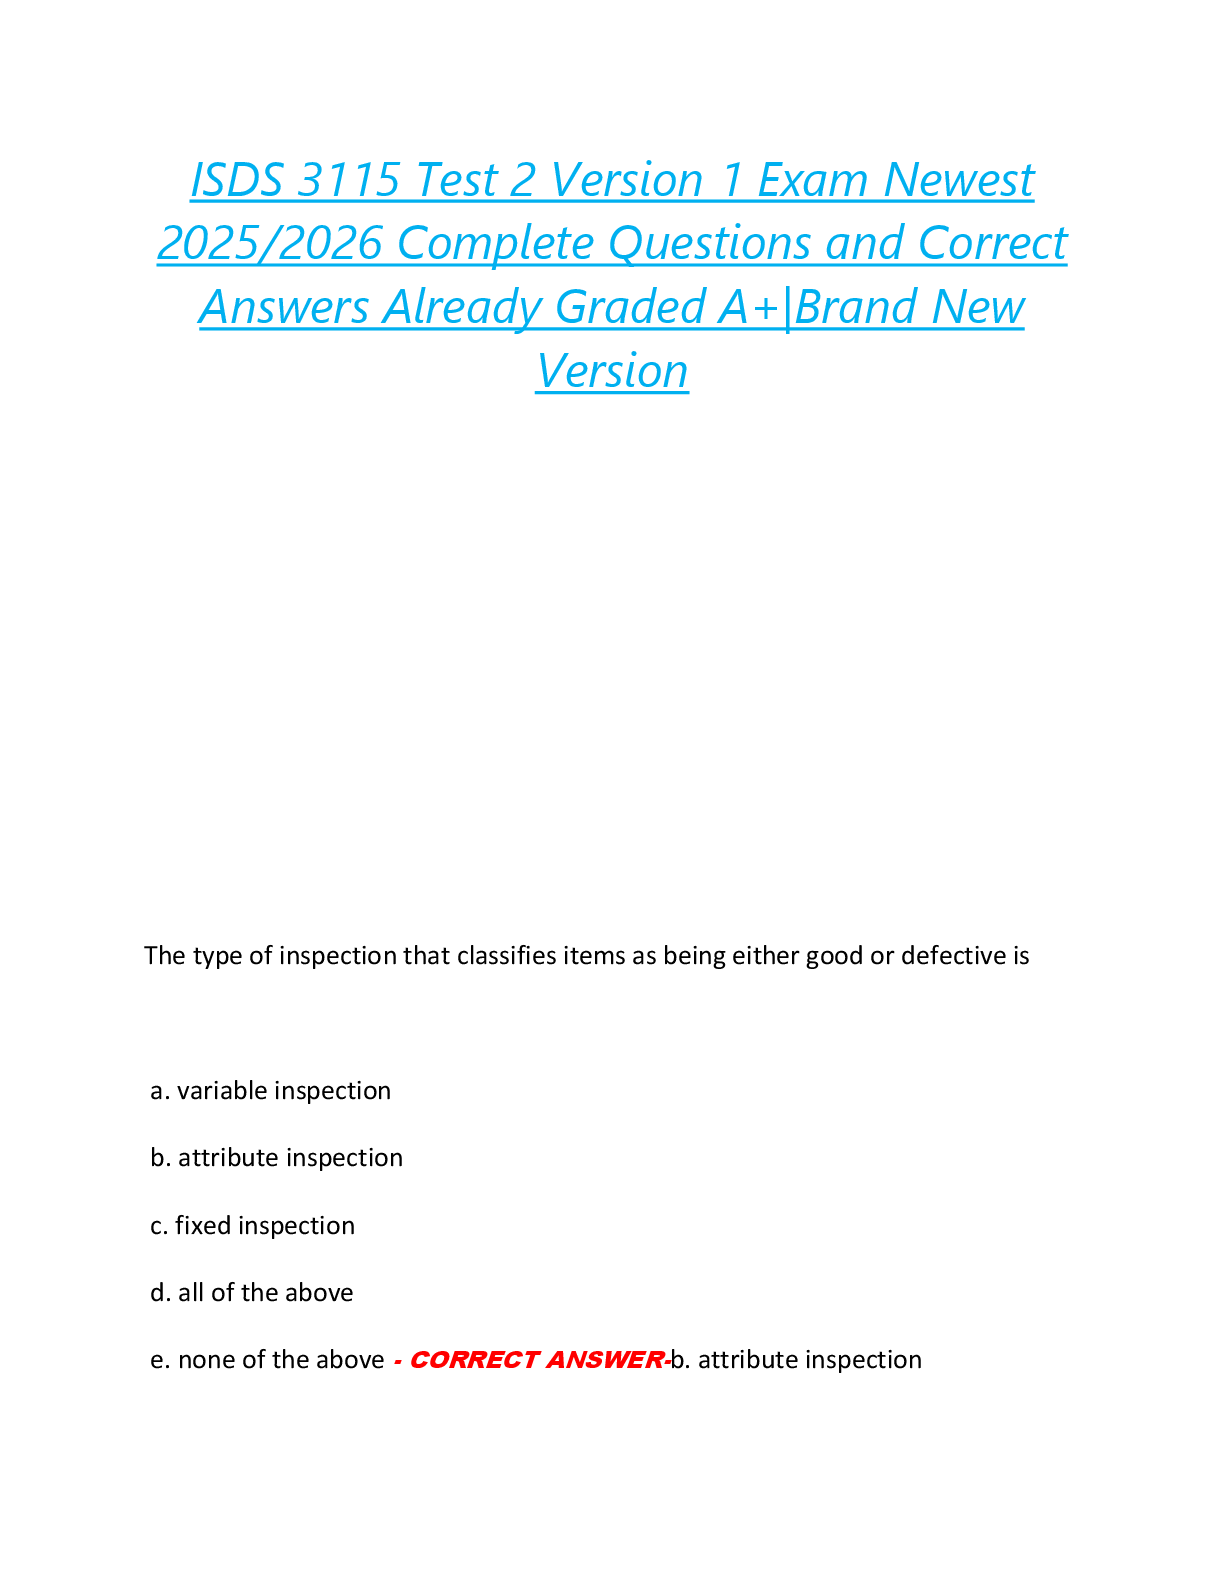
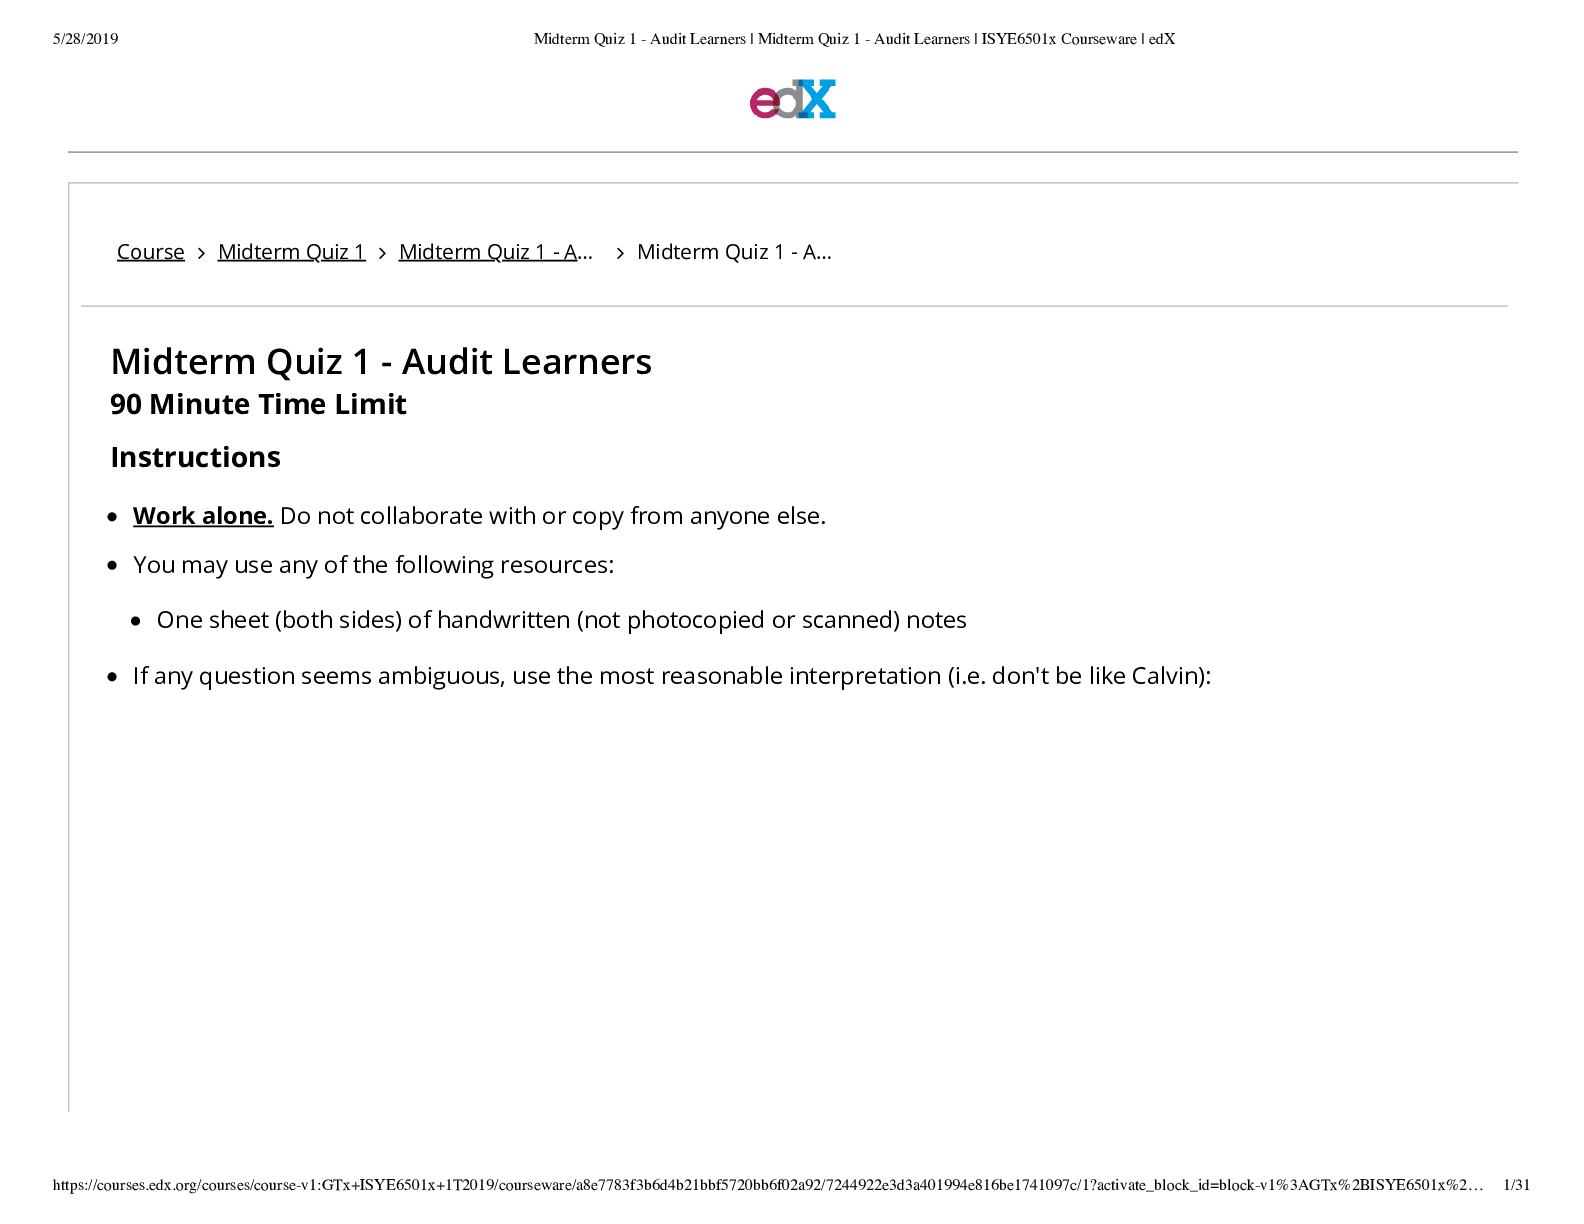
Computer Science > EXAM > ISYE 6501Midterm Quiz 2 - GT Students and Verified MM Learners _ Midterm Quiz 2 _ ISYE6501x Coursewa (All)
ISYE 6501Midterm Quiz 2 - GT Students and Verified MM Learners _ Midterm Quiz 2 _ ISYE6501x Courseware
Document Content and Description Below
Question 1 0.0/1.4 points (graded) Number of people clicking an online banner ad each hour Exponential You have used 1 of 1 attempt Question 1 0.0/1.4 points (graded) Time between people cl ... icking an online banner ad Weibull You have used 1 of 1 attempt Question 1 0.0/1.4 points (graded) Time from when a house is put on the market until the Õrst oàer is received Poisson You have used 1 of 1 attempt Question 1 0.0/1.4 points (graded) Time from the start of a World Cup soccer match until a goal is scored Poisson You have used 1 of 1 attempt Question 1 0.0/1.4 points (graded) Number of hits to a real estate web site each minute Binomial You have used 1 of 1 attempt Questions 2a, 2b 5.0/10.0 points (graded) Five classiÕcation models were built for predicting whether a neighborhood will soon see a large rise in home prices, based on public elementary school ratings and other factors. The training data set was missing the school rating variable for every new school (3% of the data points). Because ratings are unavailable for newly-opened schools, it is believed that locations that have recently experienced high population growth are more likely to have missing school rating data. Model 1 used imputation, Õlling in the missing data with the average school rating from the rest of the data. Model 2 used imputation, building a regression model to Õll in the missing school rating data based on other variables. Model 3 used imputation, Õrst building a classiÕcation model to estimate (based on other variables) whether a new school is likely to have been built as a result of recent population growth (or whether it has been built for another purpose, e.g. to replace a very old school), and then using that classiÕcation to select one of two regression models to Õll in an estimate of the school rating; there are two diàerent regression models (based on other variables), one for neighborhoods with new schools built due to population growth, and one for neighborhoods with new schools built for other reasons. Model 4 used a binary variable to identify locations with missing information. Model 5 used a categorical variable: Õrst, a classiÕcation model was used to estimate whether a new school is likely to have been built as a result of recent population growth; and then each neighborhood was categorized as "data available", "missing, population growth", or "missing, other reason". [Show More]
Last updated: 3 years ago
Preview 1 out of 26 pages

Buy this document to get the full access instantly
Instant Download Access after purchase
Buy NowInstant download
We Accept:

Reviews( 0 )
$18.00
Can't find what you want? Try our AI powered Search
Document information
Connected school, study & course
About the document
Uploaded On
Sep 07, 2021
Number of pages
26
Written in
All
Additional information
This document has been written for:
Uploaded
Sep 07, 2021
Downloads
0
Views
223




.png)


.png)
.png)


