Statistics > STUDY GUIDE > STAT 200 Week 3 Homework Problems. (All)
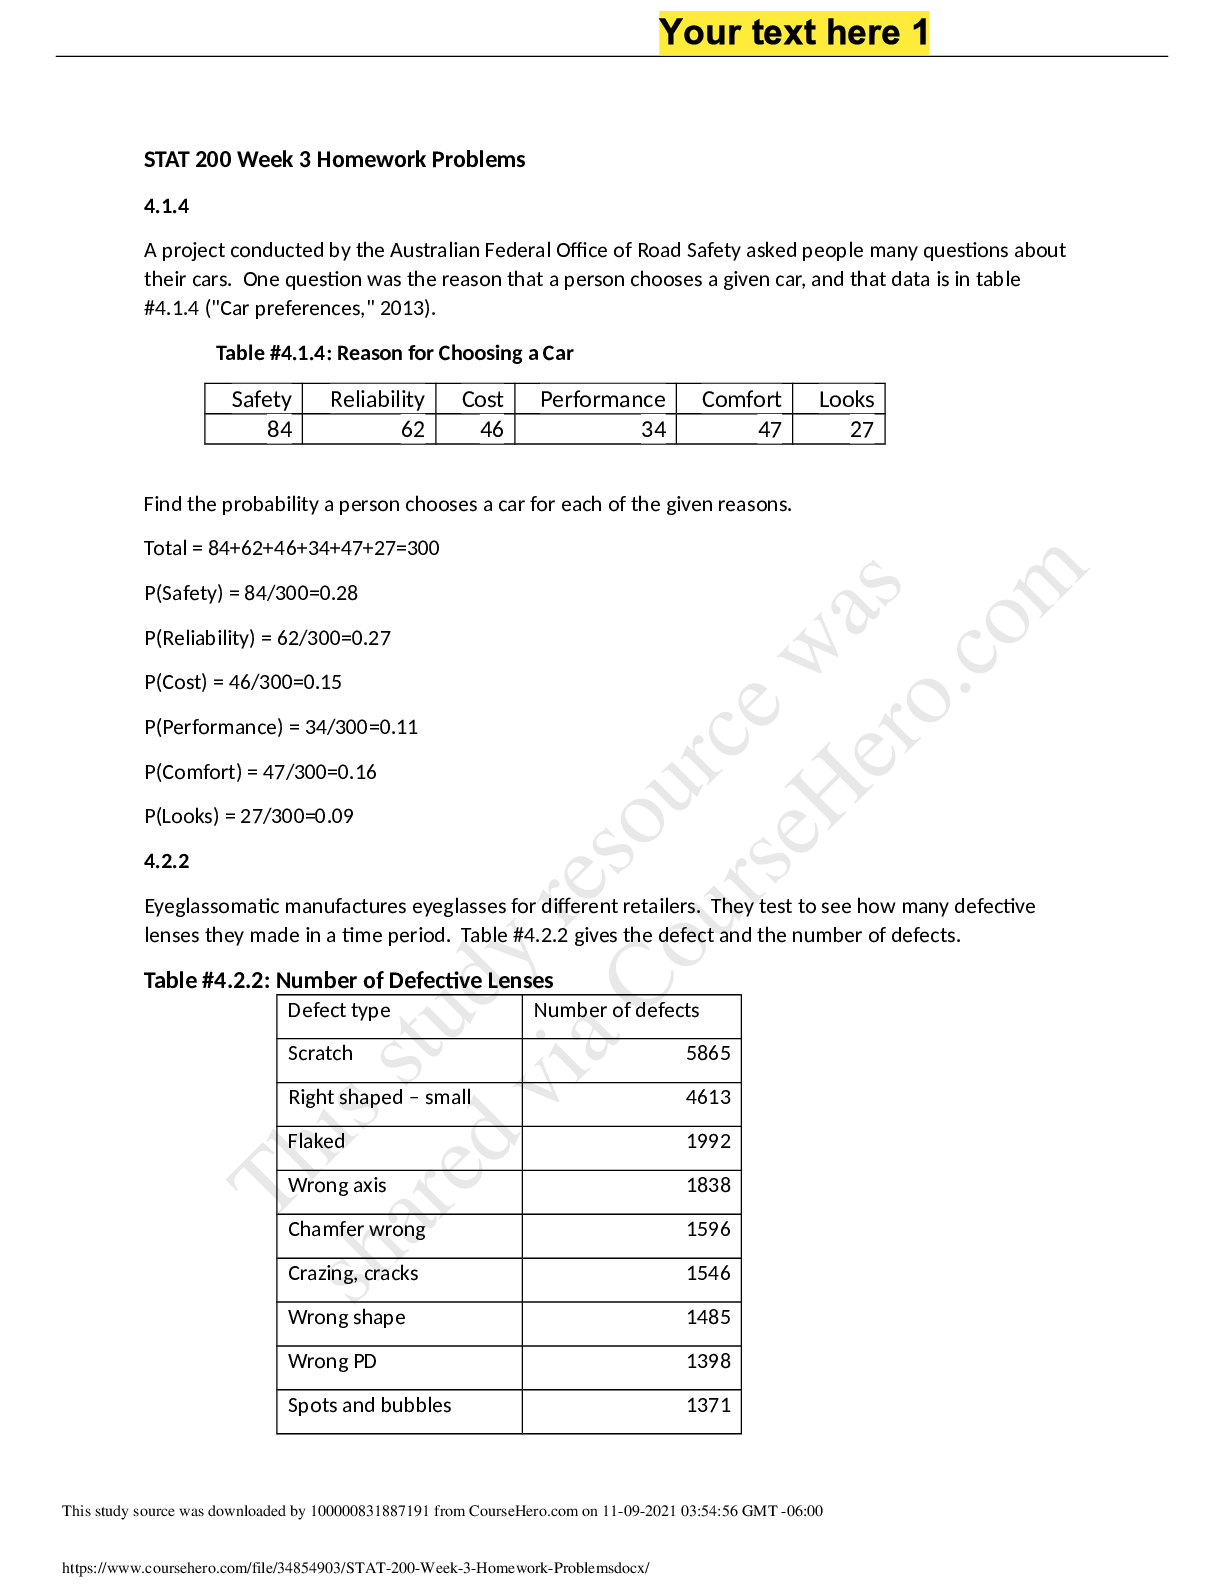
STAT 200 Week 3 Homework Problems.
Document Content and Description Below
Last updated: 3 years ago
Preview 1 out of 6 pages
Instant download
Buy this Document to get the Full Access Instantly
Provided by Students Who Aced it
We Verify Document Content to Gurantee Accuracy
Reviews( 0 )
Document information
Connected school, study & course
About the document
Uploaded On
Sep 07, 2021
Number of pages
6
Written in
All

Additional information
This document has been written for:
Uploaded
Sep 07, 2021
Downloads
0
Views
122
Document Keyword Tags
Recommended For You
Get more on STUDY GUIDE »

STAT 200 Week 6 Homework Problems, full solution guide, 100% c...


STAT 200 Week 3 Homework Problems. GRADED A. BEST REVISION TOO...

STAT 200 FINAL EXAM 1 ; Latest Complete Solutions with shown w...

STAT 200 Week 2 Homework |Latest Questions And Answers {Comple...

Quiz Submissions - Week 1: Quiz 1 - STAT 200 6372 Introduction...

STAT 200 STAT200 MIDTERM EXAM ANSWERS (2021) - UMUC (all solut...

STAT 200 FINAL EXAM 1 ; Latest Complete Solutions with shown w...
STAT 200 6372 Introduction to Statistics (2202) / STAT 200 wee...
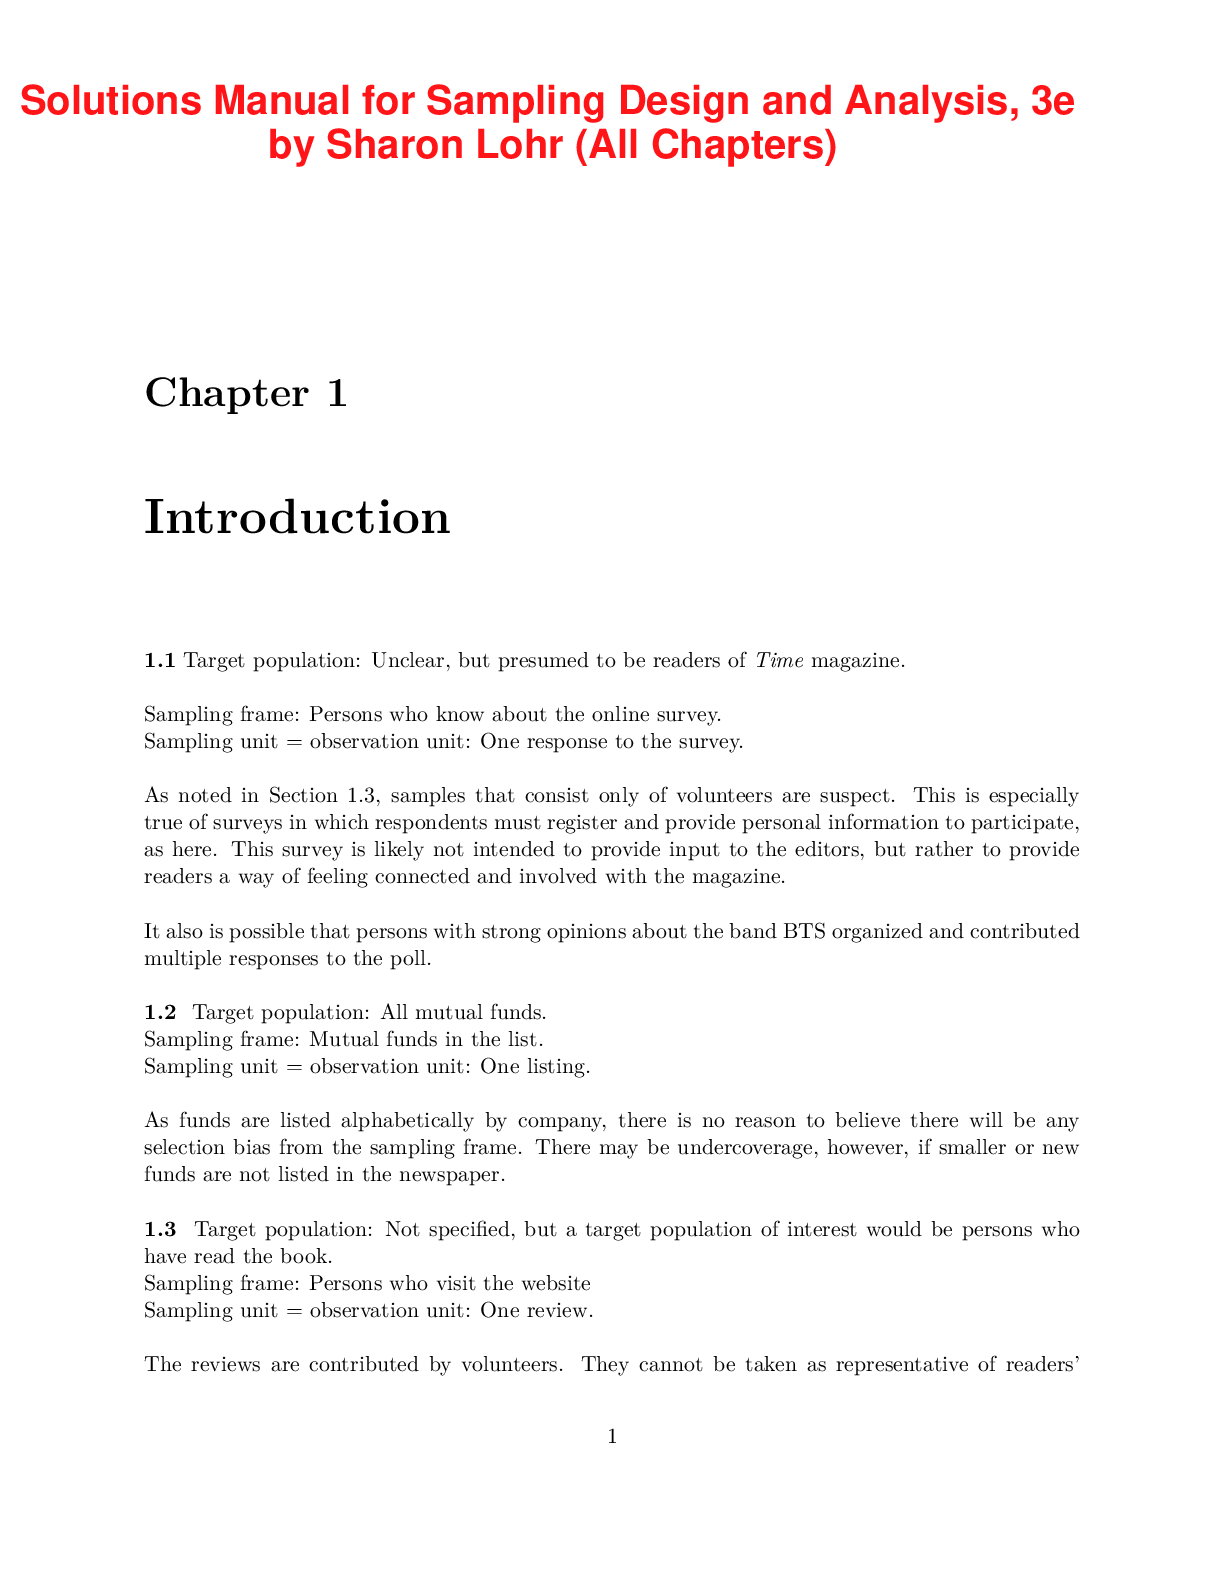
Sampling Design and Analysis, 3e by Sharon Lohr (Solutions Man...
.png)
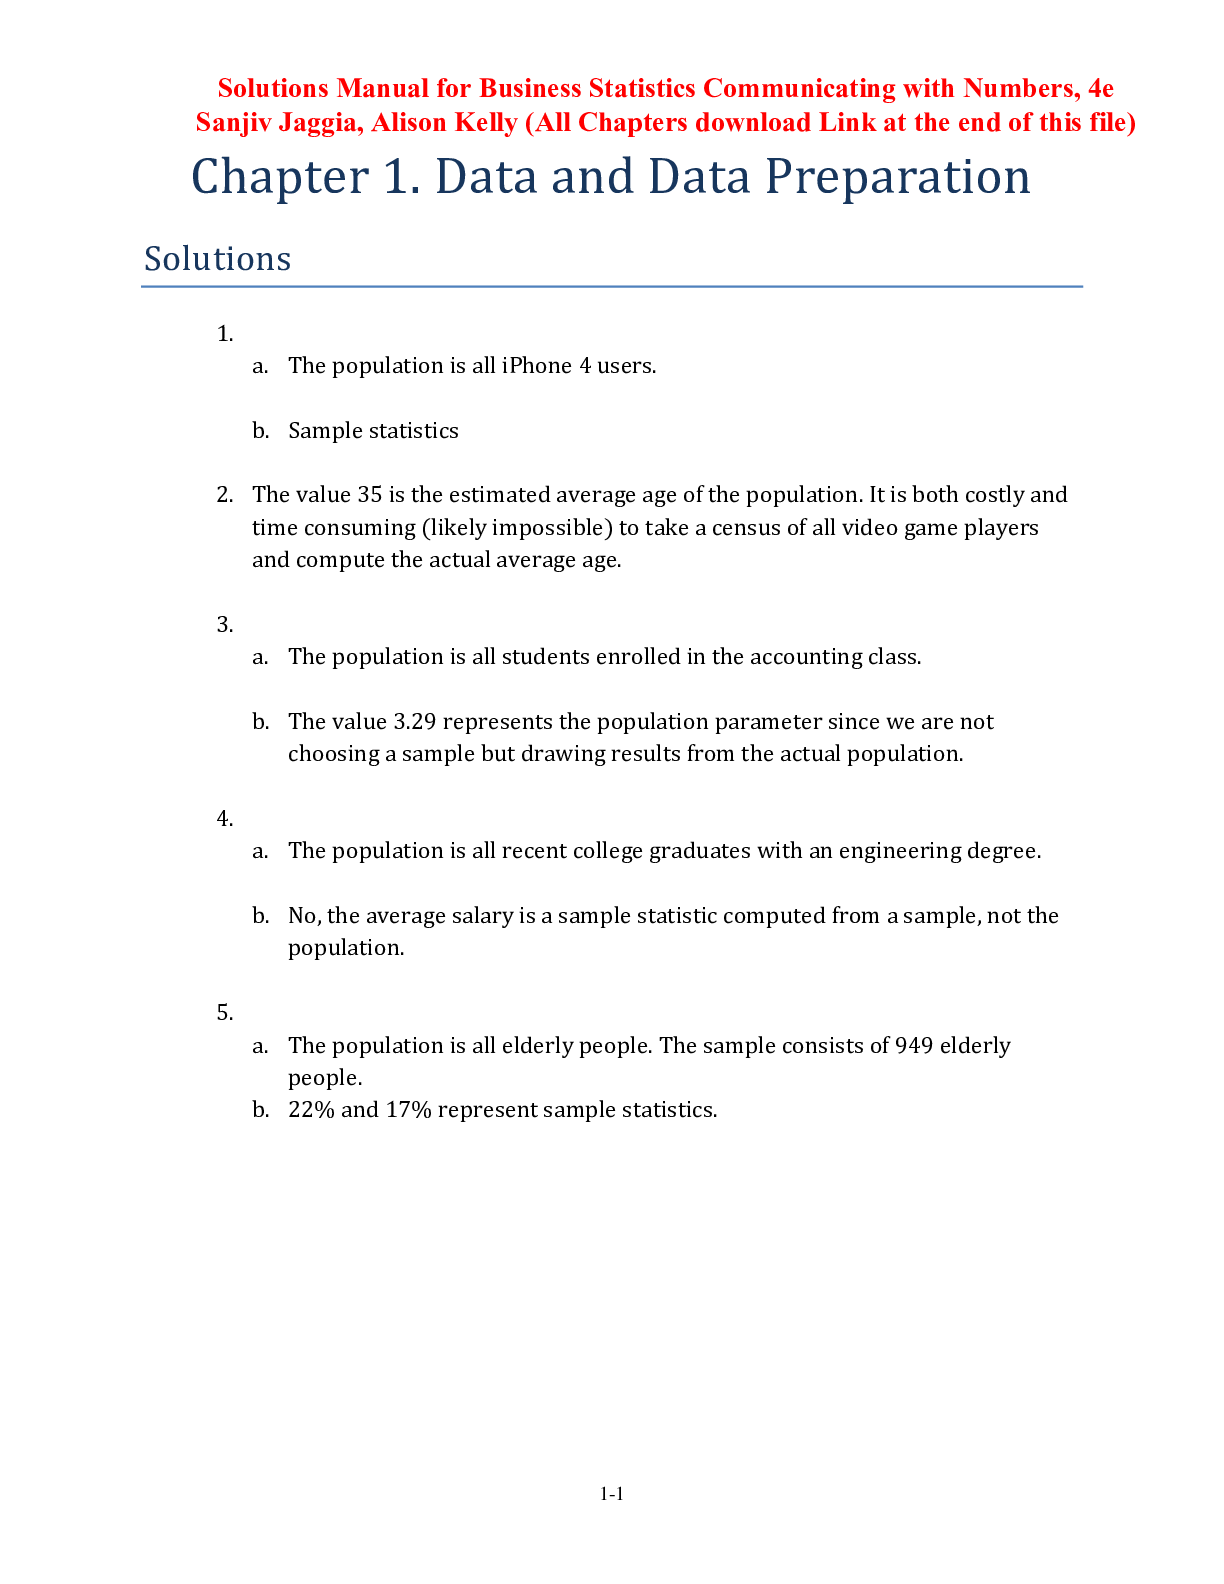
Business Statistics, 4e Norean Sharpe, Richard Veaux, Paul Vel...


.png)
.png)
