Mathematics > AQA QUESTION and MARK SCHEMES > Week 7 Quiz with answers.pdf (All)
Week 7 Quiz with answers.pdf
Document Content and Description Below
Last updated: 3 years ago
Preview 1 out of 20 pages
Instant download

Buy this Document to get the Full Access Instantly
Provided by Students Who Aced it
We Verify Document Content to Gurantee Accuracy
Reviews( 0 )
Document information
Connected school, study & course
About the document
Uploaded On
Nov 16, 2021
Number of pages
20
Written in
All

Additional information
This document has been written for:
Uploaded
Nov 16, 2021
Downloads
0
Views
90
Document Keyword Tags
Recommended For You
Get more on AQA QUESTION and MARK SCHEMES »
Discrete Mathematics and Its Applications 8th Edition by Kenne...
Finite Mathematics & Its Applications, 13e Larry Goldstein, Da...
.png)
 2e Peter Olver, Chehrzad Shakiban.png)
Applied Linear Algebra (Undergraduate Texts in Mathematics) 2n...

Probability & Statistics Homework 2: Theoretical Probability:...
HESI COMPREHENSIVE EXIT EXAM 2025/2026 AND PRACTICE EXAM TEST...
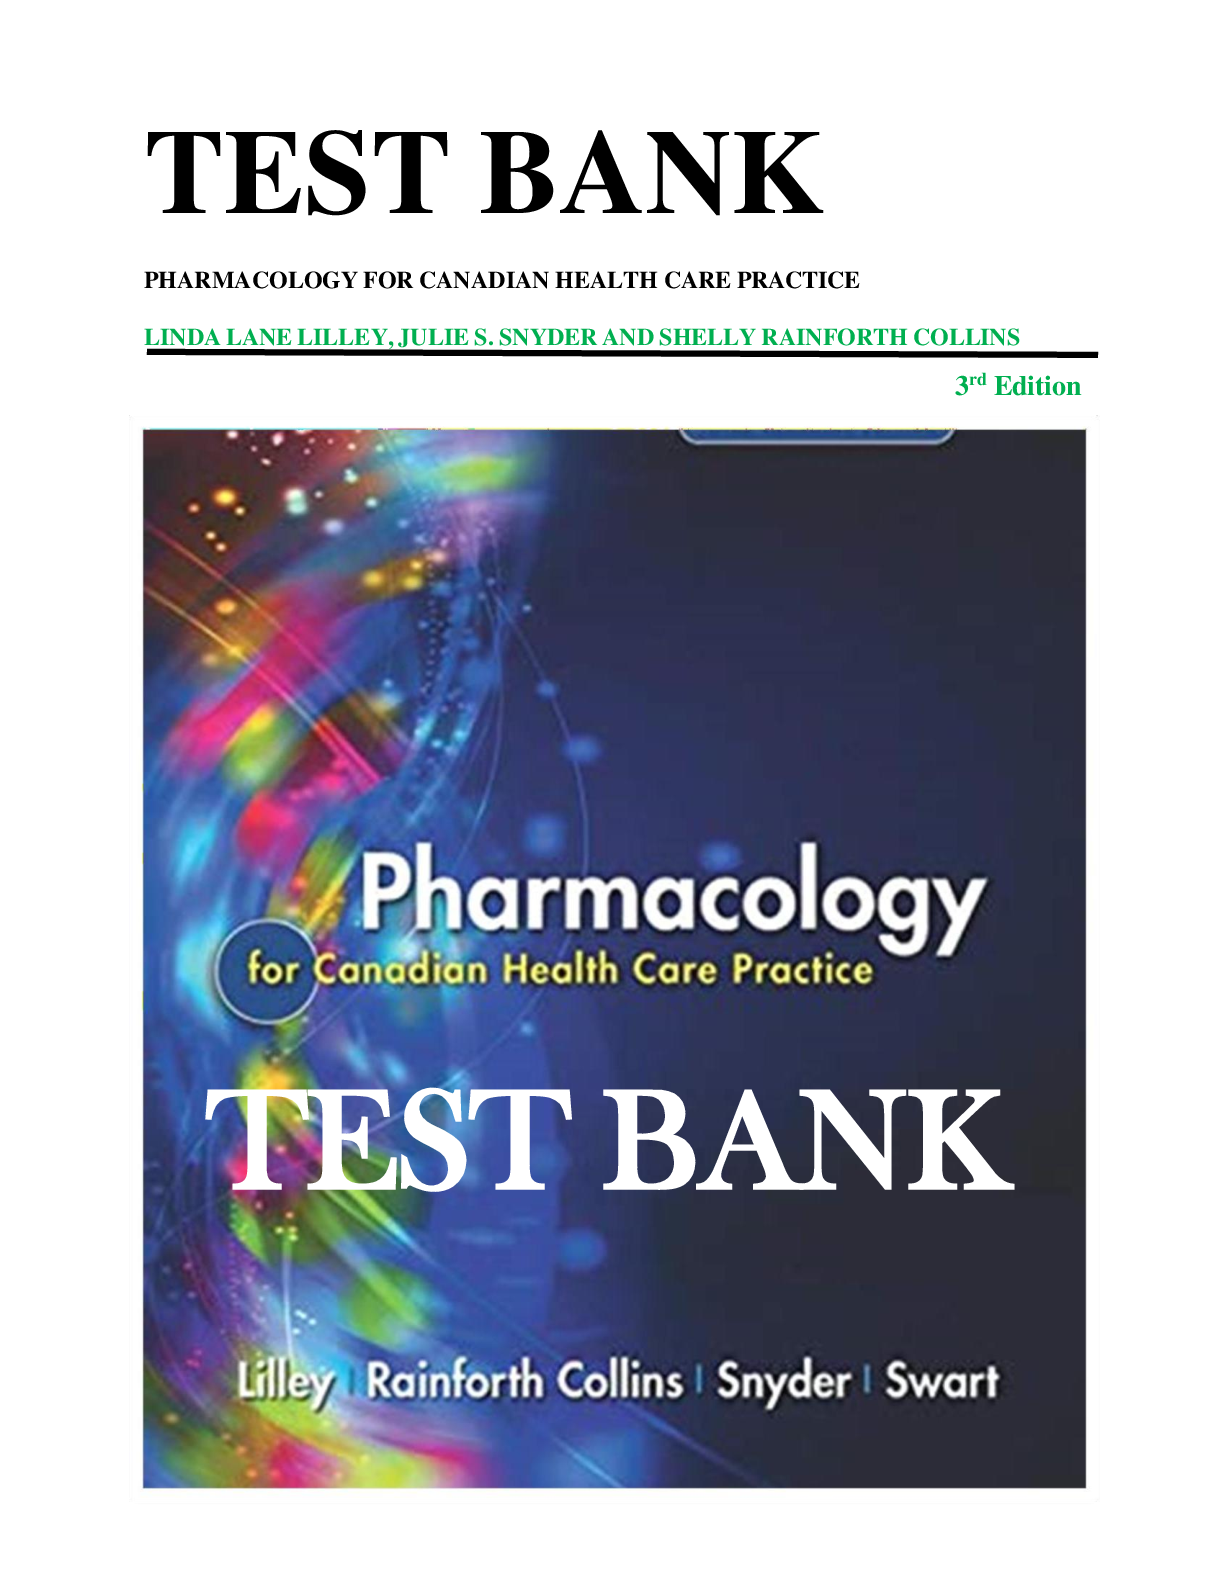
TEST BANK PHARMACOLOGY FOR CANADIAN HEALTH CARE PRACTICE LINDA...
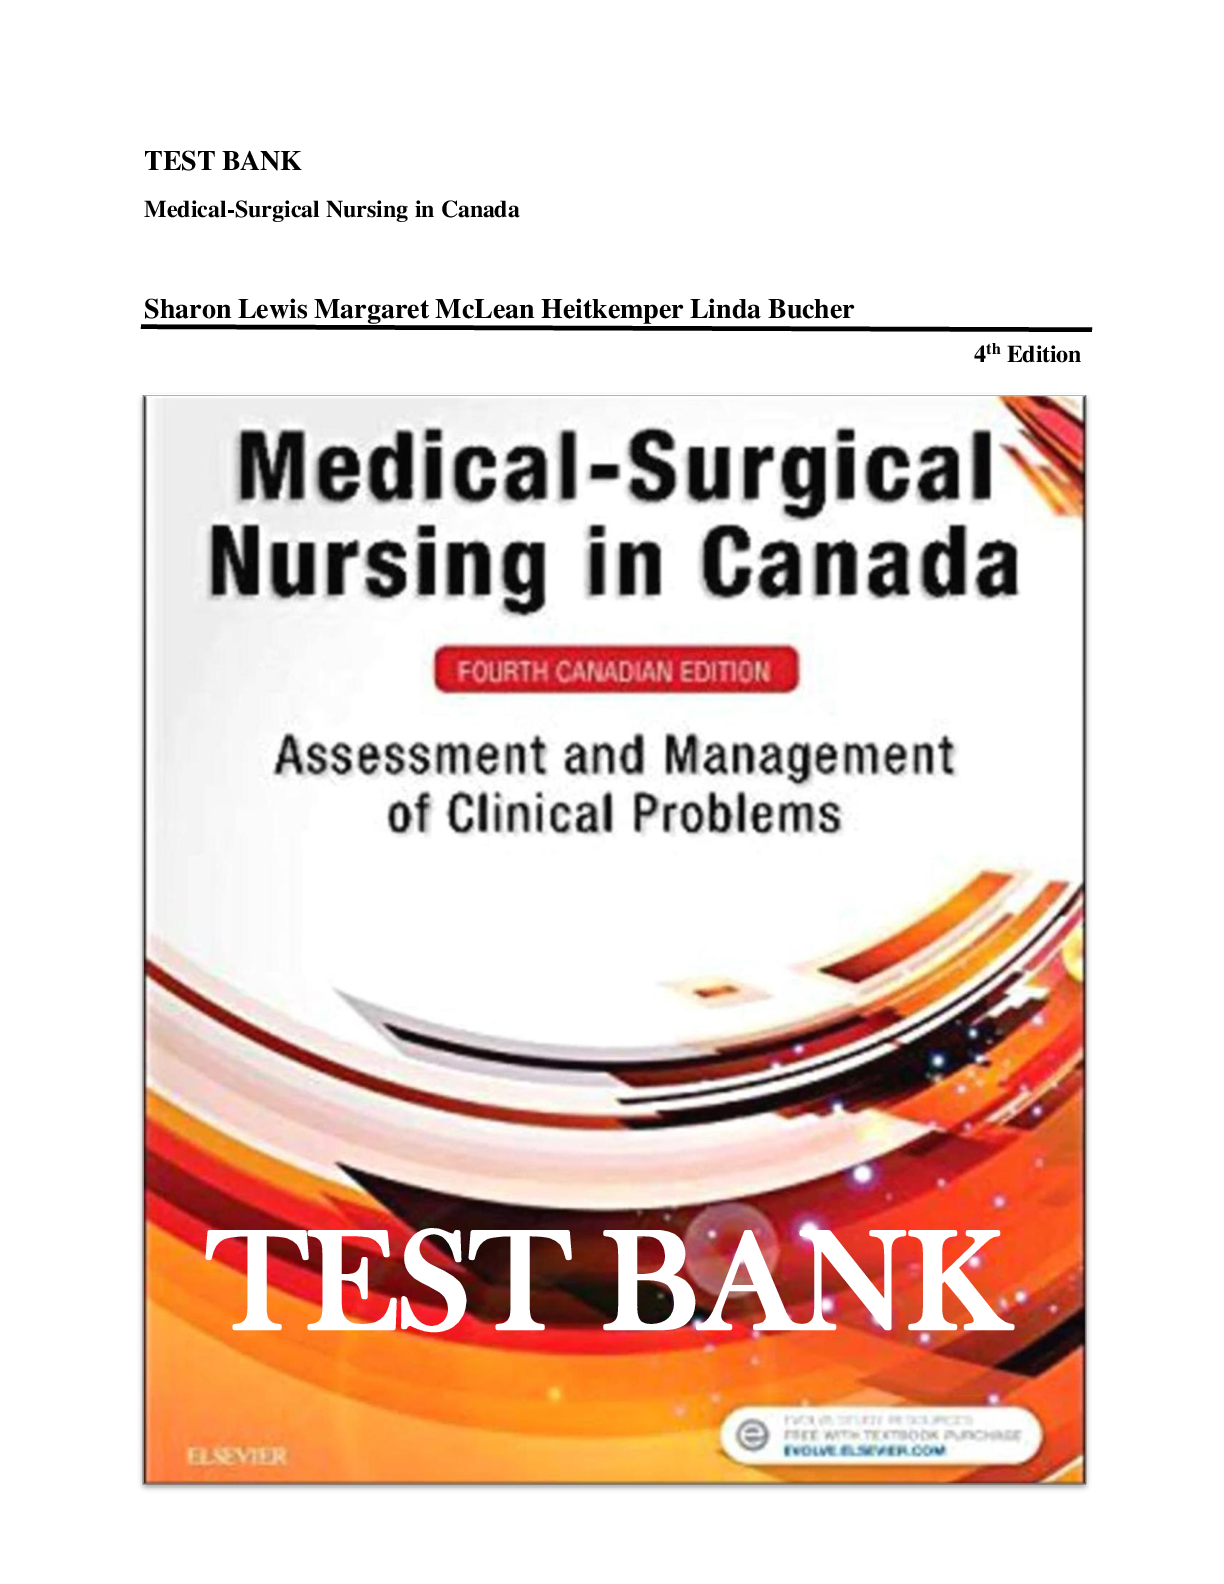
TEST BANK Medical-Surgical Nursing in Canada Sharon Lewis Marg...
Test Bank - for Managerial Accounting, 5th Edition by Stacey W...