University of Houston
MATH 3339
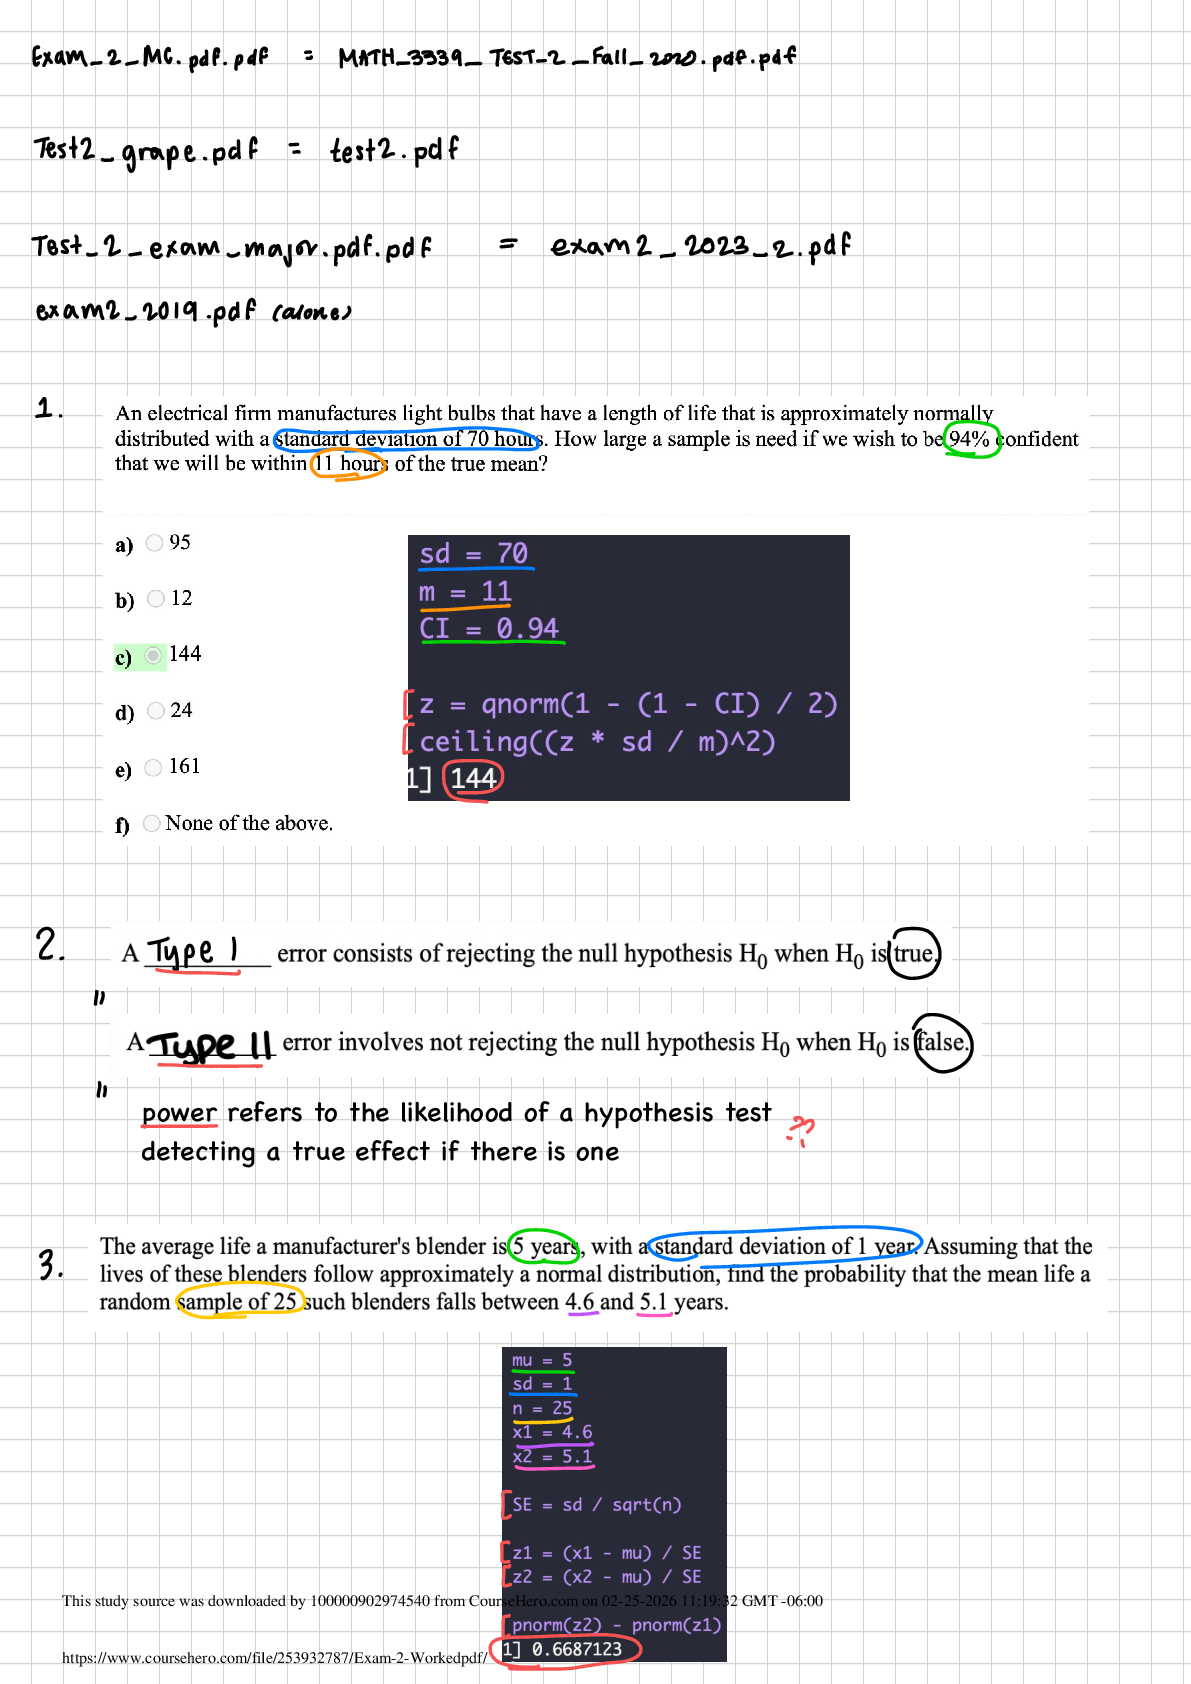
An electrical firm manufactures light bulbs that have a length of life that is approximately normally
distributed with a standard deviation of 70 hours. How large a sample is need
...
University of Houston
MATH 3339
An electrical firm manufactures light bulbs that have a length of life that is approximately normally
distributed with a standard deviation of 70 hours. How large a sample is need if we wish to be 99%
confident that we will be within 11 hours of the true mean?
Question number 2.
https://ccs.casa.uh.edu/cgi-bin/canvas?course=10114_student_…d4cc1239e0058e3db07a62b43f6108e3df81f48c0ffa2e028015ac 5/5/24, 7:22 PM
Page 1 of 9
A __________ error involves not rejecting the null hypothesis H0 when H0 is false.
A Type I
B Power
C Type II
Question number 3.
Your answer was A. Correct.
The average life a manufacturer's blender is 5 years, with a standard deviation of 1 year. Assuming
that the lives of these blenders follow approximately a normal distribution, find the probability that
the mean life a random sample of 9 such blenders falls between 4.6 and 5.3 years.
A 0.7009
B 0.2991
C 0.8159
https://ccs.casa.uh.edu/cgi-bin/canvas?course=10114_student_…d4cc1239e0058e3db07a62b43f6108e3df81f48c0ffa2e028015ac 5/5/24, 7:22 PM
Page 2 of 9
D 0.2733
E 0.1841
F None of the above.
Question number 4.
Your answer was A. Wrong.
What will reduce the width of a confidence interval?
A Decrease the number in sample.
B Increase confidence level.
C Decrease variance.
D Increase variance.
Question number 5.
A sample of 31 boxes of cereal has a sample standard deviation of 0.81 ounces. Construct a 93%
confidence interval to estimate the true standard deviation of the filling process for the boxes of
cereal.
A (0.731, 0.731)
B (0.658, 1.058)
C (0.433, 1.120)
D (0.525, 1.095)
E None of the above.
Question number 6.
The table below gives the pretest and post test scores on the MLA's listening test in Spanish for 10
high school Spanish teachers who attended an intensive summer course in Spanish.
https://ccs.casa.uh.edu/cgi-bin/canvas?course=10114_student_…d4cc1239e0058e3db07a62b43f6108e3df81f48c0ffa2e028015ac 5/5/24, 7:22 PM
Page 4 of 9
Teacher Pre-test Post-test
Find a 95% confidence interval for the mean difference in listening score due to attending the
summer institute.
A (-2.1267, 0.1267)
B (-5.4838, 3.4838)
C (-4.6985, 2.6985)
D (-2.3904, 0.3904)
E (-3.8358, 1.8358)
https://ccs.casa.uh.edu/cgi-bin/canvas?course=10114_student_…d4cc1239e0058e3db07a62b43f6108e3df81f48c0ffa2e028015ac 5/5/24, 7:22 PM
Page 5 of 9
Question number 7.
In a random sample of 121 observations produced a sample proportion 0.25. An approximate 95%
confidence interval for the population proportion is
A (0.173, 0.327)
B (0.211, 0.289)
C (0.173, 0.315)
D (0.161, 0.339)
E (0.185, 0.315)
Question number 8.
Your answer was A. Correct.
https://ccs.casa.uh.edu/cgi-bin/canvas?course=10114_student_…d4cc1239e0058e3db07a62b43f6108e3df81f48c0ffa2e028015ac 5/5/24, 7:22 PM
Page 6 of 9
This is a written question, worth 17 points. DO NOT place the problem code on the answer
sheet. A proctor will fill this out after exam submission. Show all steps (work) on your answer
sheet for full credit.
Problem Code: 8327
Suppose the random variable has CDF given by the function
Part a: Find .
Part b: Find the desity function .
Part c: Find .
Part d: Find the variance of .
Part e: Find the median of .
A I have placed my work and my answer on my answer sheet.
B I want to have points deducted from my test for not working this problem.
Question number 9.
Your answer was A. Correct.
This is a written question, worth 17 points. DO NOT place the problem code on the answer
sheet. A proctor will fill this out after exam submission. Show all steps (work) on your answer
sheet for full credit.
Problem Code: 9324
A study of iron deficiency in infants compared samples of infants whose mothers chose different
ways of feeding them. One group contained breast-fed infants. The children in another group were
fed a standard baby formula without any iron supplements. Here are summary results on blood
hemoglobin levels at 12 months of age:
Group n x s
Breast-fed 23 15.3 2.2
Formula 31 16.9 1.8
Part a: We want to see if the mean hemoglobin level is greater among formula-fed babies. State the
hypotheses.
Part b: Perform the significance test on your hypothesis. Report the test statistic and p-value. State
your conclusion in terms of the issue.
Part c: Give a 95% confidence interval for the mean difference in hemoglobin level between the two
populations of infants.
A I have placed my work and my answer on my answer sheet.
B I want to have points deducted from my test for not working this problem.
Question number 10.
Your answer was A. Correct.
https://ccs.casa.uh.edu/cgi-bin/canvas?course=10114_student_…d4cc1239e0058e3db07a62b43f6108e3df81f48c0ffa2e028015ac 5/5/24, 7:22 PM
Page 8 of 9
This is a written question, worth 17 points. DO NOT place the problem code on the answer
sheet. A proctor will fill this out after exam submission. Show all steps (work) on your answer
sheet for full credit.
Problem Code: 1036
The belief is that the mean number of hours per week of part-time work of high school seniors in a
city is 10.4 hours. Data from a simple random sample of 27 seniors indicated that their mean number
of part-time work was 12.6 with a standard deviation of 1.2. Test whether these data cast doubt on
the current belief. (use α = 0.05)
[Show More]



.png)
 2e Peter Olver, Chehrzad Shakiban.png)