Question 1
Given a dataset of all positive values, if the largest value of a dataset is doubled, which of the following is
not true?
a) The variance increases
b) The range increases
c) The standard deviation incre
...
Question 1
Given a dataset of all positive values, if the largest value of a dataset is doubled, which of the following is
not true?
a) The variance increases
b) The range increases
c) The standard deviation increases
d) The mean increases
e) The interquartile range increases
Question 2
Given that , find .
a) 0.761
b) 0.124
c) 0.876
d) 0.239
e) 0.407
Question 3
A service center receives an average of 0.6 customer complaints per hour. Management's goal is to receive
fewer than three complaints each hour. Assume the number of complaints follows the Poisson distribution.
Determine the probability that exactly four complaints will be received during the next eight hours.
a) 0.524
( ) = 0.27, ( ) = 0.46, and ( ∩ ) = 0.11 ( )
Q3- Q
IAB=PAB
i = 0 .239
0
.6x8 = 4 . 8
ADF.tt meblethey'rean increasing
MMAfffg gm.it
on
MAMMA
b) 0.182
c) 0.476
d) 0.003
e) 1.000
Question 4
The following table displays the results of a sample of 100 in which the subjects indicated their favorite ice
cream of three listed. The data are organized by favorite ice cream and age group. What is the probability that
a person chosen at random will be under 20 years old if he or she favors chocolate?
Age Chocolate Vanilla Strawberry
Over 40 12 8 10
20-40 13 9 13
Under 20 13 19 3
a)
b)
c)
d)
e)
Question 5
Suppose that in a large metropolitan area, 89% of all households have cable tv. Suppose you are interested in
selecting a group of six households from this area. Let X be the number of households in a group of six
households from this area that have cable tv. For what proportion of groups will at most two of the
households have cable tv?
a) 0.979
b) 0.998
87
100
25
38
13
38
13
30
13
100
MAY FEENETTE
so
Magaman
Ie to rememberthis as
EBAY.EEEEE.i
0 0018 0.002
c) 0.019
d) 0.021
e) 0.002
Question 6
A random sample of 144 observations produced a sample proportion of 0.35. An approximate 90%
confidence interval for the population proportion p is between
a) 0.285 and 0.415
b) 0.285 and 0.428
c) 0.310 and 0.390
d) 0.272 and 0.428
e) 0.269 and 0.431
Question 7
A potato chip company calculated that there is a mean of 73.6 broken potato chips in each production run
with a standard deviation of 5.1. If the distribution is approximately normal, find the probability that there
will be fewer than 71 broken chips in a run.
a) 0.153
b) 0.695
c) 0.305
d) 0.605
e) 0.555
Question 8
Identify the most appropriate test to use for the following situation:
A national computer retailer believes that the average sales are greater for salespersons with a college degree.
A random sample of 14 salespersons with a degree had an average weekly sale of $3542 last year, while 17
salespersons without a college degree averaged $3301 in weekly sales. The standard deviations were $468
and $642 respectively. Is there evidence to support the retailer's belief?
NY fm d f
MSN.EE ETBiEEim
a) Two sample z test for means
b) Two sample z test for proportions
c) Two sample t test for means
d) One sample z test for proportions
e) One sample t test for means
f) Matched pairs t test for means
g) One sample z test for means
Question 9
The weights of male and female students in a class are summarized in the following boxplots:
Which of the following is NOT correct?
a) The mean weight of the female students is about 120 because of symmetry.
b) The male students have less variability than the female students.
c) About 50% of the male students have weights between 150 and 185 lbs.
d) The median weight of the male students is about 166 lbs.
Question 10
Data for gas mileage (in mpg) for different vehicles was entered into a software package and part of the
ANOVA table is shown below:
Source DF SS MS
Vehicle 6 420 70.00
Error 7 303 43.29
Total 13 723
t test
sample
7 test
population
e
Man
Determine the p-value for the data.
a) 0.0162
b) 0.1356
c) 0.4652
d) 0.2712
e) 0.0904
Question 11
A random sample of 144 cans of fruit nectar is drawn from among all cans produced in a run. Prior
experience has shown that the distribution of the contents has a mean of 12.25 ounces and a standard
deviation of 2.14 ounce. What is the probability that the average contents of the 144 sample cans is less than
12.01 ounces?
a) 0.223
b) 0.178
c) 0.822
d) 0.911
e) 0.089
Question 12
If the P-value is larger than the level of significance α, then the researcher should __________ at level α.
a) Fail to reject H0
b) Reject H0
c) Accept H0
Question 13
For a specific location in a particularly rainy city, the time a new thunderstorm begins to produce rain (first
drop time) is uniformly distributed throughout the day and independent of this first drop time for the
surrounding days. Given that it will rain at some point both of the next two days, what is the probability that
the first drop of rain will be felt between AM and PM on both days? 8 : 45 2 : 25
0
1st teststatistic V 62
That
MSN.AMEMM¬phovm
12.01 12.25 2.14V44
0.089
lesswereject
1
45
a) 0.0557
b) 0.2361
c) 0.9416
d) 0.2417
e) 0.0584
f) None of the above.
Question 14
The one-sample t statistic for a test of H0: μ = 15 vs. Ha: μ < 15 based on n = 15 observations has the test
statistic value of t = -1.36. What is the p-value for this test?
a) 0.902
b) 0.098
c) 0.398
d) 0.000
e) 0.195
Question 15
A student is taking their Statistics final exam. For a particlar problem there are three versions. All versions
ask for a value of so that , where varies depending on the problem version. Assume
that follows the following distrubution:
Find .
a)
b)
c)
d)
( ≤ ) =
( = 0.67) = , 1 ( = 0.61) = , ( = 0.67) =
8
14
58
[ ]
0.821
0.552
0.768
0.827
8:45 - 2: 25
&t pop no
z
(ai + 5 . 667)
Pt( - 1.36
,
14)
quorm (0 . 67) ·t + qnorm (0 -61)I
+anorm 10 .67)·E
Margin 5.67 124 0.0558
MMMM
iii In on
MANNAREAE
10.399
e)
f) Cannot be determined.
Question 16
This is a written question, worth 11 points. DO NOT place the problem code on the answer sheet. A
proctor will fill this out after exam submission. Show all steps (work) on your answer sheet for full
credit.
Problem Code: 1611
A person's muscle mass is expected to decrease with age. To explore this relationship in women, a nutritionist
randomly selected 60 women aging from age 40 to 79 and measured their muscle mass. Using age as the
explanatory variable and the muscle mass as the dependent variable, computer output of the data is as follows
(the p-values are intentionally left blank):
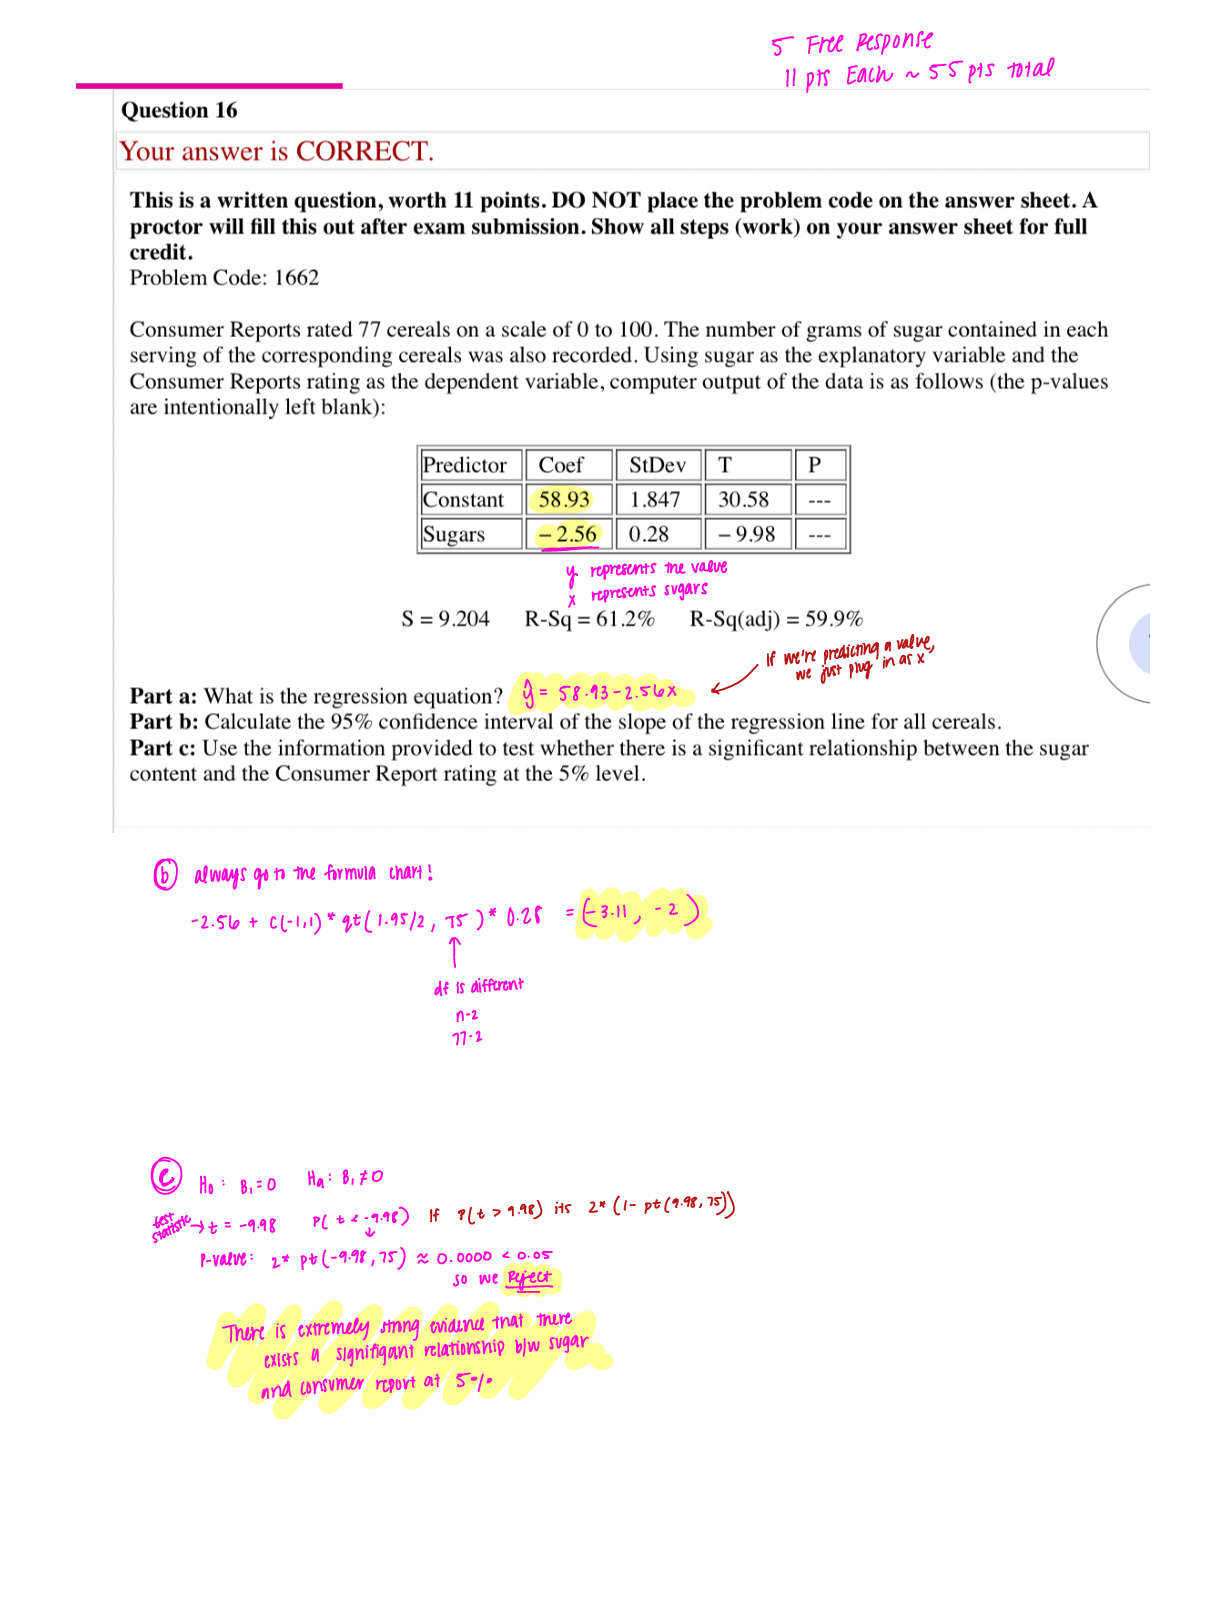
Predictor Coef StDev T P
Constant 113.052 9.170 12.329 ---
Age - 0.428 0.137 - 3.124 ---
Part a: What is the regression equation?
Part b: Calculate the 99% confidence interval of the slope of the regression line.
Part c: Use the information provided to test whether there is a significant relationship between a person's age
and muscle mass at the 5% level.
a) I have placed my work and my answer on my answer sheet.
b) I want to have points deducted from my test for not working this problem.
Question 17
This is a written question, worth 11 points. DO NOT place the problem code on the answer sheet. A
proctor will fill this out after exam submission. Show all steps (work) on your answer sheet for full
credit.
Problem Code: 1744
The random variable has probability density function:
Part a: Determine the value of .
0.400
( ) = 16 -
18
0
0 ≤ ≤ 4
otherwise
y Ear
I
ge
ant
y 113.052 0.4284 dt6020
0.428 CC1 qt1.991258 0.137
3.124
nu Pt 3.124,58
Part b: Find , the cumulative distribution function of .
Part c: Find .
Part d: Find the variance and standard deviation of .
Part e: Determine the third quartile of .
a) I have placed my work and my answer on my answer sheet.
b) I want to have points deducted from my test for not working this problem.
Question 18
This is a written question, worth 11 points. DO NOT place the problem code on the answer sheet. A
proctor will fill this out after exam submission. Show all steps (work) on your answer sheet for full
credit.
Problem Code: 1891
Employers would like to know which days of week employees are absent in a six-day work week. Previously
employers believed that employees were absent equally during the week. Suppose a random sample of 60
managers were asked on which day of the week they had the highest number of employee absences. The
results were distributed as in the table below. For the population of employees, do the days of highest number
of absences occur with EQUAL frequencies during a six-day work week? Test at 5% significance level.
Monday Tuesday Wednesday Thursday Friday Saturday
12 10 5 8 13 12
Part a: What type of test should be used in this situation?
Part b: State the hypothesis.
Part c: What is the test statistic?
Part d: Find the p-value and state your conclusion.
a) I have placed my work and my answer on my answer sheet.
b) I want to have points deducted from my test for not working this problem.
Question 19
This is a written question, worth 11 points. DO NOT place the problem code on the answer sheet. A
proctor will fill this out after exam submission. Show all steps (work) on your answer sheet for full
credit.
Problem Code: 1984
( )
[ ]
2
goodness offit
Ho absencesareequal Haabsencesareunequal
4 6
gfffffn.BEfaichisq.test 412.10158.13.12 F 4
The following data are for intelligence-test (IT) scores, reading rates (RR), and grade-point averages (GPA)
of 8 at-risk students.
IT 155 206 156 172 209 191 163 207
RR 43 33 27 35 25 36 36 26
GPA 3.0 2.0 1.7 2.5 2.0 2.7 2.6 1.8
Part a: Calculate the line of best fit that predicts the GPA on the basis of RR scores.
Part b: Calculate the line of best fit that predicts the GPA on the basis of IT scores.
Part c: Which of the two lines calculated in parts a and b best fits the data? Justify your answer.
a) I have placed my work and my answer on my answer sheet.
b) I want to have points deducted from my test for not working this problem.
Question 20
This is a written question, worth 11 points. DO NOT place the problem code on the answer sheet. A
proctor will fill this out after exam submission. Show all steps (work) on your answer sheet for full
credit.
Problem Code: 2023
If the joint probability distribution of and is given by:
Determine:
Part a:
Part b:
Part c:
Part d:
a) I have placed my work and my answer on my answer sheet.
b) I want to have points deducted from my test for not working this problem.
( , ) = , for all + 2 = 0, 1, 2, 3 and = 0, 1, 2
42
( ≤ 2, = 1)
( + = 4)
( + )
( )
IT CC RR CC GPA L
1M GPA RR
1M GPA IT
COV GPARR
Cor OPA IT
biggeravg.fi fymeans
Ii.li
a p x O 4 1 PL 4 1 PL 2 c E Y
442
3 42 4 42 420 9 lt942ttttyyztstislyz.tl
HMtI
b p 4 4 P x 2 4 2 P X 3,4 7
6 42 5142 420 11 131m
[Show More]



.png)
 2e Peter Olver, Chehrzad Shakiban.png)