Mathematics > EXAM > MATH 533 Week 6 Homework Problems (GRADED A+) Questions and Answer Solution | DeVry University (All)
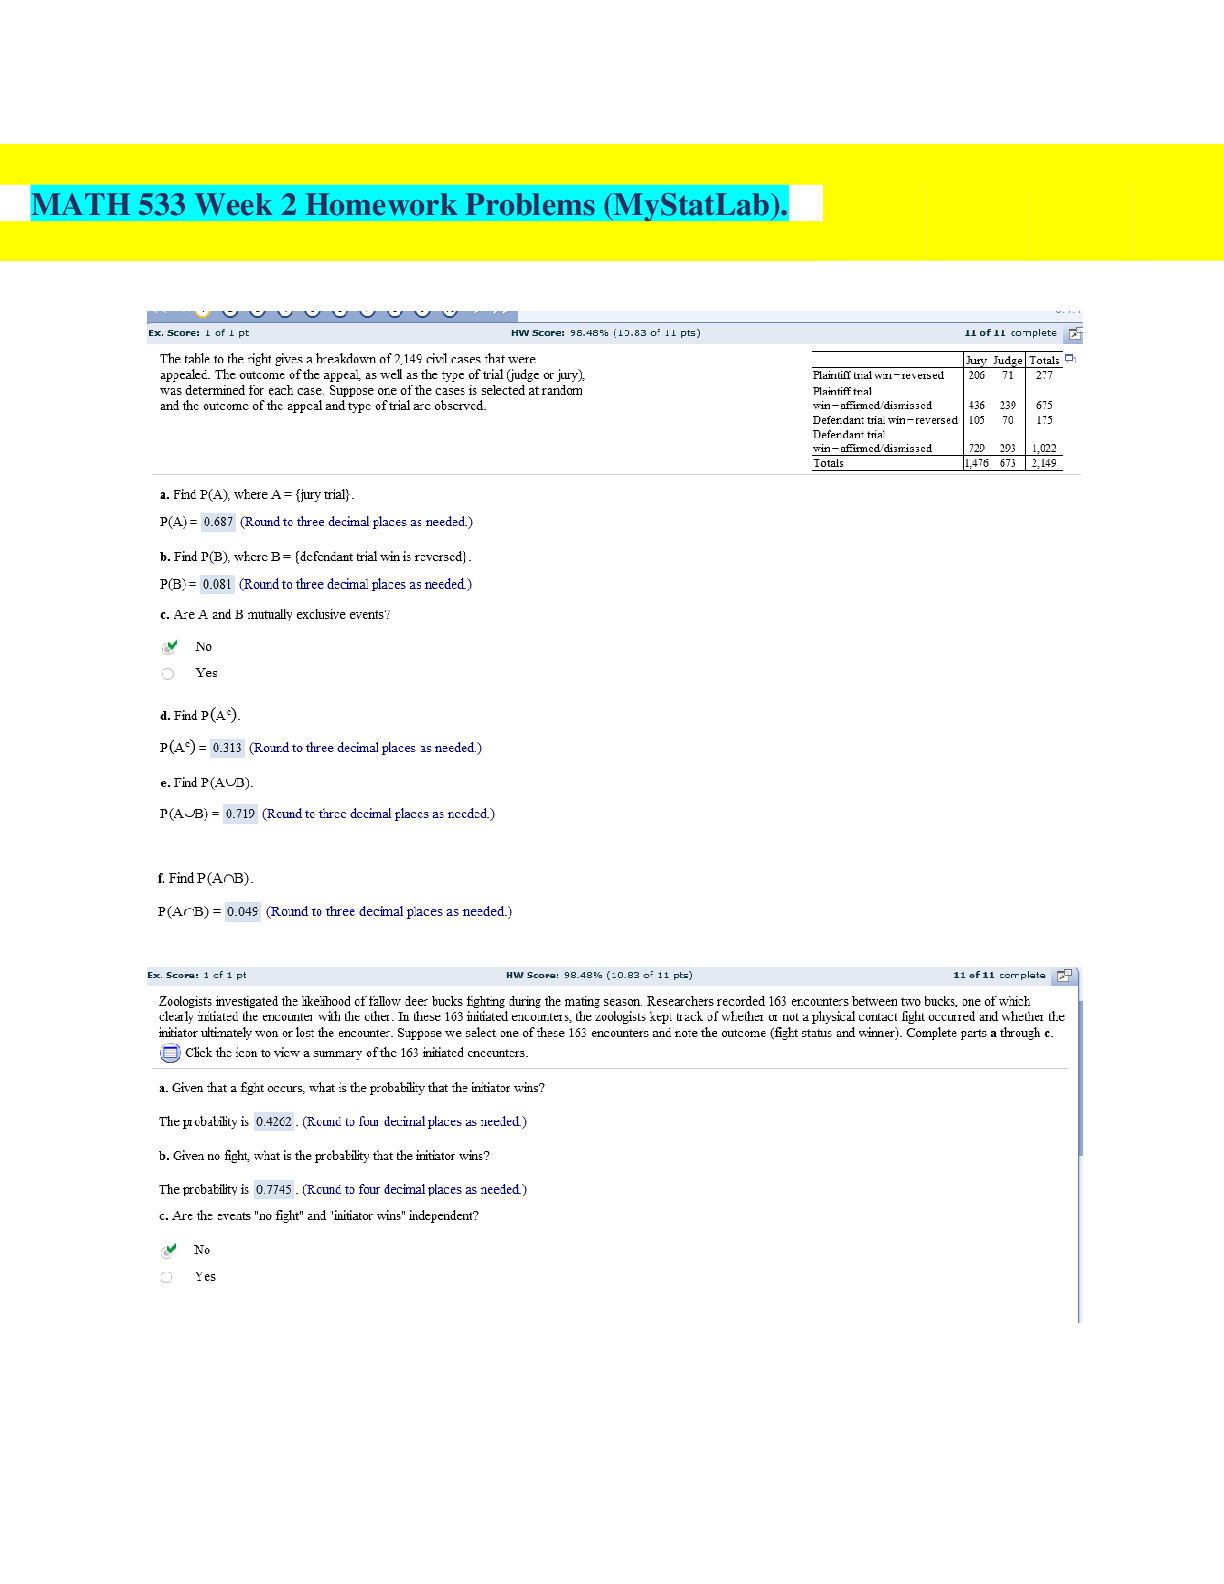
MATH 533 Week 6 Homework Problems (GRADED A+) Questions and Answer Solution | DeVry University
Document Content and Description Below
Last updated: 3 years ago
Preview 1 out of 13 pages
Instant download
.png)
Buy this Document to get the Full Access Instantly
Provided by Students Who Aced it
We Verify Document Content to Gurantee Accuracy
Reviews( 0 )
Document information
Connected school, study & course
About the document
Uploaded On
Jan 19, 2022
Number of pages
13
Written in
All
Seller

Reviews Received
Additional information
This document has been written for:
Uploaded
Jan 19, 2022
Downloads
0
Views
77
Document Keyword Tags
Recommended For You
Get more on EXAM »
MATH 533 WEEK 8 LATEST FINAL EXAM GUARANTEED PASS GRADED A+ S...
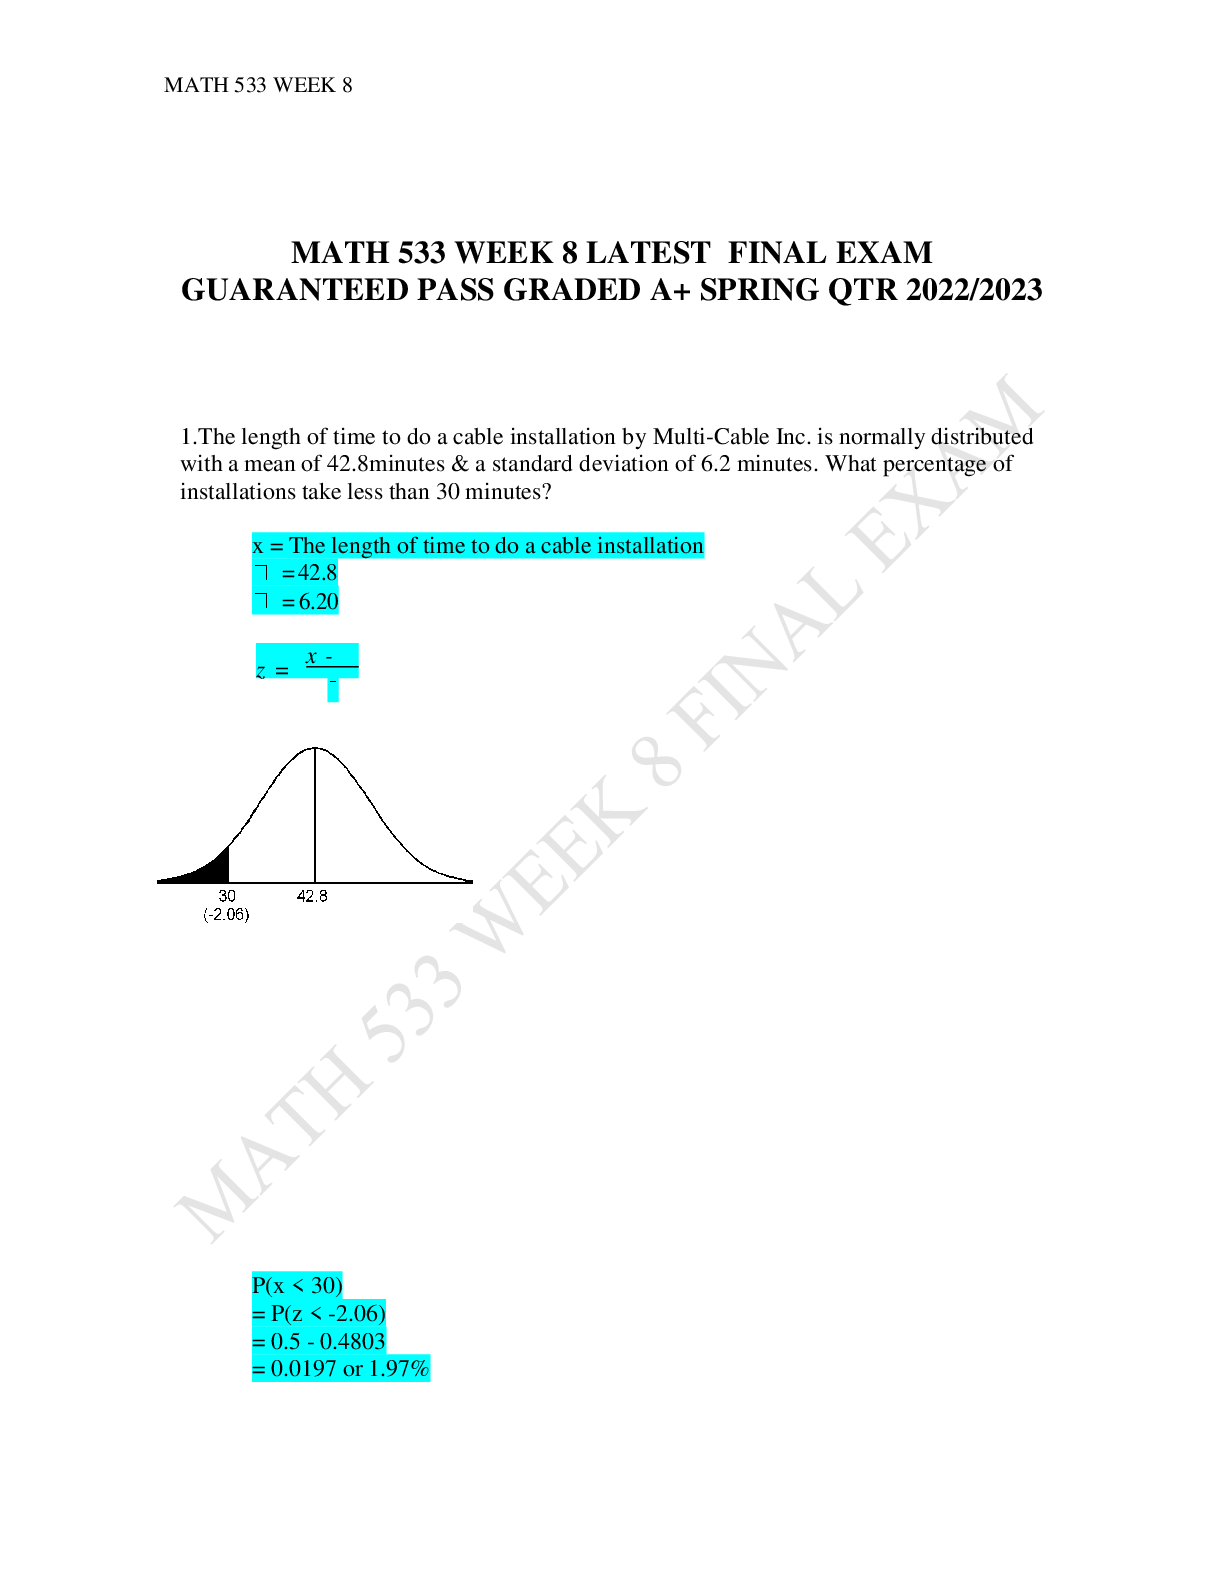
MATH 533 WEEK 8 LATEST FINAL EXAM GUARANTEED PASS GRADED A+ S...

MATH 533 Week 5 Homework Problems/Solutions (GRADED A) Questio...

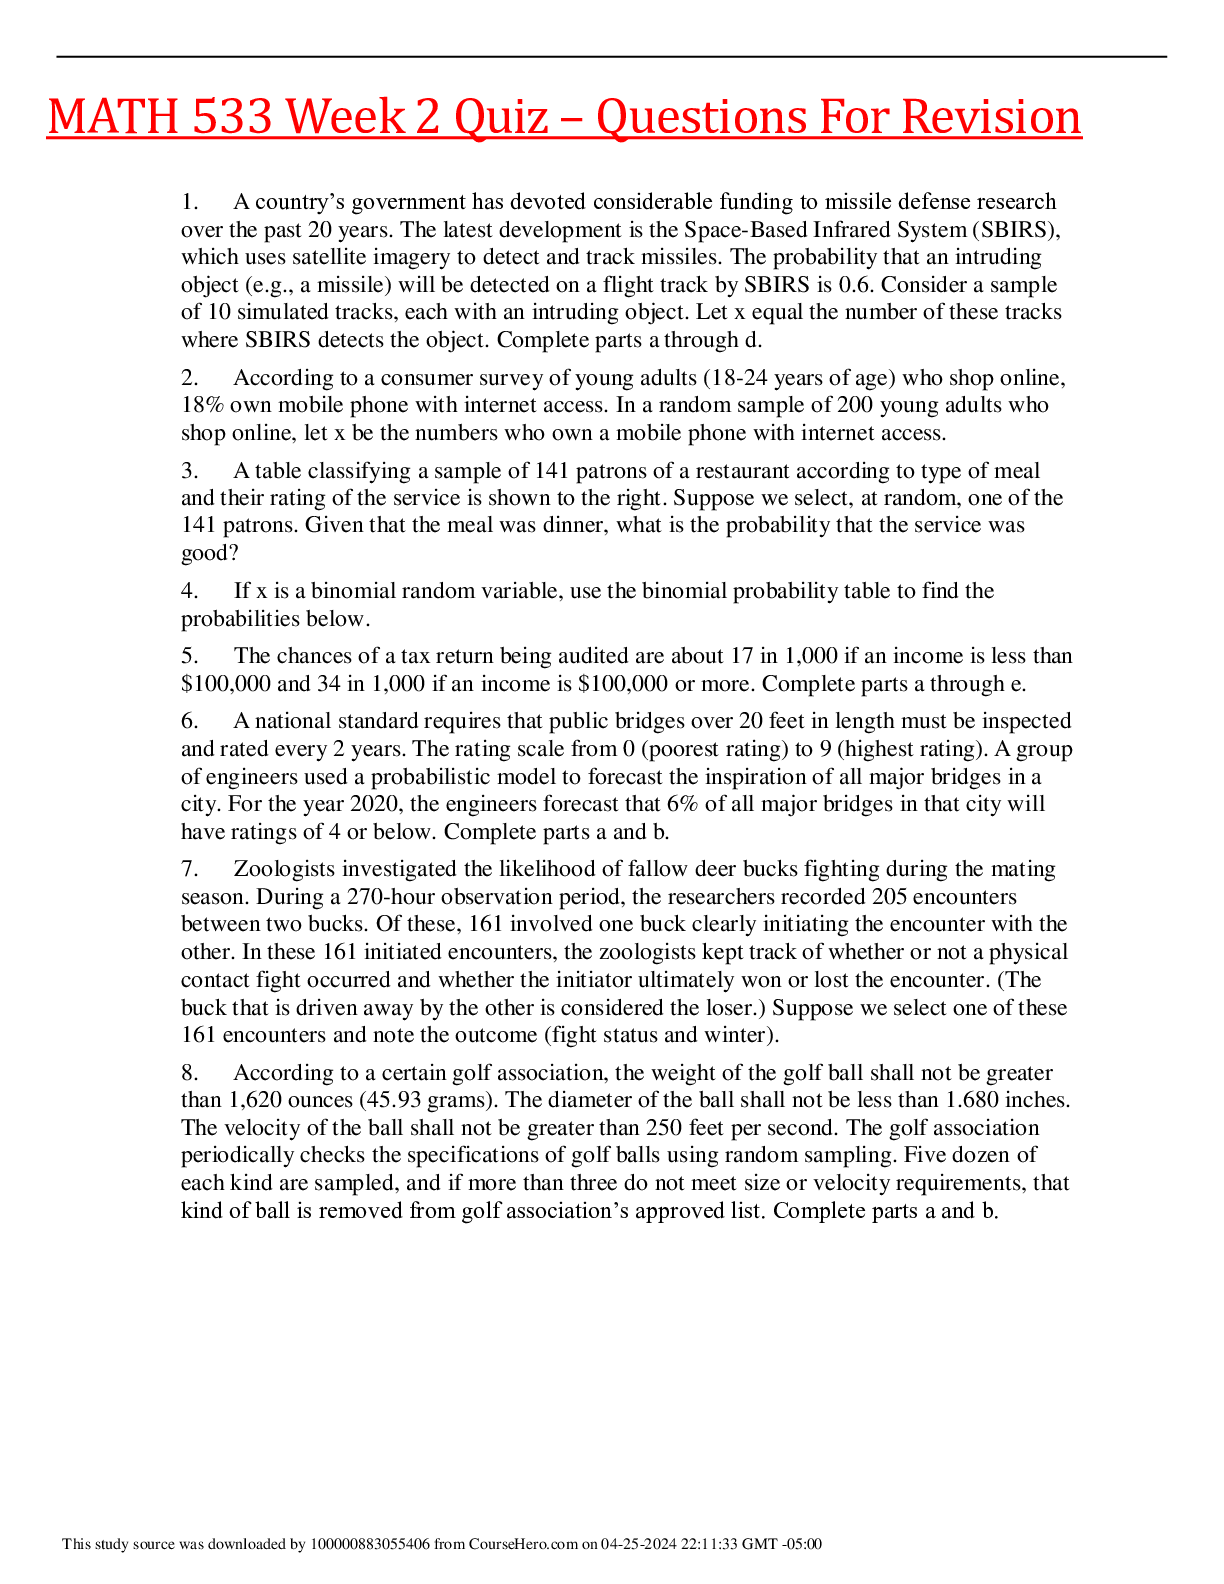
MATH 533 Week 2 Homework Problems (GRADED A+) Questions and An...
.png)
MATH 533 Week 1 Homework Problems (GRADED A) Questions and Ans...

Week 6 MATH 533 Course Project Part B Hypothesis Testing and C...

MATH 533 Week 6 Course Project Part B Hypothesis Testing and C...
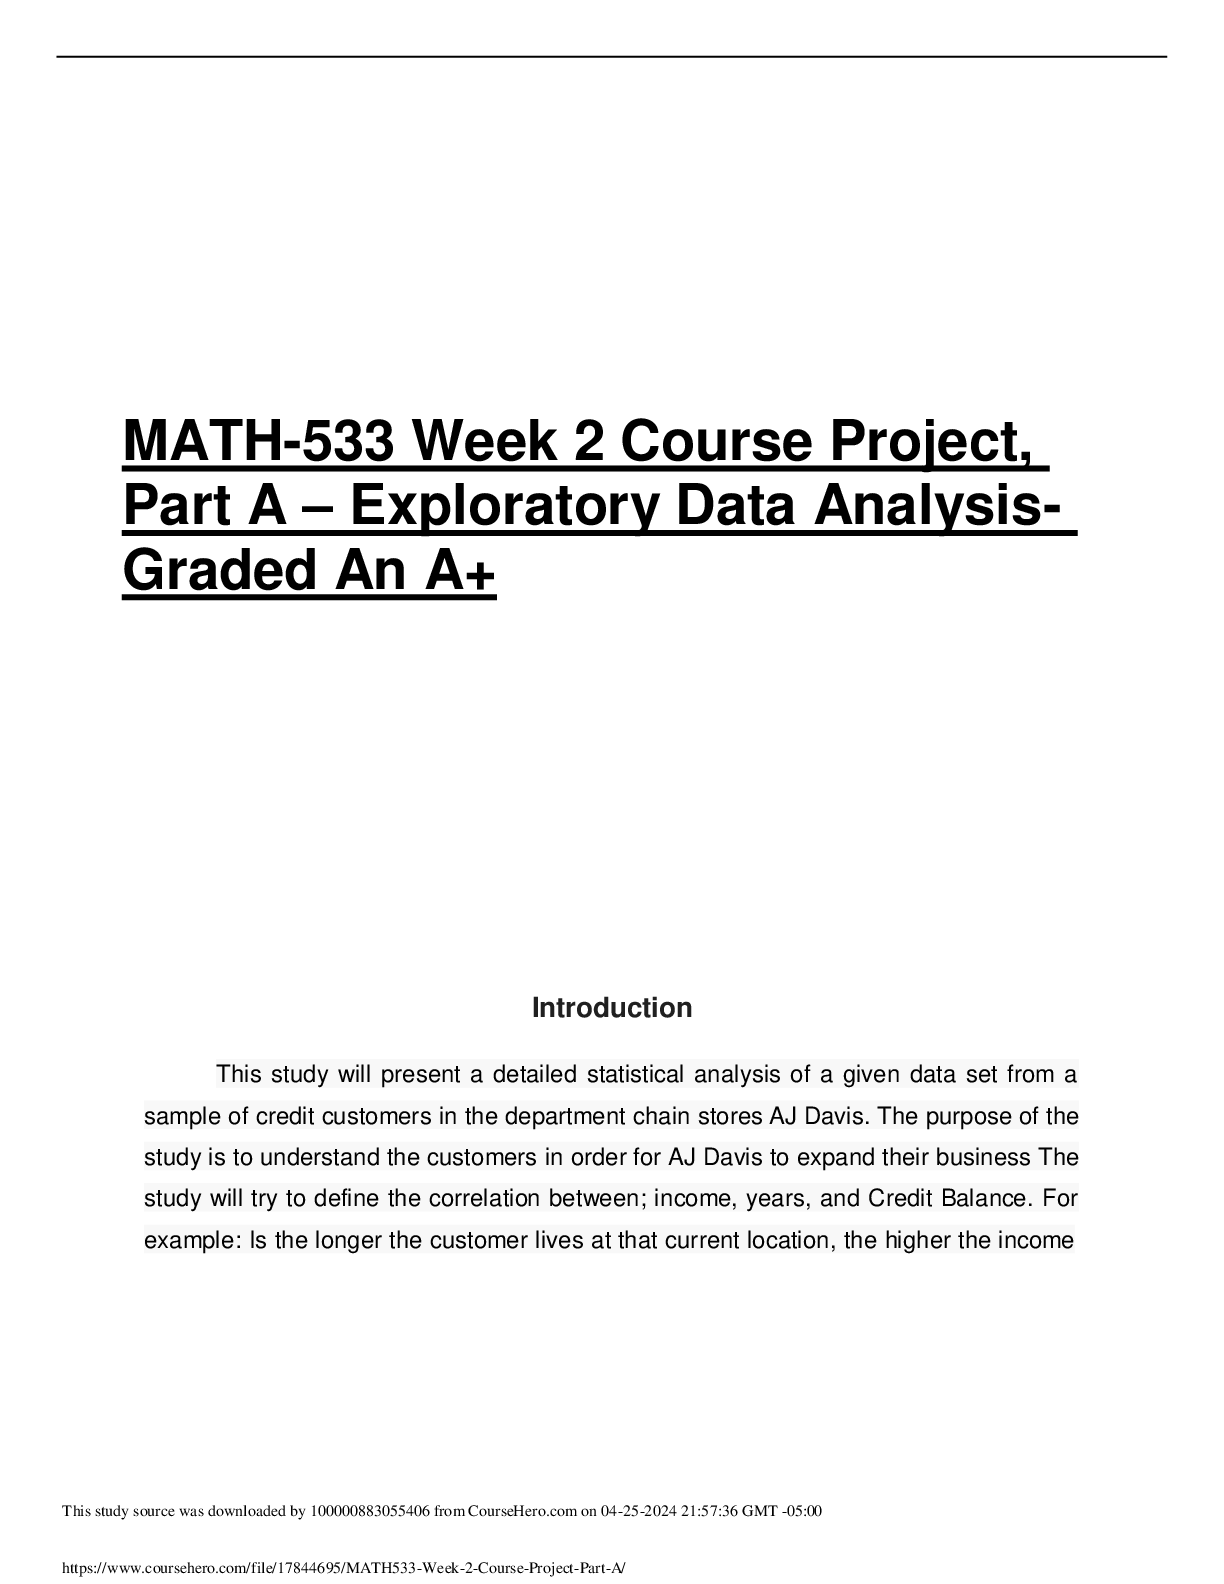
MATH-533 Week 2 Course Project, Part A – Exploratory Data Anal...
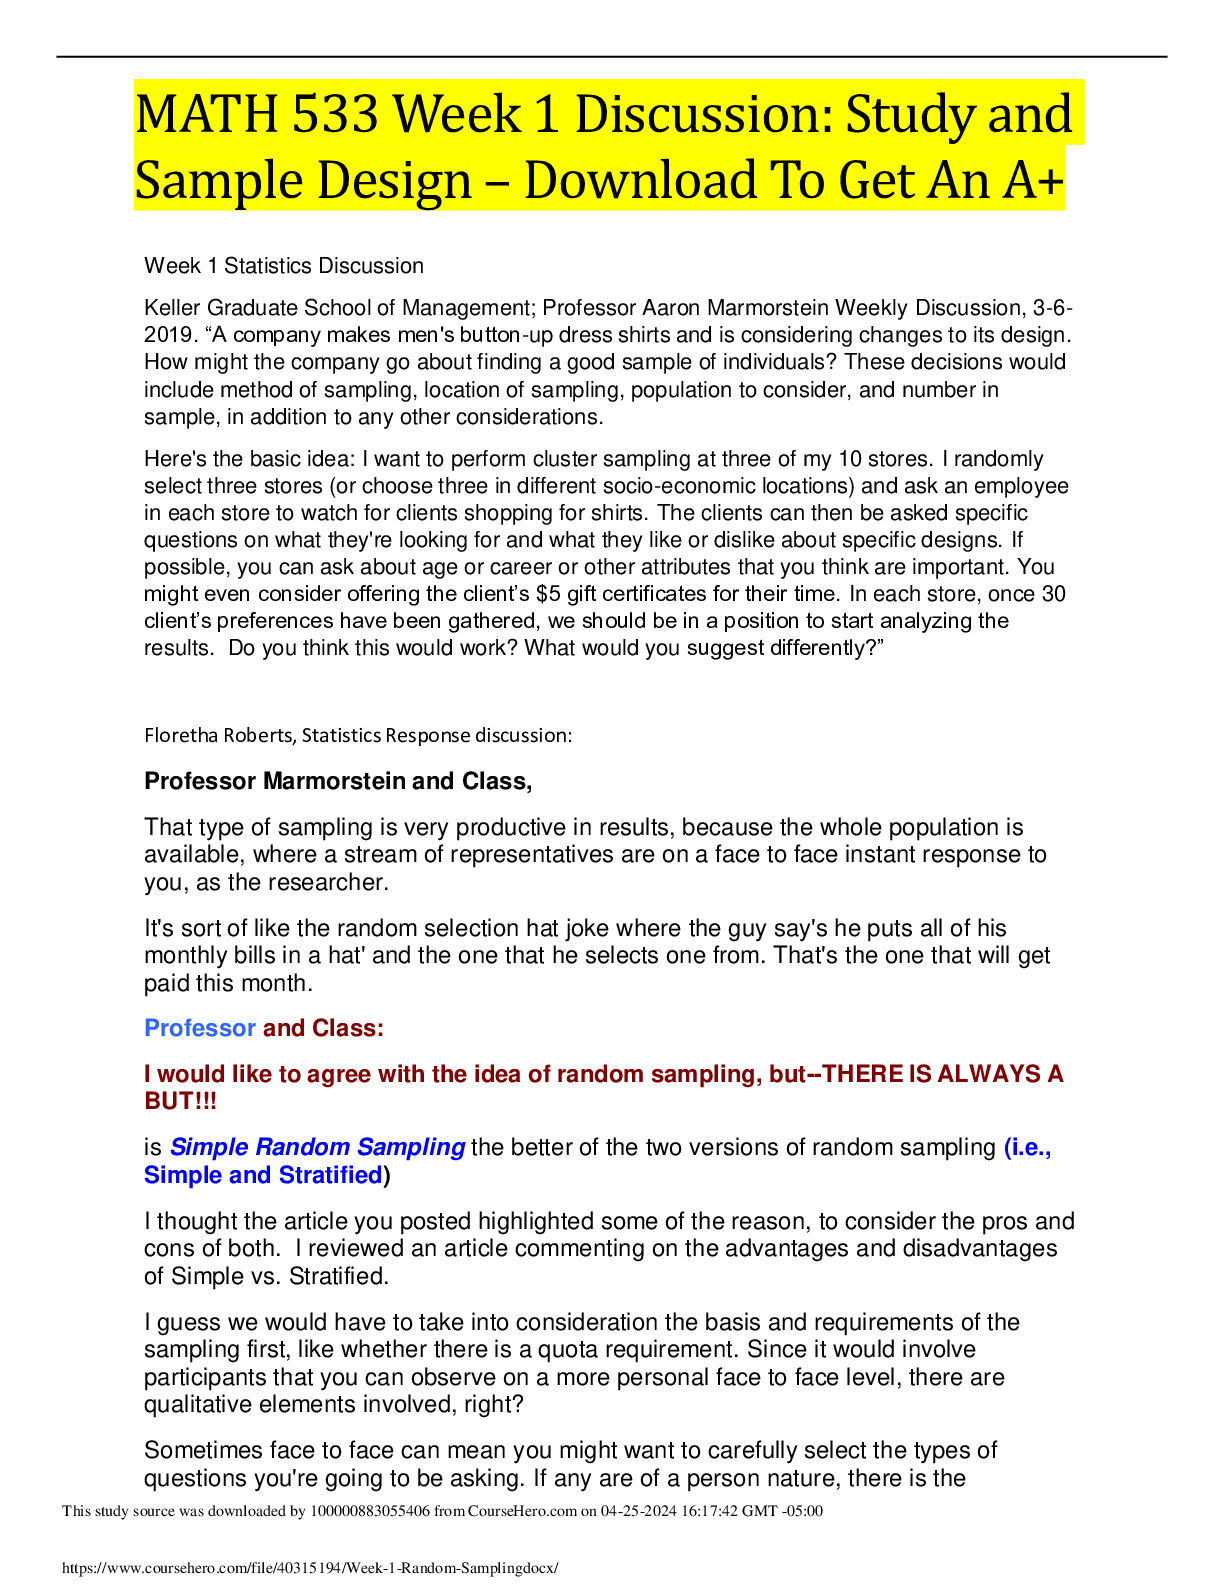
MATH 533 Week 1 Discussion: Study and Sample Design – Download...
Discrete Mathematics and Its Applications 8th Edition by Kenne...