Statistics > QUESTIONS & ANSWERS > Grand Canyon University - HLT 362V HLTV Week 2 Exercise 10 & 26 (All)
Grand Canyon University - HLT 362V HLTV Week 2 Exercise 10 & 26
Document Content and Description Below
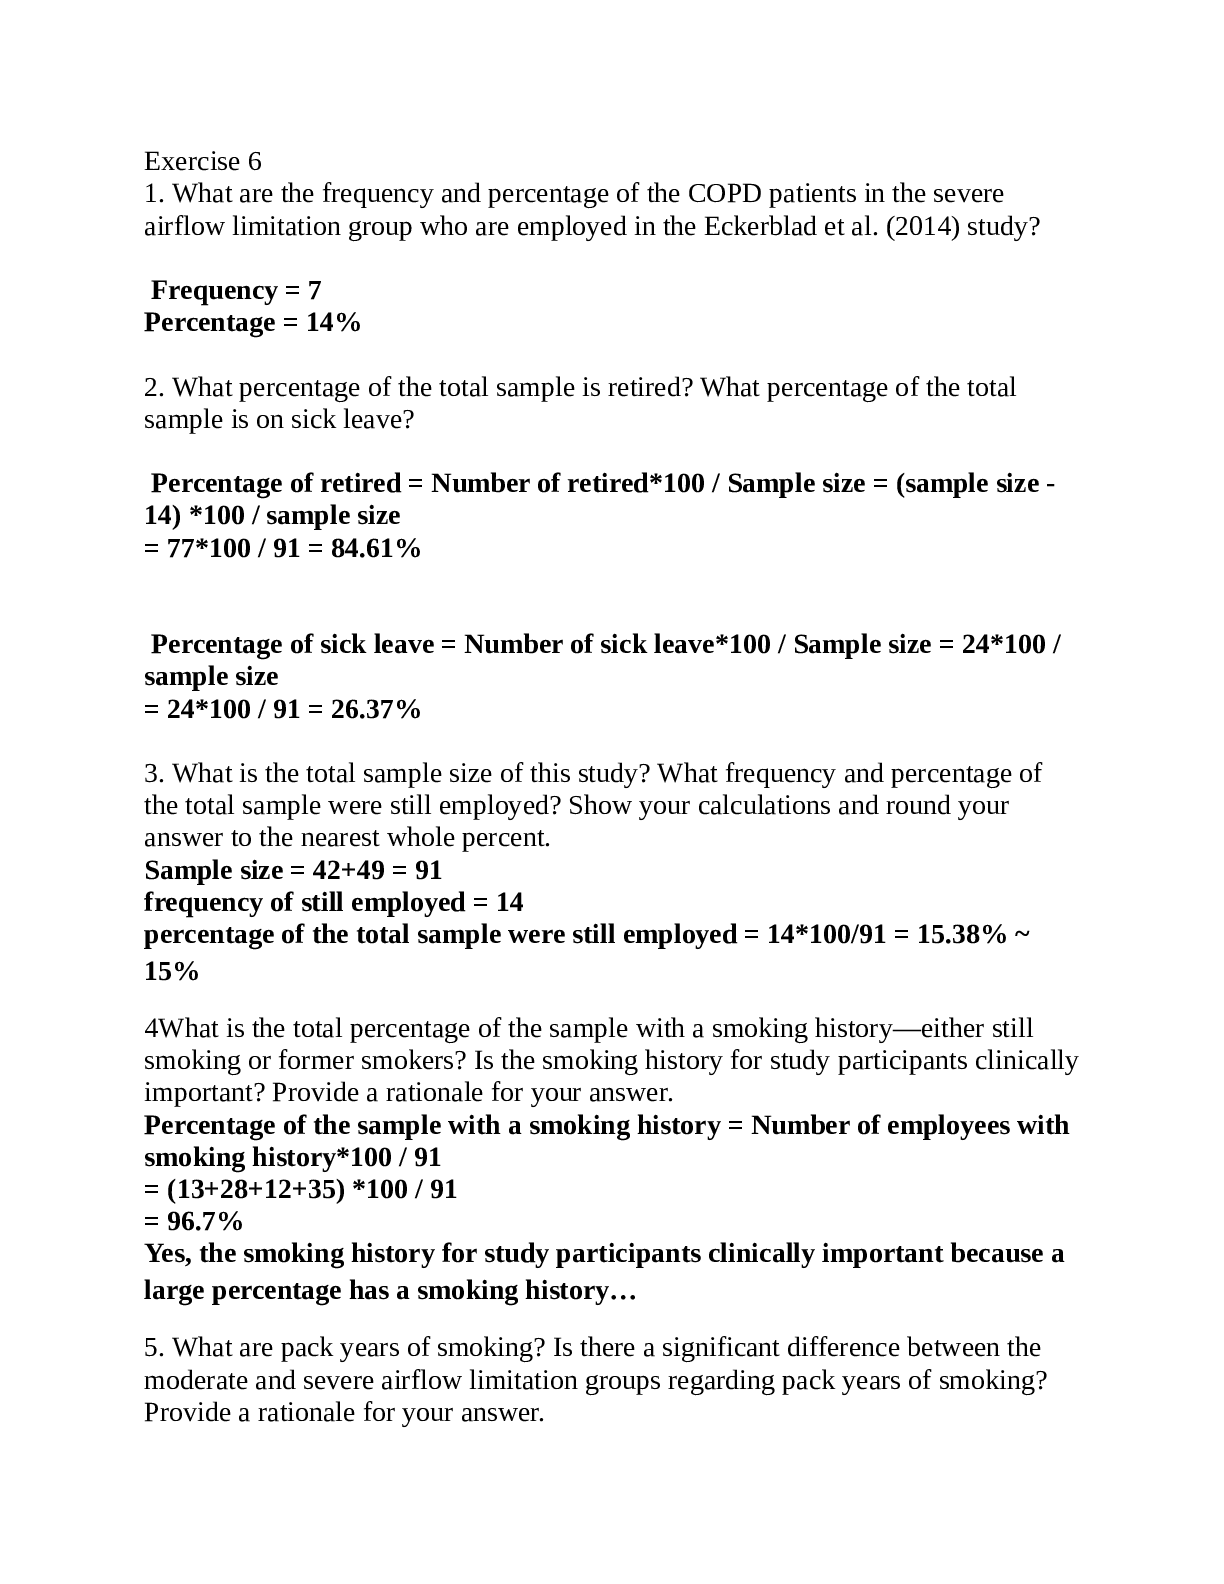
Exercise 10 1. What demographic variables were measured at the nominal level of measurement in the Oh et al. (2014) study? Provide a rationale for your answer. Nominal data is data that is in the f... orm of a name, list, or piece of information that is not a number. This can be a yes/no question for example, or gender. The nominal demographic variables measured were: History of fracture; Regular exercise; Non-drinker; and Non-smoker. Additionally, bone mineral density was measured and nominally categorized as normal, osteopenia, or osteoporosis. 2. What statistics were calculated to describe body mass index (BMI) in this study? Were these appropriate? Provide a rationale for your answer. BMI is calculated from height and weight. The formula is weight in kilograms, divided by height in meters squared. The measurement data of height and weight in this study is in centimeters and kilograms. Centimeters can easily be converted to meters and the formula applied to find BMI. It was appropriately used in this study, and there were no significant differences in BMI between intervention and control. 3. Were the distributions of scores for BMI similar for the intervention and control groups? Provide a rationale for your answer. The distribution of scores for BMI are similar for intervention and control. The intervention group had a mean BMI of 24.17 (SD = 2.5), and the control group had a mean BMI of 23.38 (SD = 3.32) The standard deviation shows significant overlap between the two means, and the t score of chi squared score show no significant difference less than p < 0.05. If you were to calculate the p value it would be 0.485. 4. Was there a significant difference in BMI between the intervention and control groups? Provide a rationale for your answer. There was no significant difference between intervention and control groups. The last sentence of the study states, “there were no differences in the baseline characteristics of the groups”. Additionally if you take the t-score from table two and calculate with 40 degrees of freedom (because DF = N-1), the p value is 0.485. 5. Based on the sample size of N = 41, what frequency and percentage of the sample smoked? What frequency and percentage of the sample were non-drinkers (alcohol)? Show your calculations and round to the nearest whole percent. With a sample size of 41, and based on adding the number of participants from Table 2 in each category, there were 40 non-drinkers, so 40/41 = 98% of the [Show More]
Last updated: 2 years ago
Preview 1 out of 7 pages

Buy this document to get the full access instantly
Instant Download Access after purchase
Buy NowInstant download
We Accept:

Reviews( 0 )
$12.00
Can't find what you want? Try our AI powered Search
Document information
Connected school, study & course
About the document
Uploaded On
Feb 28, 2022
Number of pages
7
Written in

Additional information
This document has been written for:
Uploaded
Feb 28, 2022
Downloads
0
Views
37


.png)