Biology > QUESTIONS & ANSWERS > ASM 275 / ASM275 UNIT 1 LAB QUESTIONS AND ANSWERS Unit 1 - 2 (All)
ASM 275 / ASM275 UNIT 1 LAB QUESTIONS AND ANSWERS Unit 1 - 2
Document Content and Description Below
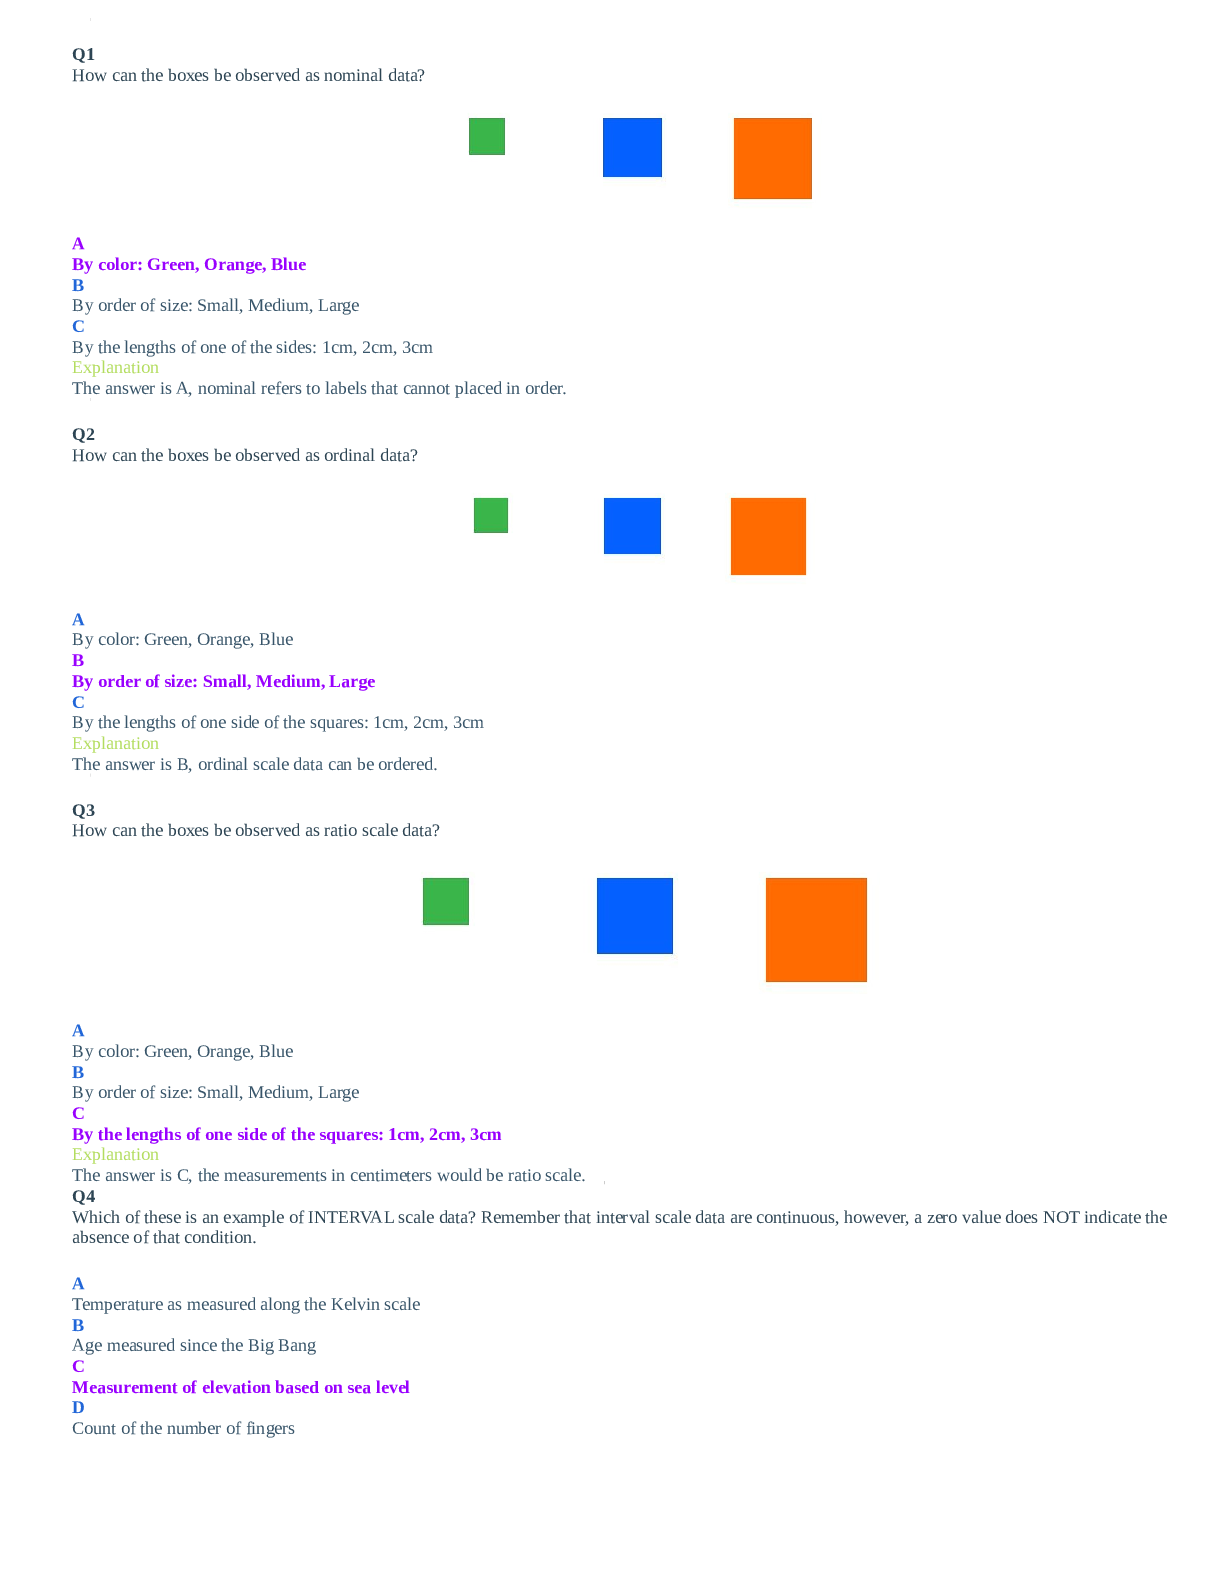
Q1 How can the boxes be observed as nominal data? A By color: Green, Orange, Blue B By order of size: Small, Medium, Large C By the lengths of one of the sides: 1cm, 2cm, 3cm Explanation The ... answer is A, nominal refers to labels that cannot placed in order. Q2 How can the boxes be observed as ordinal data? A By color: Green, Orange, Blue B By order of size: Small, Medium, Large C By the lengths of one side of the squares: 1cm, 2cm, 3cm Explanation The answer is B, ordinal scale data can be ordered. Q3 How can the boxes be observed as ratio scale data? A By color: Green, Orange, Blue B By order of size: Small, Medium, Large C By the lengths of one side of the squares: 1cm, 2cm, 3cm Explanation The answer is C, the measurements in centimeters would be ratio scale. Q4 Which of these is an example of INTERVAL scale data? Remember that interval scale data are continuous, however, a zero value does NOT indicate the absence of that condition. A Temperature as measured along the Kelvin scale B Age measured since the Big Bang C Measurement of elevation based on sea level D Count of the number of fingers Explanation A sea level of 0 does not mean a lack of elevation or altitude (you are closer to the sun than the ocean bottom). And you can have negative measures of altitude based on sea level if you are under the ocean. Therefore, measurements of altitude or elevation based on sea level have an arbitrary 0 point and are interval in scale. Q5 Consider the differences between the male and female pelvis as shown here. For a series of pelves (plural of pelvis) we would assign each to a category of 'male' or 'female'. How would the data (Male, Female) be categorized? [10] A Nominal B Ordinal C Interval D Ratio Explanation The answer is A. ‘Male’ and ‘Female’ are qualitative descriptions that cannot be placed in order or ranked along a scale. Q6 What types of data are being generated in this image? Note the caliper read out is in millimeters. [11] A Nominal B Ordinal C Interval D Ratio Explanation The answer is D. These measurements are quantitative descriptions of data that can be placed in an order and ranked along a scale that has a 0 value. Q7 The table on the left side is how we would record information on variation in mastoid size. What type of data is being depicted in this table? [Show More]
Last updated: 2 years ago
Preview 1 out of 26 pages
Buy this document to get the full access instantly
Instant Download Access after purchase
Buy NowInstant download
We Accept:


Reviews( 0 )
$13.00
Can't find what you want? Try our AI powered Search
Document information
Connected school, study & course
About the document
Uploaded On
Mar 12, 2022
Number of pages
26
Written in

Additional information
This document has been written for:
Uploaded
Mar 12, 2022
Downloads
0
Views
141
.png)


.png)
