Statistics > QUESTIONS & ANSWERS > Week 7 Assignment Hypothesis Test for the mean Q and A Latest 2022 Already Passed 100% Correct (All)
Week 7 Assignment Hypothesis Test for the mean Q and A Latest 2022 Already Passed 100% Correct
Document Content and Description Below
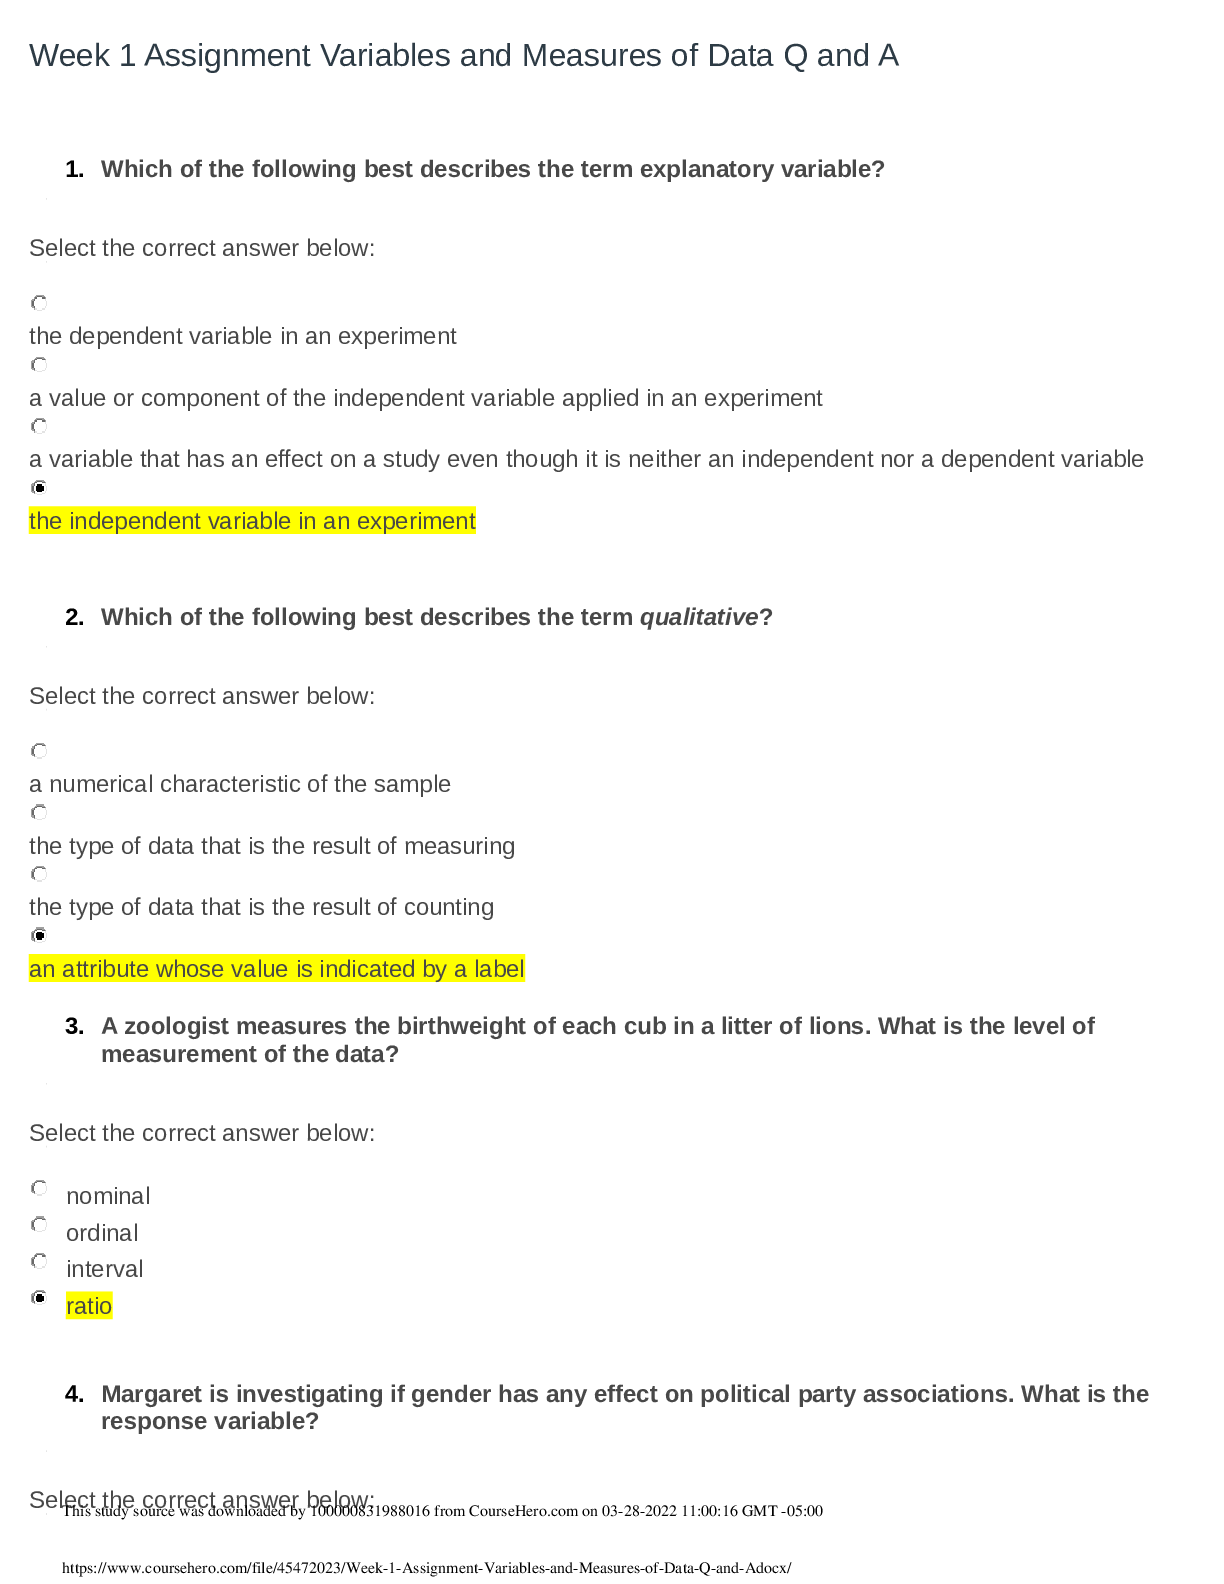
Week 7 Assignment Hypothesis Test for the mean-Polution Standard Deviation known Compute the value of the test statistic (z-value) for a hypothesis test for one population mean with a known standard ... deviation Question Jamie, a bowler, claims that her bowling score is less than 168 points, on average. Several of her teammates do not believe her, so she decides to do a hypothesis test, at a 1% significance level, to persuade them. She bowls 17 games. The mean score of the sample games is 155 points. Jamie knows from experience that the standard deviation for her bowling score is 19 points. H0: μ≥168; Ha: μ<168 α=0.01 (significance level) What is the test statistic (z-score) of this one-mean hypothesis test, rounded to two decimal places? Provide your answer: Test statistic = -2.82 Correct answers: Test statistic = −2.82 The hypotheses were chosen, and the significance level was decided on, so the next step in hypothesis testing is to compute the test statistic. In this scenario, the sample mean score, x¯=155. The sample the bowler uses is 17 games, so n=17. She knows the standard deviation of the games, σ=19. Lastly, the bowler is comparing the population mean score to 168points. So, this value (found in the null and alternative hypotheses) is μ0. Now we will substitute the values into the formula to compute the test statistic: z0=x¯−μ0σn√=155−1681917√≈−134.608≈−2.82 So, the test statistic for this hypothesis test is z0=−2.82. Distinguish between one- and two-tailed hypotheses tests and understand possible conclusions Question Which graph below corresponds to the following hypothesis test? H0:μ≥5.9, Ha:μ<5.9 Answer Explanation Correct answer: A normal curve is over a horizontal axis and is centered on 5.9. A vertical line segment extends from the horizontal axis to the curve at a point to the left of 5.9. The area under the curve to the left of the point is shaded. The alternative hypothesis, Ha, tells us which area of the graph we are interested in. Because the alternative hypothesis is μ<5.9, we are interested in the region less than (to the left of) 5.9, so the correct graph is the first answer choice. Your answer: wrong Identify the null and alternative hypotheses Question A politician claims that at least 68% of voters support a decrease in taxes. A group of researchers are trying to show that this is not the case. Identify the researchers' null hypothesis, H0, and the alternative hypothesis, Ha, in terms of the parameter p. Select the correct answer below: H0: p≤0.68; Ha: p>0.68 H0: p<0.68; Ha: p≥0.68 H0: p>0.68; Ha: p≤0.68 H0: p≥0.68; Ha: p<0.68 Perform and interpret a hypothesis test for a proportion using Technology - Excel Question Steve listens to his favorite streaming music service when he works out. He wonders whether the service's algorithm does a good job of finding random songs that he will like more often than not. To test this, he listens to 50 songs chosen by the service at random and finds that he likes 32 of them. Use Excel to test whether Steve will like a randomly selected song more often than not, and then draw a conclusion in the context of the problem. Use α=0.05. Select the correct answer below: Reject the null hypothesis. There is sufficient evidence to conclude that Steve will like a randomly selected song more often than not. Reject the null hypothesis. There is insufficient evidence to conclude that Steve will like a randomly selected song more often than not. Fail to reject the null hypothesis. There is sufficient evidence to conclude that Steve will like a randomly selected song more often than not. Fail to reject the null hypothesis. There is insufficient evidence to conclude that Steve will like a randomly selected song more often than not. Great work! That's correct. Correct answer: Reject the null hypothesis. There is sufficient evidence to conclude that Steve will like a randomly selected song more often than not. Step 1: The sample proportion is pˆ=3250=0.64, the hypothesized proportion is p0=0.5, and the sample size is n=50. Step 2: The test statistic, rounding to two decimal places, is z=0.64−0.50.5(1−0.5)50‾‾‾‾‾‾‾‾‾‾‾‾√≈1.98. Step 3: Since the test is right-tailed, entering the function =1−Norm.S.Dist(1.98,1) into Excel returns a p-value, rounding to three decimal places, of 0.024. Step 4: Since the p-value is less than α=0.05, reject the null hypothesis. There is sufficient evidence to conclude that Steve will like a randomly selected song more often than not. Null and alternative hypothesis: H0: p = 0.5 Ha: p >= 0.5 Level of Significance =0.05 Proportion under H0 = 0.5 n = 50 Number of Successes=32 Sample Proportion 0.64000 StDev 0.50000 SE 0.070711 Test Statistic (z) 1.979899 One-Sided p-value 0.023852 Two-Sided p-value 0.047704 P value = 0.02 < alpha (0.05) Hence, reject the null hypo [Show More]
Last updated: 3 years ago
Preview 1 out of 19 pages

Buy this document to get the full access instantly
Instant Download Access after purchase
Buy NowInstant download
We Accept:

Also available in bundle (1)
Click Below to Access Bundle(s)
Chamberlain College of Nursing Weeks 1-8 Assignment Homework Help Q and A Latest Updated and Rated A
Questions 1. Assume that 80 houses are present in the form of a grid consisting of 10 columns and 8 rows. If a loud speaker is placed just before the first row, which sampling method works the best...
By Nutmegs 3 years ago
$40
8
Reviews( 0 )
$13.00
Can't find what you want? Try our AI powered Search
Document information
Connected school, study & course
About the document
Uploaded On
Mar 28, 2022
Number of pages
19
Written in
All

Additional information
This document has been written for:
Uploaded
Mar 28, 2022
Downloads
0
Views
143


.png)