Week 7 Assignment Hypothesis Test for the mean-Pollution Standard Deviation known
Compute the value of the test statistic (z-value) for a hypothesis test for one population mean with a known standard deviation
Question
...
Week 7 Assignment Hypothesis Test for the mean-Pollution Standard Deviation known
Compute the value of the test statistic (z-value) for a hypothesis test for one population mean with a known standard deviation
Question
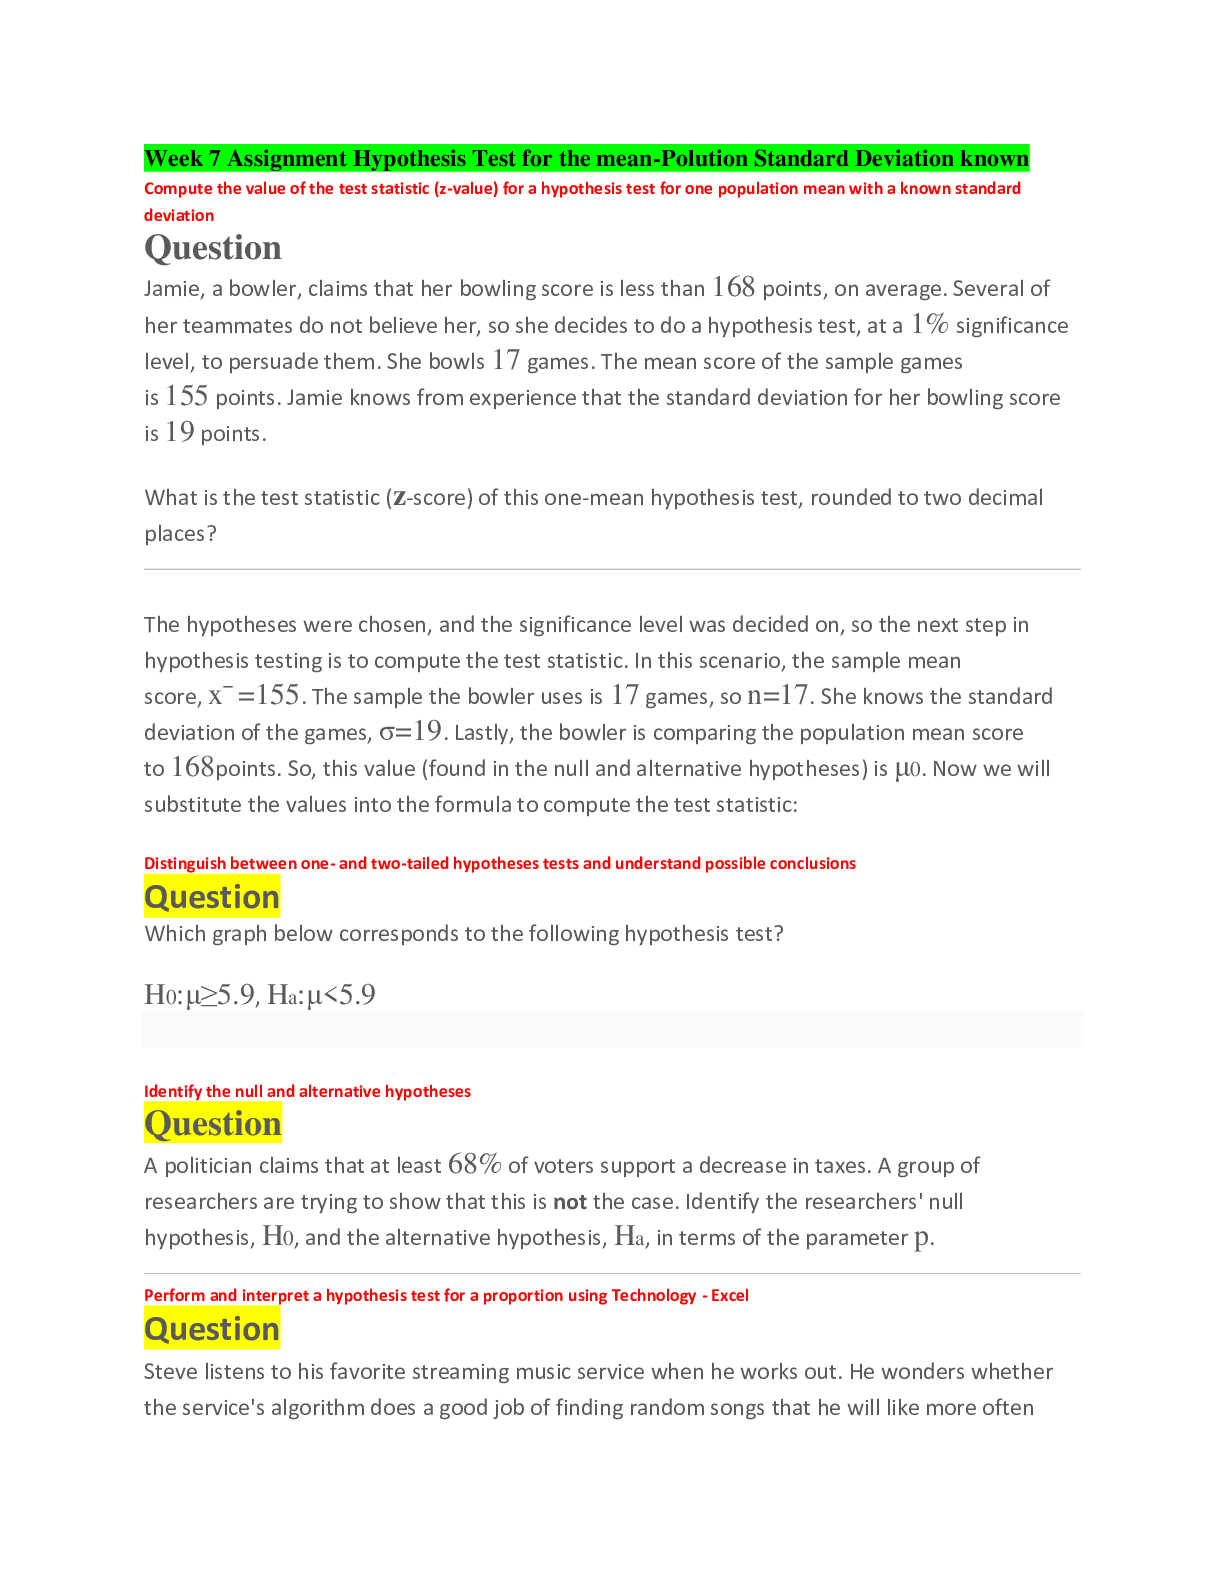
Jamie, a bowler, claims that her bowling score is less than 168 points, on average. Several of her teammates do not believe her, so she decides to do a hypothesis test, at a 1% significance level, to persuade them. She bowls 17 games. The mean score of the sample games is 155 points. Jamie knows from experience that the standard deviation for her bowling score is 19 points.
What is the test statistic (z-score) of this one-mean hypothesis test, rounded to two decimal places?
________________________________________
The hypotheses were chosen, and the significance level was decided on, so the next step in hypothesis testing is to compute the test statistic. In this scenario, the sample mean score, x¯=155. The sample the bowler uses is 17 games, so n=17. She knows the standard deviation of the games, σ=19. Lastly, the bowler is comparing the population mean score to 168points. So, this value (found in the null and alternative hypotheses) is μ0. Now we will substitute the values into the formula to compute the test statistic:
Distinguish between one- and two-tailed hypotheses tests and understand possible conclusions
Question
Which graph below corresponds to the following hypothesis test?
H0:μ≥5.9, Ha:μ<5.9
Identify the null and alternative hypotheses
Question
A politician claims that at least 68% of voters support a decrease in taxes. A group of researchers are trying to show that this is not the case. Identify the researchers' null hypothesis, H0, and the alternative hypothesis, Ha, in terms of the parameter p.
________________________________________
Perform and interpret a hypothesis test for a proportion using Technology - Excel
Question
Steve listens to his favorite streaming music service when he works out. He wonders whether the service's algorithm does a good job of finding random songs that he will like more often than not. To test this, he listens to 50 songs chosen by the service at random and finds that he likes 32 of them.
Use Excel to test whether Steve will like a randomly selected song more often than not, and then draw a conclusion in the context of the problem. Use α=0.05.
________________________________________
Select the correct answer below:
________________________________________
Reject the null hypothesis. There is sufficient evidence to conclude that Steve will like a randomly selected song more often than not.
Reject the null hypothesis. There is insufficient evidence to conclude that Steve will like a randomly selected song more often than not.
Fail to reject the null hypothesis. There is sufficient evidence to conclude that Steve will like a randomly selected song more often than not.
Fail to reject the null hypothesis. There is insufficient evidence to conclude that Steve will like a randomly selected song more often than not.
Perform and interpret a hypothesis test for a proportion using Technology - Excel
Question
A magazine regularly tested products and gave the reviews to its customers. In one of its reviews, it tested two types of batteries and claimed that the batteries from Company A outperformed the batteries from Company B. A representative from Company B asked for the exact data from the study. The author of the article told the representative from Company B that in 200 tests, a battery from Company A outperformed a battery from Company B in 108 of the tests. Company B decided to sue the magazine, claiming that the results were not significantly different from 50% and that the magazine was slandering its good name.
Use Excel to test whether the true proportion of times that Company A's batteries outperformed Company B's batteries is different from 0.5. Identify the p-value, rounding to three decimal places.
________________________________________
Perform and interpret a hypothesis test for a proportion using Technology - Excel
Question
A candidate in an election lost by 5.8% of the vote. The candidate sued the state and said that more than 5.8% of the ballots were defective and not counted by the voting machine, so a full recount would need to be done. His opponent wanted to ask for the case to be dismissed, so she had a government official from the state randomly select 500 ballots and count how many were defective. The official found 45 defective ballots.
Use Excel to test if the candidate's claim is true and that more than 5.8% of the ballots were defective. Identify the p-value, rounding to three decimal places.
Perform and interpret a hypothesis test for a proportion using Technology - Excel
Question
Dmitry suspected that his friend is using a weighted die for board games. To test his theory, he wants to see whether the proportion of odd numbers is different from 50%. He rolled the die 40 times and got an odd number 14 times.
Dmitry conducts a one-proportion hypothesis test at the 5% significance level, to test whether the true proportion of odds is different from 50%.
(a) Which answer choice shows the correct null and alternative hypotheses for this test?
________________________________________
Select the correct answer below:
________________________________________
H0:p=0.35; Ha:p>0.35, which is a right-tailed test.
H0:p=0.5; Ha:p<0.5, which is a left-tailed test.
H0:p=0.35; Ha:p≠0.35, which is a two-tailed test.
H0:p=0.5; Ha:p≠0.5, which is a two-tailed test.
5. Dmitry wants to know if the true proportion is different from 0.5. This means that we just want to test if the proportion is not 0.5. So, the alternative hypothesis is Ha:p≠0.5, which is a two-tailed test.
PART 2
Perform and interpret a hypothesis test for a proportion using Technology - Excel
Question
Dmitry suspects that his friend is using a weighted die for board games. To test his theory, he wants to see whether the proportion of odd numbers is different from 50%. He rolled the die 40 times and got an odd number 14 times.
Dmitry conducts a one-proportion hypothesis test at the 5% significance level, to test whether the true proportion of odds is different from 50%.
(a) H0:p=0.5; Ha:p≠0.5, which is a two-tailed test.
(b) Use Excel to test whether the true proportion of odds is different from 50%. Identify the test statistic, z, and p-value from the Excel output, rounding to three decimal places.
Perform and interpret a hypothesis test for a proportion using Technology - Excel
Question
Dmitry suspects that his friend is using a weighted die for board games. To test his theory, he wants to see whether the proportion of odd numbers is different from 50%. He rolled the die 40 times and got an odd number 14 times.
Dmitry conducts a one-proportion hypothesis test at the 5% significance level, to test whether the true proportion of odds is different from 50%.
Question
A politician claims that at least 68% of voters support a decrease in taxes. A group of researchers are trying to show that this is not the case. Identify the researchers' null hypothesis, H0, and the alternative hypothesis, Ha, in terms of the parameter p.
________________________________________
Select the correct answer below:
________________________________________
H0: p≤0.68; Ha: p>0.68
H0: p<0.68; Ha: p≥0.68
H0: p>0.68; Ha: p≤0.68
H0: p≥0.68; Ha: p<0.68
4-H0: p≥0.68; Ha: p<0.68
Question
Determine the Type II error if the null hypothesis, H0, is: a wooden ladder can withstand weights of 250pounds and less.
________________________________________
Select the correct answer below:
________________________________________
You think the ladder can withstand weight of 250 pounds and less when, in fact, it cannot.
You think the ladder cannot withstand weight of 250 pounds and less when, in fact, it really can.
You think the ladder can withstand weight of 250 pounds and less when, in fact, it can.
You think the ladder cannot withstand weight of 250 pounds and less when, in fact, it cannot.
Question
Determine the Type I error if the null hypothesis, H0, is: an electrician claims that no more than 10% of homes in the city are not up to the current electric codes.
________________________________________
Select the correct answer below:
________________________________________
The electrician thinks that no more than 10% of homes in the city are not up to the current electrical codes when, in fact, there really are no more than 10% that are not up to the current electric codes.
The electrician thinks that more than 10% of the homes in the city are not up to the current electrical codes when, in fact, there really are more than 10% of the homes that do not meet the current electric codes.
The electrician thinks that more than 10% of the homes in the city are not up to the current electrical codes when, in fact, at most 10% of the homes in the city are not up to the current electric codes.
Question
Which of the following results in a null hypothesis μ≤7 and alternative hypothesis μ>7?
________________________________________
Select the correct answer below:
________________________________________
A study wants to show that the mean number of hours of sleep the average person gets each day is at least 7.
A study wants to show that the mean number of hours of sleep the average person gets each day is 7.
A study wants to show that the mean number of hours of sleep the average person gets each day is more than 7.
Question
Identify the type of hypothesis test below.
H0:X≥17.9, Ha:X<17.9
________________________________________
Select the correct answer below:
________________________________________
The hypothesis test is two-tailed.
The hypothesis test is left-tailed.
The hypothesis test is right-tailed.
Question
Annie, a long jumper, claims that her jump distance is not equal to 19 feet, on average. Several of her teammates do not believe her, so she decides to do a hypothesis test, at a 10% significance level, to persuade them. She makes 24 jumps. The mean distance of the sample jumps is 19.5 feet. Annie knows from experience that the standard deviation for her jump distance is 1.2 feet.
• H0: μ=19; Ha: μ≠19
• α=0.1 (significance level)
What is the test statistic (z-score) of this one-mean hypothesis test, rounded to two decimal places?
________________________________________
Question
A college administrator claims that the proportion of students that are nursing majors is greater than 40%. To test this claim, a group of 400 students are randomly selected and its determined that 190 are nursing majors. The following is the setup for this hypothesis test:
H0:p=0.40
Ha:p>0.40
Find the p-value for this hypothesis test for a proportion and round your answer to 3 decimal places.
The following table can be utilized which provides areas under the Standard Normal Curve:
z 0.00 0.01 0.02 0.03 0.04 0.05 0.06 0.07 0.08 0.09
2.6 0.995 0.995 0.996 0.996 0.996 0.996 0.996 0.996 0.996 0.996
2.7 0.997 0.997 0.997 0.997 0.997 0.997 0.997 0.997 0.997 0.997
2.8 0.997 0.998 0.998 0.998 0.998 0.998 0.998 0.998 0.998 0.998
2.9 0.998 0.998 0.998 0.998 0.998 0.998 0.998 0.999 0.999 0.999
3.0 0.999 0.999 0.999 0.999 0.999 0.999 0.999 0.999 0.999 0.999
3.1 0.999 0.999 0.999 0.999 0.999 0.999 0.999 0.999 0.999 0.999
Question
Suppose the null hypothesis, H0, is: a sporting goods store claims that at least 70% of its customers do not shop at any other sporting goods stores. What is the Type I error in this scenario? The sporting goods store thinks that less than 70% of its customers do not shop at any other sporting goods stores when, in fact, at least 70% of its customers do not shop at any other sporting goods stores. A Type I error is the decision to reject the null hypothesis when it is true. In this case, the Type I error is when the store thinks that less than 70% of its customers only shop at their sporting goods store when, in fact, it is at least 70%.
________________________________________
Perfect. Your hard work is paying off ?
________________________________________
Differentiate between Type I and Type II errors when performing a hypothesis test
Question
Determine the Type II error if the null hypothesis, H0, is: researchers claim that 65% of college students will graduate with debt.
Question
Which of the following results in a null hypothesis p≥0.44 and alternative hypothesis p<0.44?
Question
A city wants to show that the mean number of public transportation users per day is more than 5,575. Identify the null hypothesis, H0, and the alternative hypothesis, Ha, in terms of the parameter μ.
Correct answer:
H0: μ≤5,575; Ha: μ>5,575
Let the parameter μ be used to represent the mean.
Remember that the null hypothesis is the statement already believed to be true, and the alternative hypothesis is the statement trying to be shown. In this case, the city is trying to show that μ>5,575, so this is the alternative hypothesis. The null hypothesis is the opposite of this: μ≤5,575.
Also, remember that the null hypothesis is always stated with some form of equality: equal (=), greater than or equal to (≥), or less than or equal to (≤). So we can double check that this matches our answer above.
Differentiate between Type I and Type II errors when performing a hypothesis test
Question
Determine the Type I error if the null hypothesis, H0, is: researchers claim that 65% of college students will graduate with debt. Correct answer:
Question
Suppose the null hypothesis, H0, is: a sporting goods store claims that at least 70% of its customers do not shop at any other sporting goods stores. What is β, the probability of a Type II error in this scenario?
Perfect. Your hard work is paying off ? Correct answer:
the probability that the sporting goods store thinks that at least 70% of its customers do not shop at any other sporting goods stores when, in fact, less than 70% of its customers do not shop at any other sporting goods stores
Question
Find the graph that matches the following hypothesis test.
H0:X≥6.4, Ha:X<6.4
Which graph below corresponds to the following hypothesis test?
Question
Which graph below corresponds to the following hypothesis test?
Question
Lexie, a bowler, claims that her bowling score is more than 140 points, on average. Several of her teammates do not believe her, so she decides to do a hypothesis test, at a 5% significance level, to persuade them. She bowls 18 games. The mean score of the sample games is 155 points. Lexie knows from experience that the standard deviation for her bowling score is 17 points.
• H0: μ≤140; Ha: μ>140
• α=0.05 (significance level)
What is the test statistic (z-score) of this one-mean hypothesis test, rounded to two decimal places?
________________________________________
Question
Suppose a pitcher claims that her pitch speed is not equal to 45 miles per hour, on average. Several of her teammates do not believe her, so the pitcher decides to do a hypothesis test, at a 1% significance level, to persuade them. She throws 21 pitches. The mean speed of the sample pitches is 46 miles per hour. The pitcher knows from experience that the standard deviation for her pitch speed is 6 miles per hour.
[Show More]
