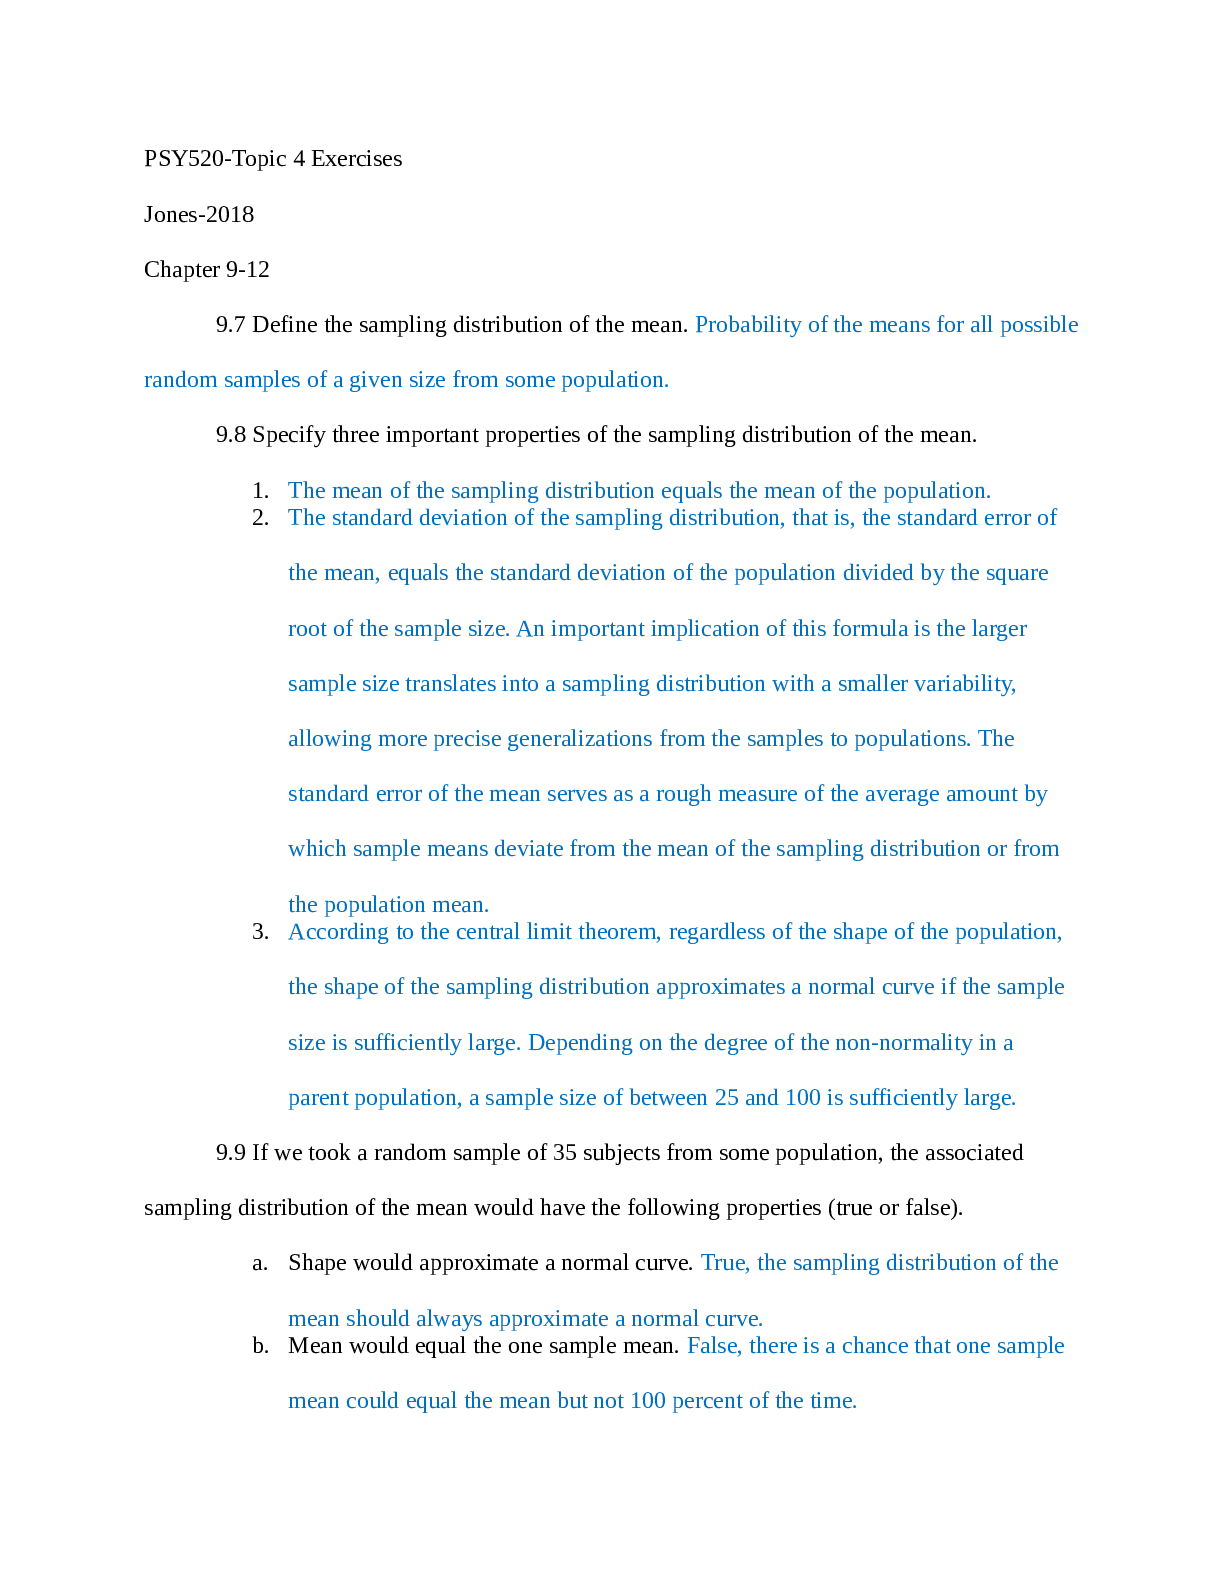
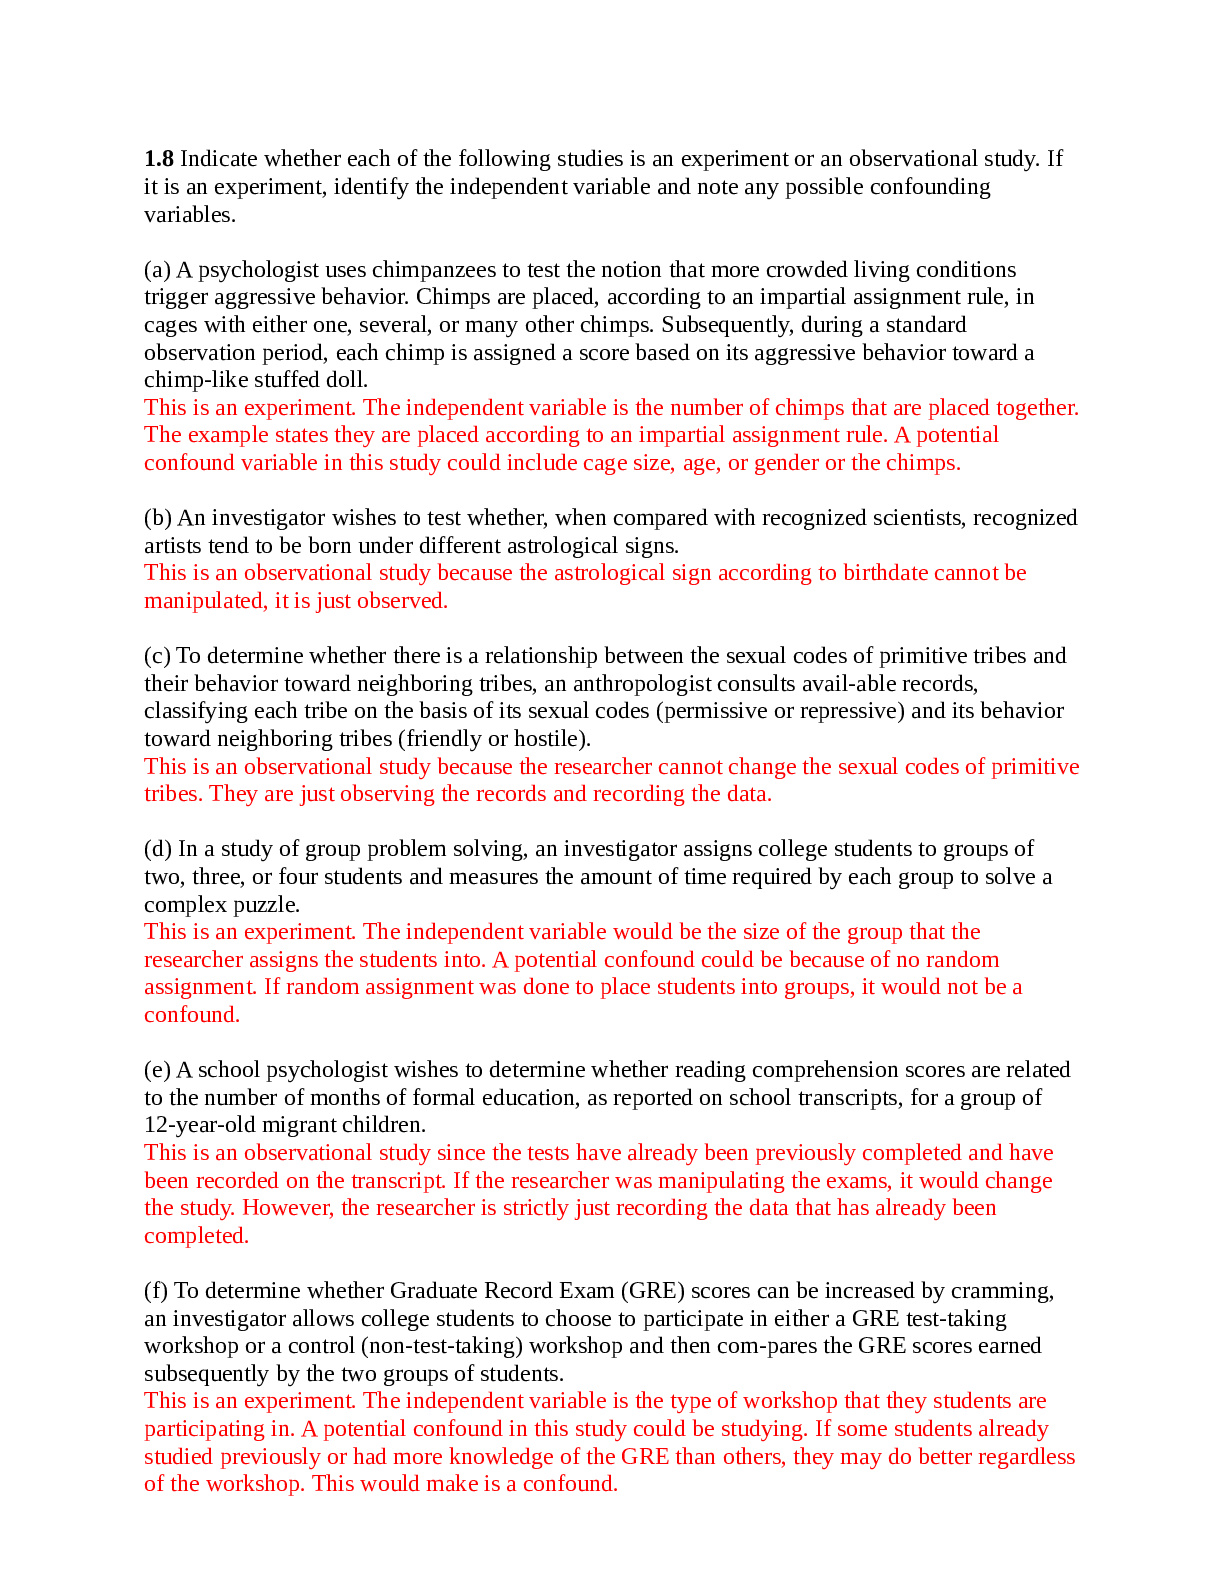
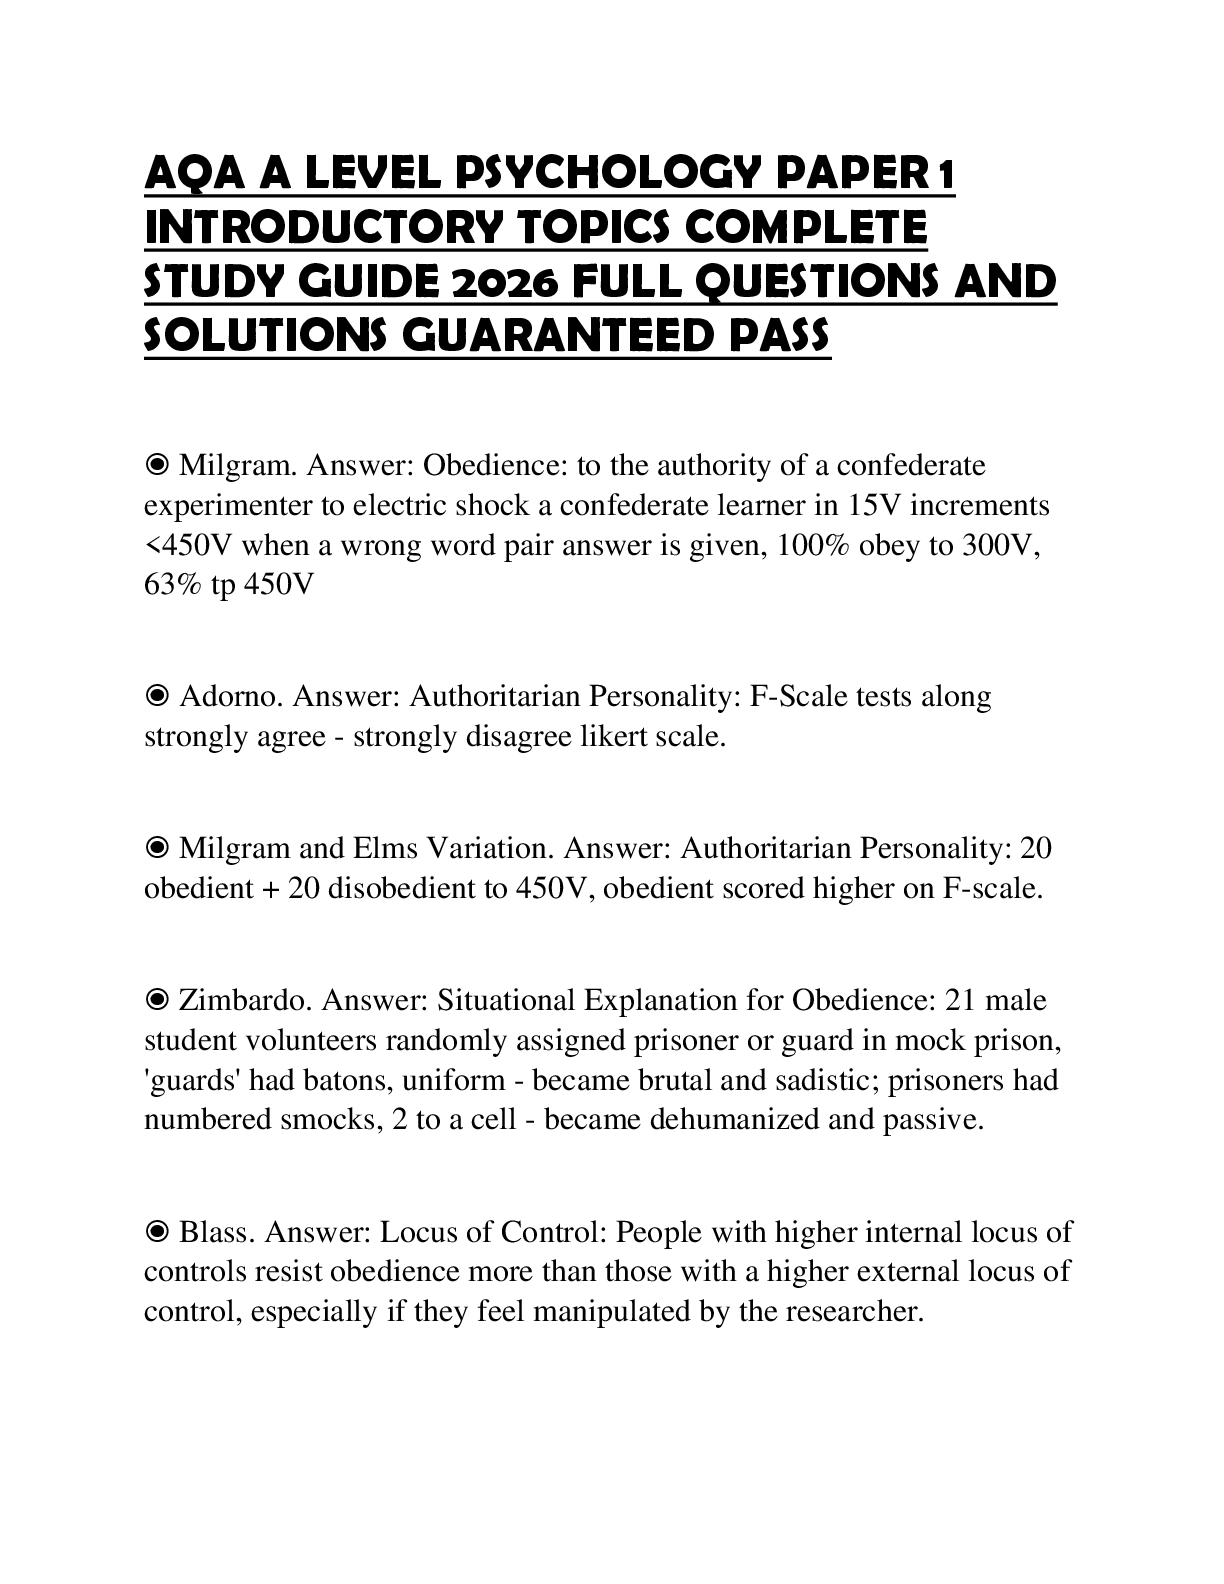
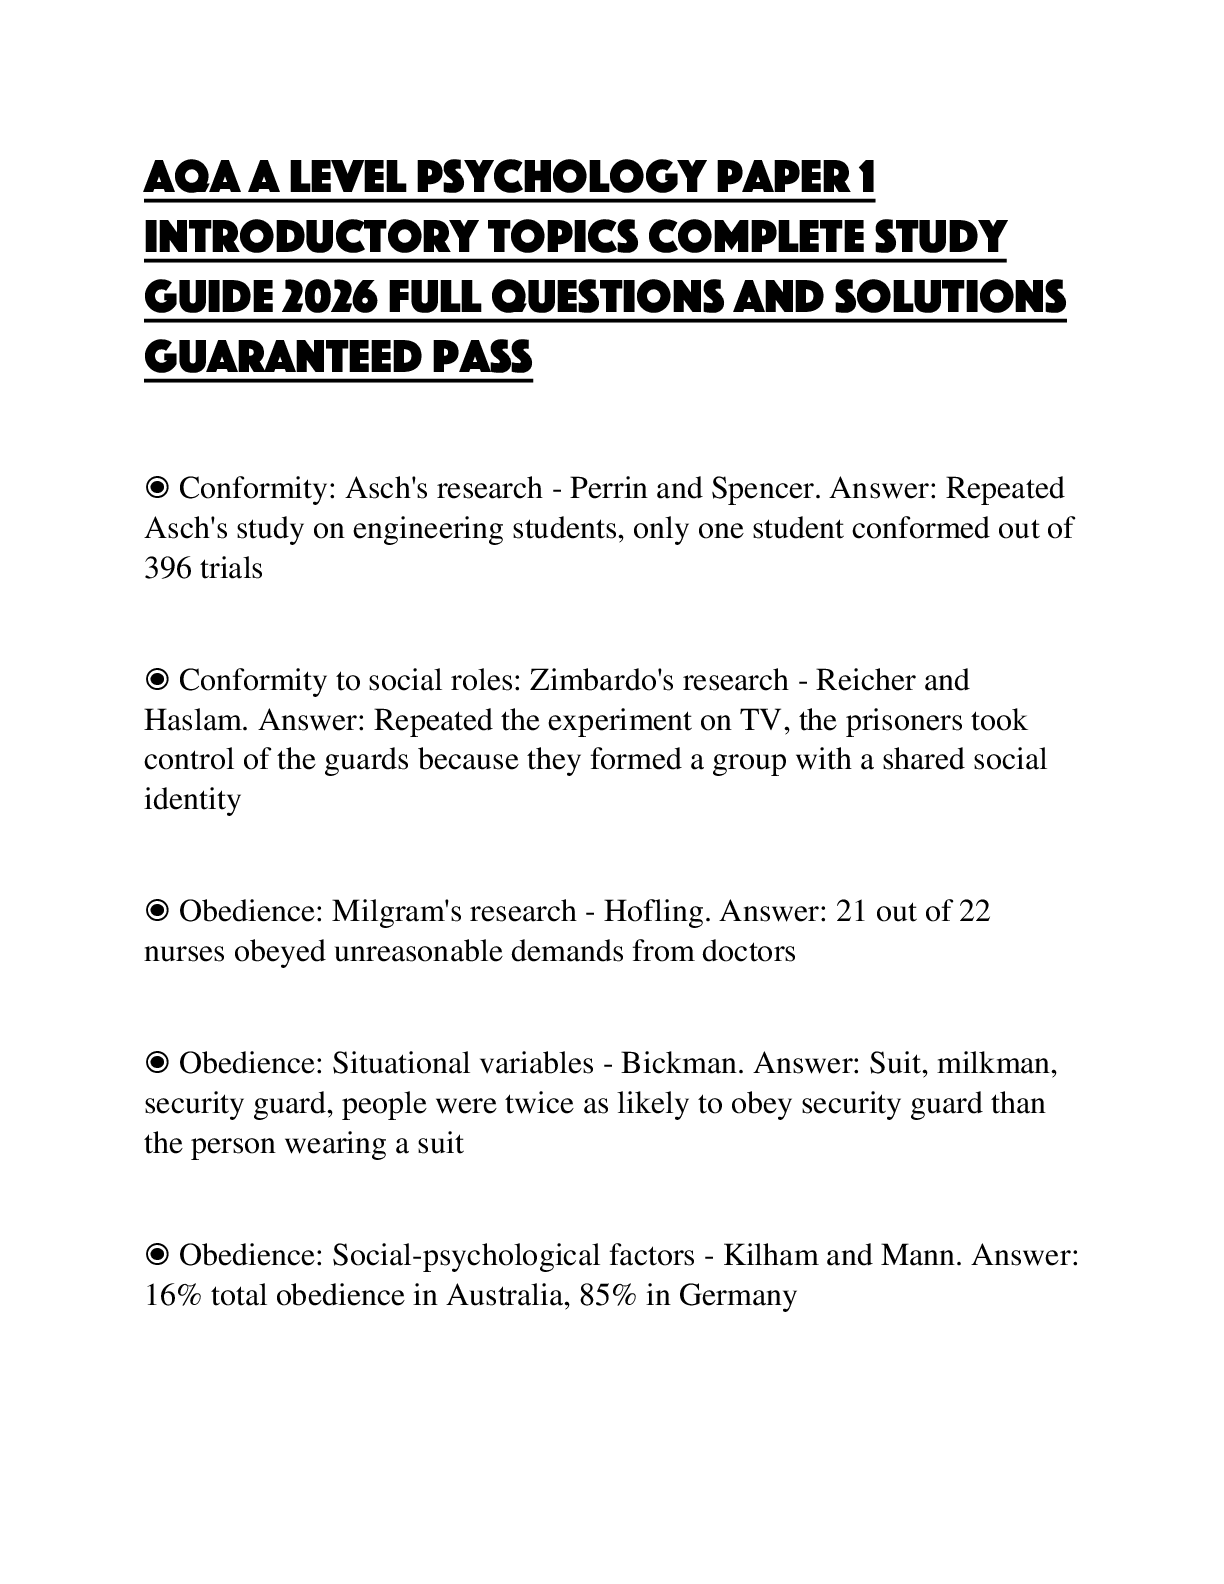
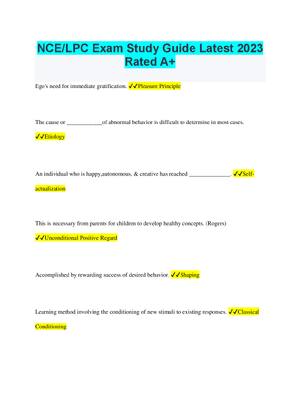
PSY520-Topic 4 Exercises
Jones-2018
Chapter 9-12
9.7 Define the sampling distribution of the mean. Probability of the means for all possible
random samples of a given size from some population.
9.8 Specify three imp
...
PSY520-Topic 4 Exercises
Jones-2018
Chapter 9-12
9.7 Define the sampling distribution of the mean. Probability of the means for all possible
random samples of a given size from some population.
9.8 Specify three important properties of the sampling distribution of the mean.
1. The mean of the sampling distribution equals the mean of the population.
2. The standard deviation of the sampling distribution, that is, the standard error of
the mean, equals the standard deviation of the population divided by the square
root of the sample size. An important implication of this formula is the larger
sample size translates into a sampling distribution with a smaller variability,
allowing more precise generalizations from the samples to populations. The
standard error of the mean serves as a rough measure of the average amount by
which sample means deviate from the mean of the sampling distribution or from
the population mean.
3. According to the central limit theorem, regardless of the shape of the population,
the shape of the sampling distribution approximates a normal curve if the sample
size is sufficiently large. Depending on the degree of the non-normality in a
parent population, a sample size of between 25 and 100 is sufficiently large.
9.9 If we took a random sample of 35 subjects from some population, the associated
sampling distribution of the mean would have the following properties (true or false).
a. Shape would approximate a normal curve. True, the sampling distribution of the
mean should always approximate a normal curve.
b. Mean would equal the one sample mean. False, there is a chance that one sample
mean could equal the mean but not 100 percent of the time.
c. Shape would approximate the shape of the population. False, the shape of the
sampling distribution of the mean is normal for a sample size above 25. Therefore
the shape should represent a normal distribution regardless of the shape of the
population distribution.
d. Compared to the population variability, the variability would be reduced by a
factor equal to the square root of 35. False, the standard deviation of the
population would be reduced by a factor equal to the square root of 35, giving the
standard error of the mean, but not the population variability.
e. Mean would equal the population mean. True, the mean of all sample means
always equals the population mean
f. Variability would equal the population variability. False, variability should be
smaller in sampling distributions than in the population.
9.13 Given a sample size of 36, how large does the population standard deviation have to
be in order for the standard error to be
xbar=/(n)^.5
xbar=standard error of the mean
= standard deviation of the population
n= sample size=35
a. 1=xbar
1=/(35)^.5=> =5.916
b. 2=xbar
2=/(35^.5=> =11.832
c. 5=xbar
5=/(35^.5=> =29.58
d. 100=xbar
100=/(35^.5=> =591.608
9.14
a. A random sample size of 144 is taken from the local population of grade-school
children. Each child estimates the number of hours per week spent watching TV. At
this point, what can be said about the sample distribution? That the sample size is
144 and we can assume that the distribution is going to be normal.
b. Assume that a standard deviation, , of 8 hours describes the TV estimates for the
local population of schoolchild
[Show More]