Management > CASE STUDY > Case Study Performance Lawn Equipment Episode 2 (All)
Case Study Performance Lawn Equipment Episode 2
Document Content and Description Below
Last updated: 3 years ago
Preview 1 out of 7 pages
Instant download

Buy this Document to get the Full Access Instantly
Provided by Students Who Aced it
We Verify Document Content to Gurantee Accuracy
Reviews( 0 )
Document information
Connected school, study & course
About the document
Uploaded On
May 26, 2022
Number of pages
7
Written in
All

Additional information
This document has been written for:
Uploaded
May 26, 2022
Downloads
0
Views
140
Document Keyword Tags
Recommended For You
Get more on CASE STUDY ».png)
Test Bank for Strategic Management Concepts and Cases, 4th Edi...

Solutions Manual for Introduction To Management Science A Mode...
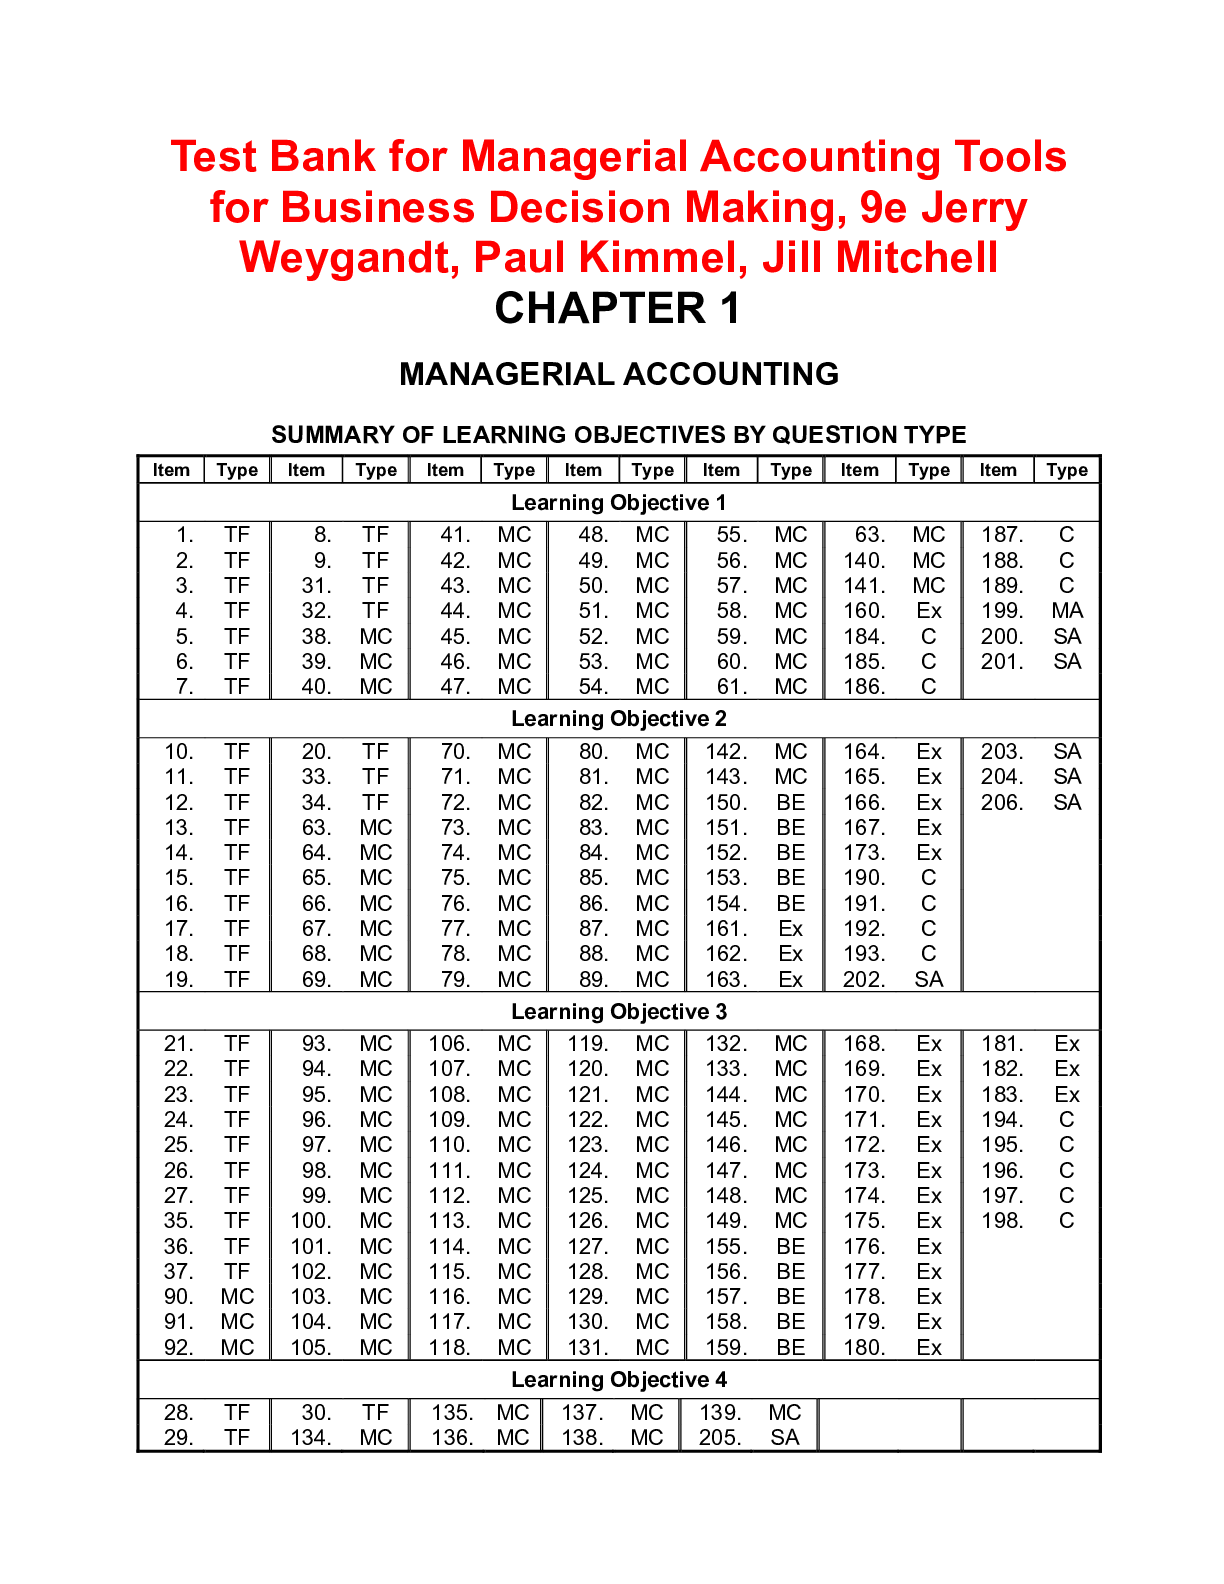
Test Bank for Managerial Accounting Tools for Business Decisio...

Research Paper > Harrisburg University of Science and Technolo...

DBA 7310 Performance Lawn Equipment (PLE) PLE Case Study-Chapt...
Columbia Southern University - DBA 7310: Performance Lawn Equi...
Columbia Southern University - DBA 7310: Performance Lawn Equi...
Columbia Southern University - DBA 7310: Performance Lawn Equi...


 Pneumonia Chronic Obstructive Pulmonary Disease Clinical Reasoning Case Study Medical surgical (NUR 201) Pneumonia-COPD case study solutions.png)
PSY 101 Week 9 Assignment Case Study 3.png)
Activity 1 Case Study 1.png)