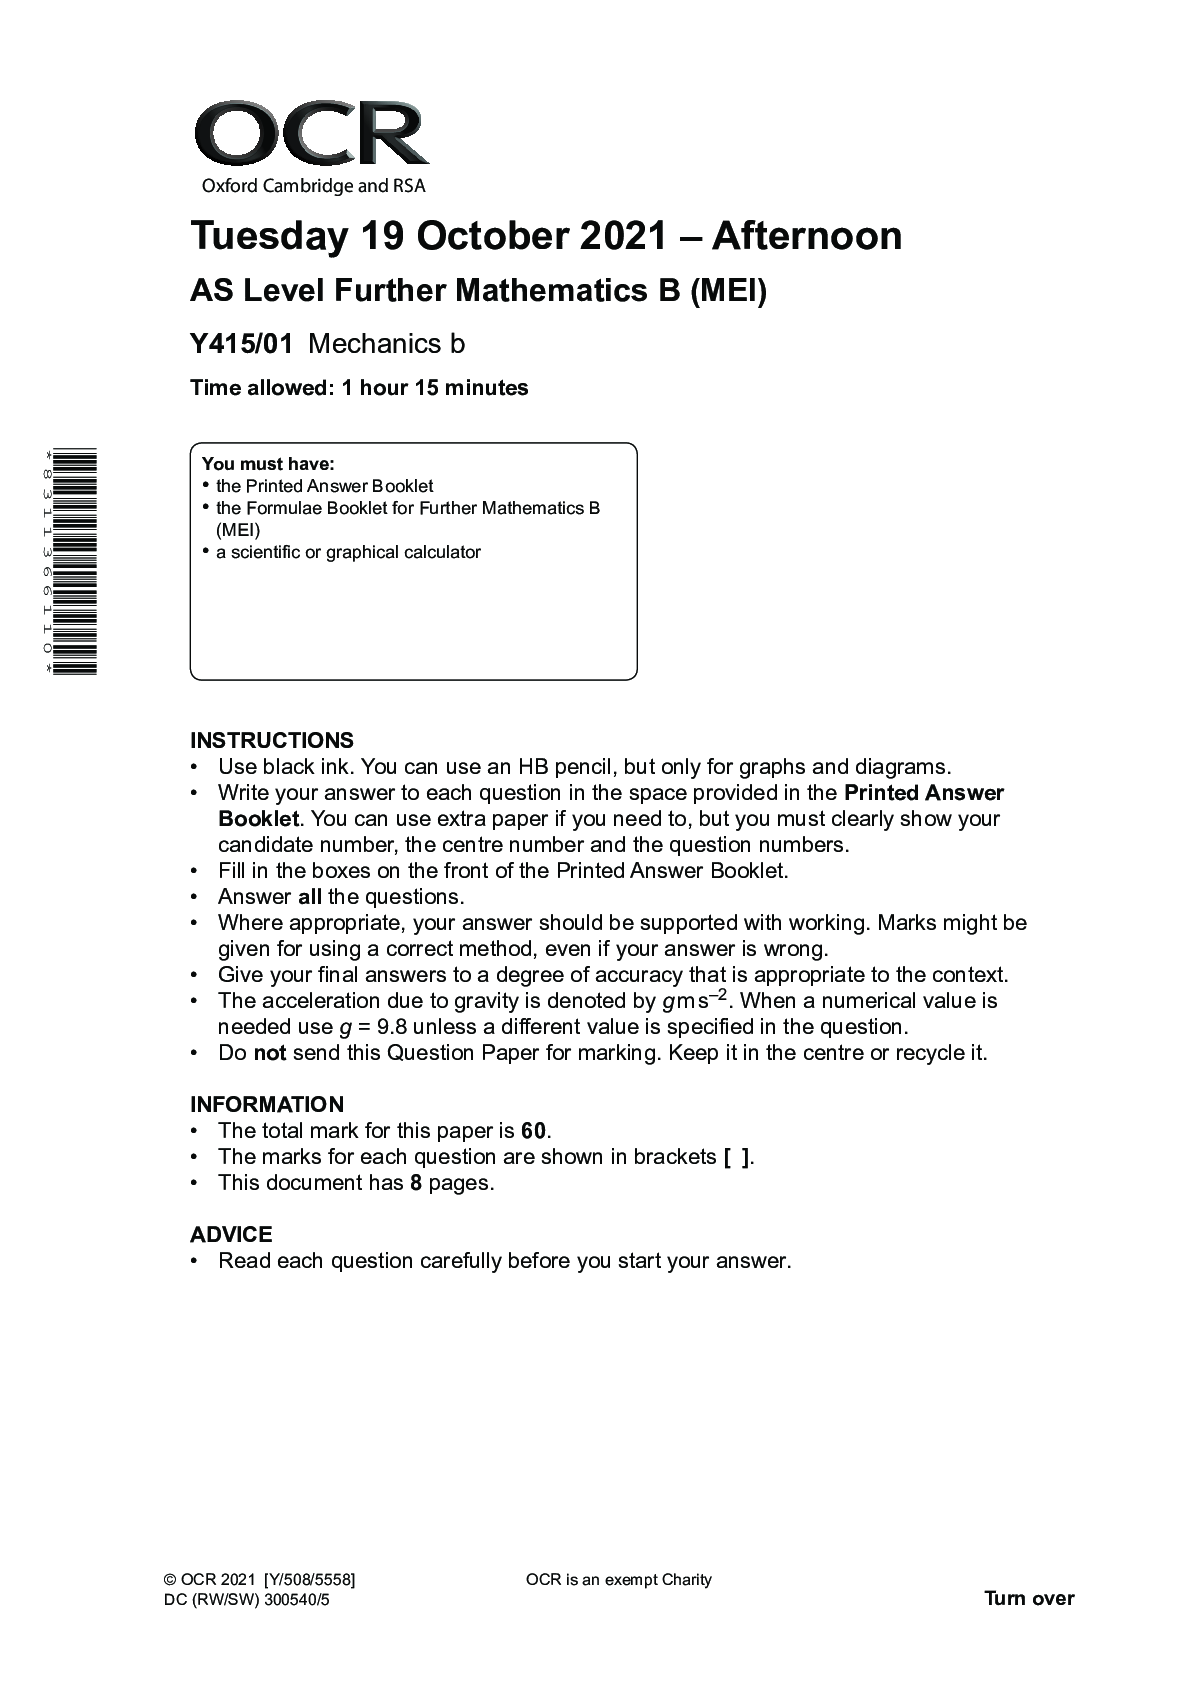
Mathematics > As Level Question Papers > > Thursday 14 October 2021 – Afternoon AS Level Further Mathematics B (MEI) Y412/01 Statistics a (All)
> Thursday 14 October 2021 – Afternoon AS Level Further Mathematics B (MEI) Y412/01 Statistics a
Document Content and Description Below
Answer all the questions. 1 The random variable X represents the clutch size (the number of eggs laid) by female birds of a particular species. The probability distribution of X is given in the tabl... e. r 2 3 4 5 6 7 P(X = r) 0.03 0.07 0.27 0.49 0.13 0.01 (a) Find each of the following. • E(X) • Var(X) [2] On average 65% of eggs laid result in a young bird successfully leaving the nest. (b) (i) Find the mean number of young birds that successfully leave the nest. [1] (ii) Find the standard deviation of the number of young birds that successfully leave the nest. [1] 2 A football player is practising taking penalties. On each attempt the player has a 70% chance of scoring a goal. The random variable X represents the number of attempts that it takes for the player to score a goal. (a) Determine P(X = 4). [2] (b) Find each of the following. • E(X ) • Var(X) [2] (c) Determine the probability that the player needs exactly 4 attempts to score 2 goals. [2] (d) The player has n attempts to score a goal. (i) Determine the least value of n for which the probability that the player first scores a goal on the nth attempt is less than 0.001. [2] (ii) Determine the least value of n for which the probability that the player scores at least one goal in n attempts is at least 0.999. [2]3 © OCR 2021 Y412/01 Oct21 Turn over 3 A student is investigating the link between temperature (in degrees Celsius) and electricity consumption (in Gigawatt-hours) in the country in which he lives. The student has read that there is strong negative correlation between daily mean temperature over the whole country and daily electricity consumption during a year. He wonders if this applies to an individual season. He therefore obtains data on the mean temperature and electricity consumption on ten randomly selected days in the summer. The spreadsheet output below shows the data, together with a scatter diagram to illustrate the data. [Show More]
Last updated: 2 years ago
Preview 1 out of 8 pages

Buy this document to get the full access instantly
Instant Download Access after purchase
Buy NowInstant download
We Accept:

Reviews( 0 )
$11.00
Can't find what you want? Try our AI powered Search
Document information
Connected school, study & course
About the document
Uploaded On
Jun 28, 2022
Number of pages
8
Written in
Additional information
This document has been written for:
Uploaded
Jun 28, 2022
Downloads
0
Views
167


