Mathematics > EXAM > MATH 221 Week 5 Homework | 100 OUT OF 100 | DeVry University (All)
MATH 221 Week 5 Homework | 100 OUT OF 100 | DeVry University
Document Content and Description Below
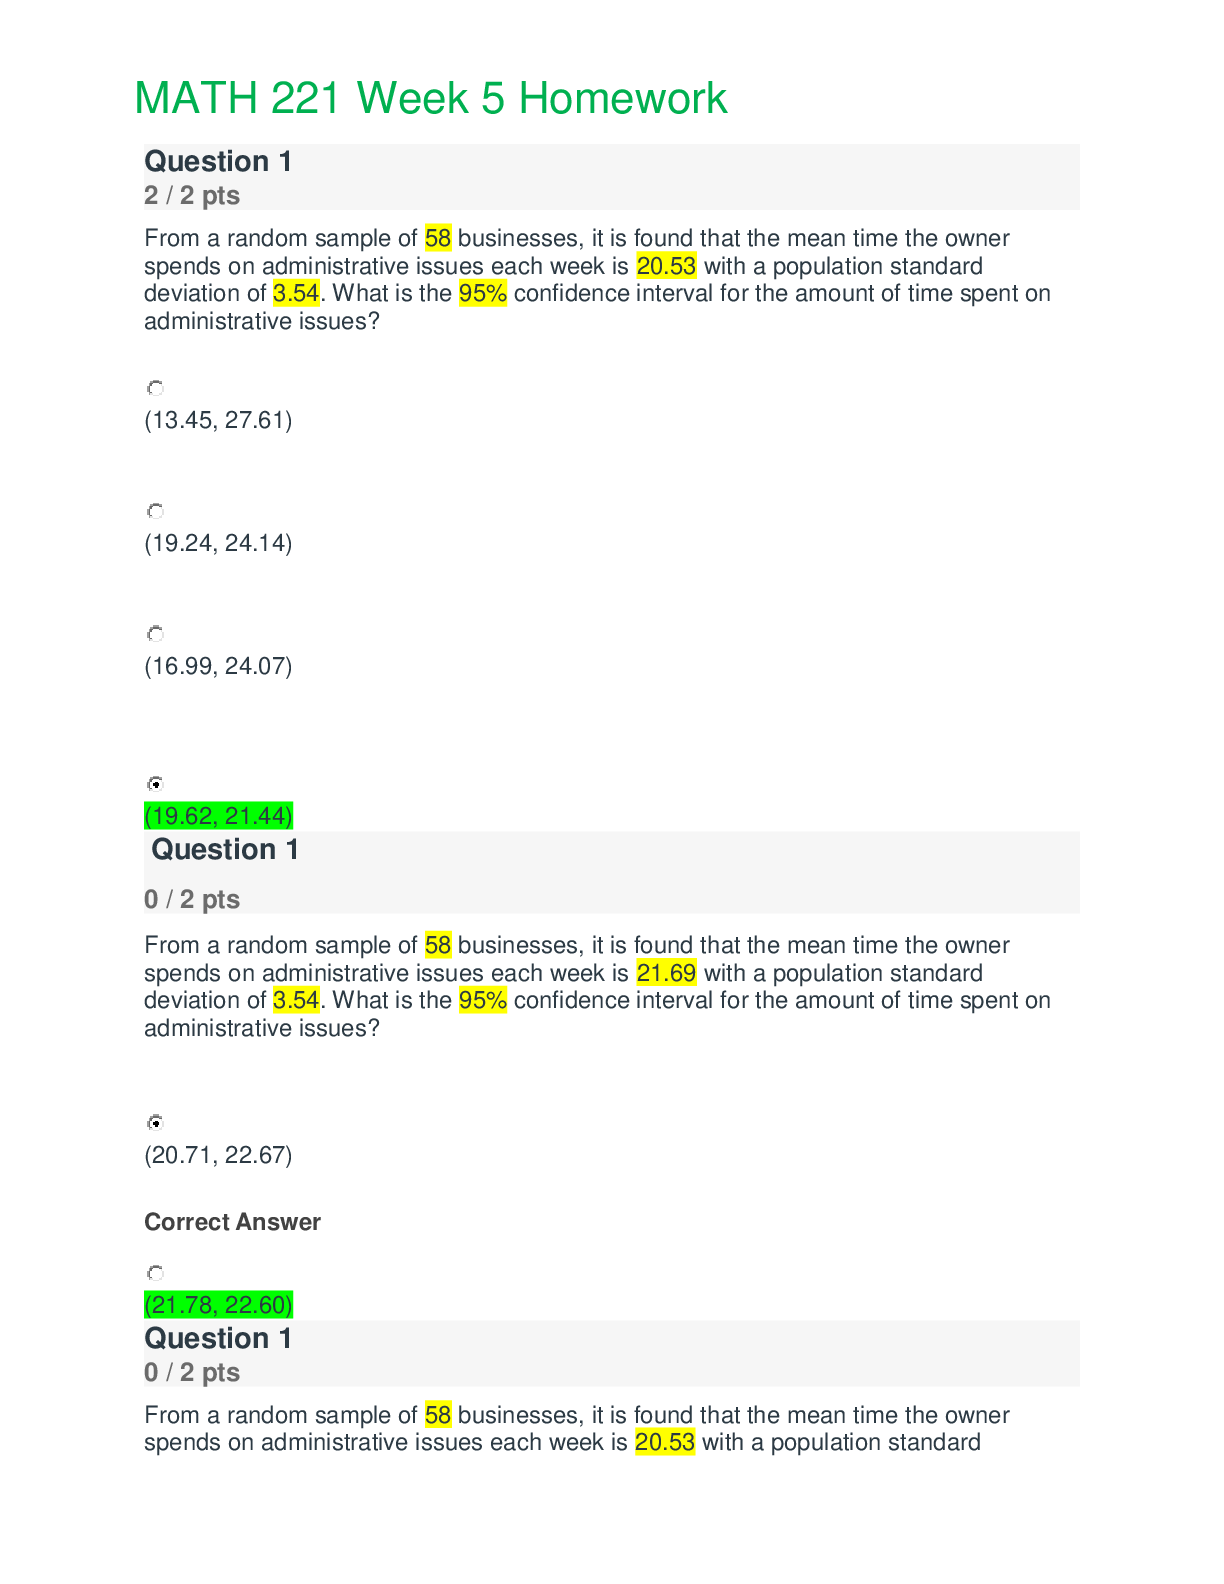
From a random sample of 58 businesses, it is found that the mean time the owner spends on administrative issues each week is 20.53 with a population standard deviation of 3.54. What is the 95% confid ... ence interval for the amount of time spent on administrative issues? (13.45, 27.61) (19.24, 24.14) (16.99, 24.07) (19.62, 21.44) From a random sample of 58 businesses, it is found that the mean time the owner spends on administrative issues each week is 21.69 with a population standard deviation of 3.54. What is the 95% confidence interval for the amount of time spent on administrative issues? (20.71, 22.67) Correct Answer (21.78, 22.60) From a random sample of 58 businesses, it is found that the mean time the owner spends on administrative issues each week is 20.53 with a population standard deviation of 3.23. What is the 95% confidence interval for the amount of time spent on administrative issues? (20.93, 22.46) (19.24, 24.14) Correct Answer (19.70, 21.36) Question 2 If a confidence interval is given from 45.82 up to 55.90 and the mean is known to be 50.86, what is the margin of error? 10.08 2.52 Correct Answer 5.04 If a confidence interval is given from 43.8 up to 62.0 and the mean is known to be 52.9, what is the margin of error? Correct Answer 9.1 4.6 If a confidence interval is given from 43.83 up to 61.97 and the mean is known to be 52.90, what is the margin of error? 18.14 43.83 Correct Answer 9.07 4.54 If a computer manufacturer needed a supplier that could produce parts that were very precise, what characteristics would be better? wide confidence interval with high confidence level narrow confidence interval at low confidence level wide confidence interval with low confidence level Correct Answer narrow confidence interval at high confidence level If a car manufacturer wanted lug nuts that fit nearly all the time, what characteristics would be better? narrow confidence interval at low confidence level wide confidence interval with low confidence level Correct Answer narrow confidence interval at high confidence level wide confidence interval with high confidence level Which of the following are most likely to lead to a narrow confidence interval? large standard deviation Correct Answer large sample size small sample size small mean Which of the following are most likely to lead to a narrow confidence interval? large sample size large mean large standard deviation small standard deviation Which of the following are most likely to lead to a wide confidence interval? Correct Answer large standard deviation small standard deviation large mean large sample size If you were designing a study that would benefit from very disperse data points, you would want the input variable to have: a large sample size a small margin of error a large mean Correct Answer a large standard deviation If you were designing a study that would benefit from a narrow range of data points, you would want the input variable to have: a small mean Correct Answer a small margin of error a large standard deviation If you were designing a study that would benefit from very disperse data points, you would want the input variable to have: a large sample size Correct Answer a large margin of error a small standard deviation If you were designing a study that would benefit from data points with high values, you would want the input variable to have: Correct Answer a large mean a large standard deviation a large margin of error a large sample size The 95% confidence interval for these parts is 56.98 to 57.05 under normal operations. A systematic sample is taken from the manufacturing line to determine if the production process is still within acceptable levels. The mean of the sample is 57.04. What should be done about the production line? Keep the line operating as it is outside the confidence interval Keep the line operating as it is inside the confidence interval Question 6 0 / 2 pts The 95% confidence interval for these parts is 56.98 to 57.05 under normal operations. A systematic sample is taken from the manufacturing line to determine if the production process is still within acceptable levels. The mean of the sample is 56.96. What should be done about the production line? Keep the line operating as it is outside the confidence interval Keep the line operating as it is close to the confidence interval Correct Answer Stop the line as it is outside the confidence interval Stop the line as it is close to the confidence interval In a sample of 65 temperature readings taken from the freezer of a restaurant, the mean is 31.9 degrees and the population standard deviation is 2.7 degrees. What would be the 80% confidence interval for the temperatures in the freezer? (26.59, 37.38) (31.36, 31.90) (29.20, 34.61) (31.47, 32.33) In a sample of 41 temperature readings taken from the freezer of a restaurant, the mean is 29.7 degrees and the population standard deviation is 2.7 degrees. What would be the 80% confidence interval for the temperatures in the freezer? (31.36, 32.44) Correct Answer (29.16, 30.24) (27.00, 32.4) In a sample of 41 temperature readings taken from the freezer of a restaurant, the mean is 31.9 degrees and the population standard deviation is 2.7 degrees. What would be the 80% confidence interval for the temperatures in the freezer? Correct Answer (31.36, 32.44) (31.36, 31.90) (31.90, 32.44) (31.27, 32.53) What is the 99% confidence interval for a sample of 36 seat belts that have a mean length of 85.6 inches long and a population standard deviation of 2.5 inches? Correct Answer (84.5, 86.7) (84.4, 86.8) (80.6, 90.6) What is the 99% confidence interval for a sample of 36 seat belts that have a mean length of 85.6 inches long and a population standard deviation of 2.9 inches? Correct Answer (84.4, 86.8) (84.8, 86.4) (82.7, 88.5) (84.6, 86.5) What is the 99% confidence interval for a sample of 52 seat belts that have a mean length of 85.6 inches long and a population standard deviation of 3.8 inches? (81.8, 89.4) (84.1, 87.1) (84.0, 87.2) (84.2, 87.0) What is the 99% confidence interval for a sample of 52 seat belts that have a mean length of 85.6 inches long and a population standard deviation of 2.9 inches? (83.1, 88.1) (84.7, 86.5) Correct Answer (84.6, 86.6) If two samples A and B had the same mean and sample size, but sample B had a larger standard deviation, which sample would have the wider 95% confidence interval? Sample A as its sample is more disperse Sample A as it has the smaller sample Sample B as it has the smaller sample Sample B as its sample is more disperse If two samples A and B had the same mean and sample size, but sample A had a larger standard deviation, which sample would have the wider 95% confidence interval? Sample B as it has the smaller sample Sample A as its sample is more disperse If two samples A and B had the same mean and standard deviation, but sample A had a larger sample size, which sample would have the wider 95% confidence interval? Correct Answer Sample B as it has the smaller sample Sample A as it comes first Sample A as it has the larger sample Sample B as its sample is more dispersed Why might a company use a lower confidence interval, such as 80%, rather than a high confidence interval, such as 99%? Correct Answer It is faster as the sample size can be smaller It is cheaper as the sample size needs to be larger It is cheaper as more samples can be collected It is faster as more samples can be collected in a shorter time Determine the minimum sample size required when you want to be 95% confident that the sample mean is within two units of the population mean. Assume a population standard deviation of 4.3 in a normally distributed population. 16 18 Determine the minimum sample size required when you want to be 95% confident that the sample mean is within one unit of the population mean. Assume a population standard deviation of 3.8 in a normally distributed population. Correct Answer 56 60 Determine the minimum sample size required when you want to be 99% confident that the sample mean is within 0.50 units of the population mean. Assume a population standard deviation of 2.9 in a normally distributed population. 130 129 224 Determine the minimum sample size required when you want to be 99% confident that the sample mean is within 0.50 units of the population mean. Assume a population standard deviation of 1.4 in a normally distributed population. 31 30 53 Determine the minimum sample size required when you want to be 99% confident that the sample mean is within 0.25 units of the population mean. Assume a population standard deviation of 2.9 in a normally distributed population. Correct Answer 893 892 365 517 In a sample of 10 CEOs, they spent an average of 12.9 hours each week looking into new product opportunities with a sample standard deviation of 4.9 hours. Find the 95% confidence interval. Assume the times are normally distributed. (8.0, 17.8) (11.1, 14.7) Correct Answer (9.4, 16.4) (9.9, 15.9) In a sample of 14 CEOs, they spent an average of 12.9 hours each week looking into new product opportunities with a sample standard deviation of 4.9 hours. Find the 95% confidence interval. Assume the times are normally distributed. Correct Answer (10.1, 15.7) (8.0, 17.8) (10.3, 15.5) In a sample of 10 CEOs, they spent an average of 12.5 hours each week looking into new product opportunities with a sample standard deviation of 4.9 hours. Find the 95% confidence interval. Assume the times are normally distributed. (7.6, 17.4) (9.4, 16.4) Correct Answer (9.0, 16.0) (9.5, 15.5) In a sample of 18 kids, their mean time on the internet on the phone was 28.6 hours with a sample standard deviation of 5.6 hours. Which distribution would be most appropriate to use, when we assume these times are normally distributed? z distribution as the population standard deviatino is known while the times are assumed to be normally distributed z distribution as the sample standard deviation always represents the population Correct Answer t distribution as the population standard deviation is unknown while the times are assumed to be normally distributed In a sample of 32 kids, their mean time on the internet on the phone was 29.1 hours with a population standard deviation of 6.4 hours. Which distribution would be most appropriate to use? z distribution as the standard deviation always represents the population t distribution as the population standard deviation is known t distribution as the standard deviation is below 10 Correct Answer z distribution as the population standard deviation is known In a sample of 31 kids, their mean time on the internet on the phone was 36.5 hours with a sample standard deviation of 8.3 hours. Which distribution would be most appropriate to use, when we assume these times are normally distributed? z distribution as the population standard deviation is known z distribution as the sample standard deviation is known t distribution as the sample standard deviation is unknown Correct Answer t distribution as the population standard deviation is unknown Under a time crunch, you only have time to take a sample of 10 water bottles and measure their contents. The sample had a mean of 20.05 ounces with a sample standard deviation of 0.8 ounces. What would be the 90% confidence interval, when we assumed these measurements are normally distributed? Correct Answer (19.59, 20.51) (19.63, 20.47) Under a time crunch, you only have time to take a sample of 15 water bottles and measure their contents. The sample had a mean of 20.05 ounces with a sample standard deviation of 0.3 ounces. What would be the 90% confidence interval, when we assumed these measurements are normally distributed? Correct Answer (19.91, 20.19) (19.75, 20.35) (19.88, 20.22) (19.92, 20.18) Under a time crunch, you only have time to take a sample of 10 water bottles and measure their contents. The sample had a mean of 20.05 ounces with a sample standard deviation of 0.3 ounces. What would be the 90% confidence interval, when we assumed these measurements are normally distributed? (19.92, 20.18) (19.75, 20.35) (19.89, 20.21) Correct Answer (19.88, 20.22) Say that a supplier claims they are 99% confident that their products will be in the interval of 50.02 to 50.38. You take samples and find that the 99% confidence interval of what they are sending is 50.04 to 50.40. What conclusion can be made? Correct Answer The supplier products have a higher mean than claimed The supplier is more accurate than they claimed Say that a supplier claims they are 99% confident that their products will be in the interval of 50.02 to 50.38. You take samples and find that the 99% confidence interval of what they are sending is 50.03 to 50.37. What conclusion can be made? Correct Answer The supplier is more accurate than they claimed The supplier products have a lower mean than claimed The supplier products have a higher mean than claimed Say that a supplier claims they are 99% confident that their products will be in the interval of 50.02 to 50.38. You take samples and find that the 99% confidence interval of what they are sending is 50.00 to 50.36. What conclusion can be made? The supplier is less accurate than they claimed The supplier products have a higher mean than claimed Correct Answer The supplier products have a lower mean than claimed The supplier is more accurate than they claimed Market research indicates that a new product has the potential to make the company an additional $1.6 million, with a standard deviation of $2.0 million. If these estimates were based on a sample of 8 customers from a normally distributed data set, what would be the 95% confidence interval? (0.21, 3.00) Correct Answer (-0.07, 3.27) (-0.40, 3.60) Market research indicates that a new product has the potential to make the company an additional $1.6 million, with a standard deviation of $2.5 million. If these estimates were based on a sample of 8 customers from a normally distributed data set, what would be the 95% confidence interval? Correct Answer (-0.49, 3.69) (0.00, 3.69) (-0.13, 3.33) (-0.09, 4.10) Market research indicates that a new product has the potential to make the company an additional $1.6 million, with a standard deviation of $2.0 million. If these estimates were based on a sample of 12 customers from a normally distributed data set, what would be the 95% confidence interval? (00.47, 2.73) (0.00, 2.87) (0.33, 2.87) (-0.40, 3.60) In a sample of 28 cups of coffee at the local coffee shop, the temperatures were normally distributed with a mean of 182.5 degrees with a sample standard deviation of 14.1 degrees. What would be the 95% confidence interval for the temperature of your cup of coffee? (168.40, 196.60) (177.28, 187.72) (148.40, 176.60) Correct Answer (177.03, 187.97) In a sample of 28 cups of coffee at the local coffee shop, the temperatures were normally distributed with a mean of 162.5 degrees with a sample standard deviation of 14.1 degrees. What would be the 95% confidence interval for the temperature of your cup of coffee? Correct Answer (157.03, 167.97) (157.96, 167.04) (148.40, 176.60) (158.12, 166.88) In a situation where the sample size was 28 while the population standard deviation was increased, what would be the impact on the confidence interval? It would become wider due to using the z distribution Correct Answer It would become wider with more dispersion in values It would widen with more values In a situation where the sample size from a normally distributed data set was decreased from 45 to 22, what would be the impact on the confidence interval? It would become narrower due to using the z distribution It would become narrower with fewer values It would remain the same as sample size does not impact confidence intervals Correct Answer It would become wider due to using the t distribution In a situation where the sample size was increased from 41 to 63, what would be the impact on the confidence interval? It would become wider with more values Correct Answer It would become narrower due to more data points It would become narrower due to using the t distribution In a situation where the sample size was 46 while the population standard deviation was decreased, what would be the impact on the confidence interval? It would become wider due to more dispersion in values Correct Answer It would become narrower due to less dispersion in values It would become narrower with fewer values It would remain the same as standard deviation does not impact confidence intervals You needed a supplier that could provide parts as close to 76.8 inches in length as possible. You receive four contracts, each with a promised level of accuracy in the parts supplied. Which of these four would you be most likely to accept? Mean of 76.8 with a 90% confidence interval of 76.6 to 77.0 Correct Answer Mean of 76.8 with a 99% confidence interval of 76.6 to 77.0 [Show More]
Last updated: 3 years ago
Preview 1 out of 29 pages
Buy this document to get the full access instantly
Instant Download Access after purchase
Buy NowInstant download
We Accept:

Also available in bundle (1)
Click Below to Access Bundle(s)

MATH 221 Statistics For Decision Making [Entire Course Week 1 – 8] BUNDLED | 100% CORRECT SOLUTIONS | LATEST UPDATE
MATH 221 Week 1 Homework (Collection) MATH-221 Week 1 Quiz (100% Correct Collection) MATH 221 Week 1 Discussion: Posts MATH-221 Week 1 Lesson MATH 221 Week 2 Homework (Collection) MATH-221 Week...
By Prof. Goodluck 3 years ago
$14.5
38
Reviews( 0 )
$15.50
Can't find what you want? Try our AI powered Search
Document information
Connected school, study & course
About the document
Uploaded On
Jul 20, 2022
Number of pages
29
Written in
All

Additional information
This document has been written for:
Uploaded
Jul 20, 2022
Downloads
0
Views
165


 Questions and Answers 100% VERIFIED.png)
 Questions and Answers 100% correct Solutions.png)