Mathematics > QUESTION PAPER (QP) > The Mathematical Association of Victoria Trial Examination 2020 FURTHER MATHEMATICS Written Examinat (All)
The Mathematical Association of Victoria Trial Examination 2020 FURTHER MATHEMATICS Written Examination 2
Document Content and Description Below
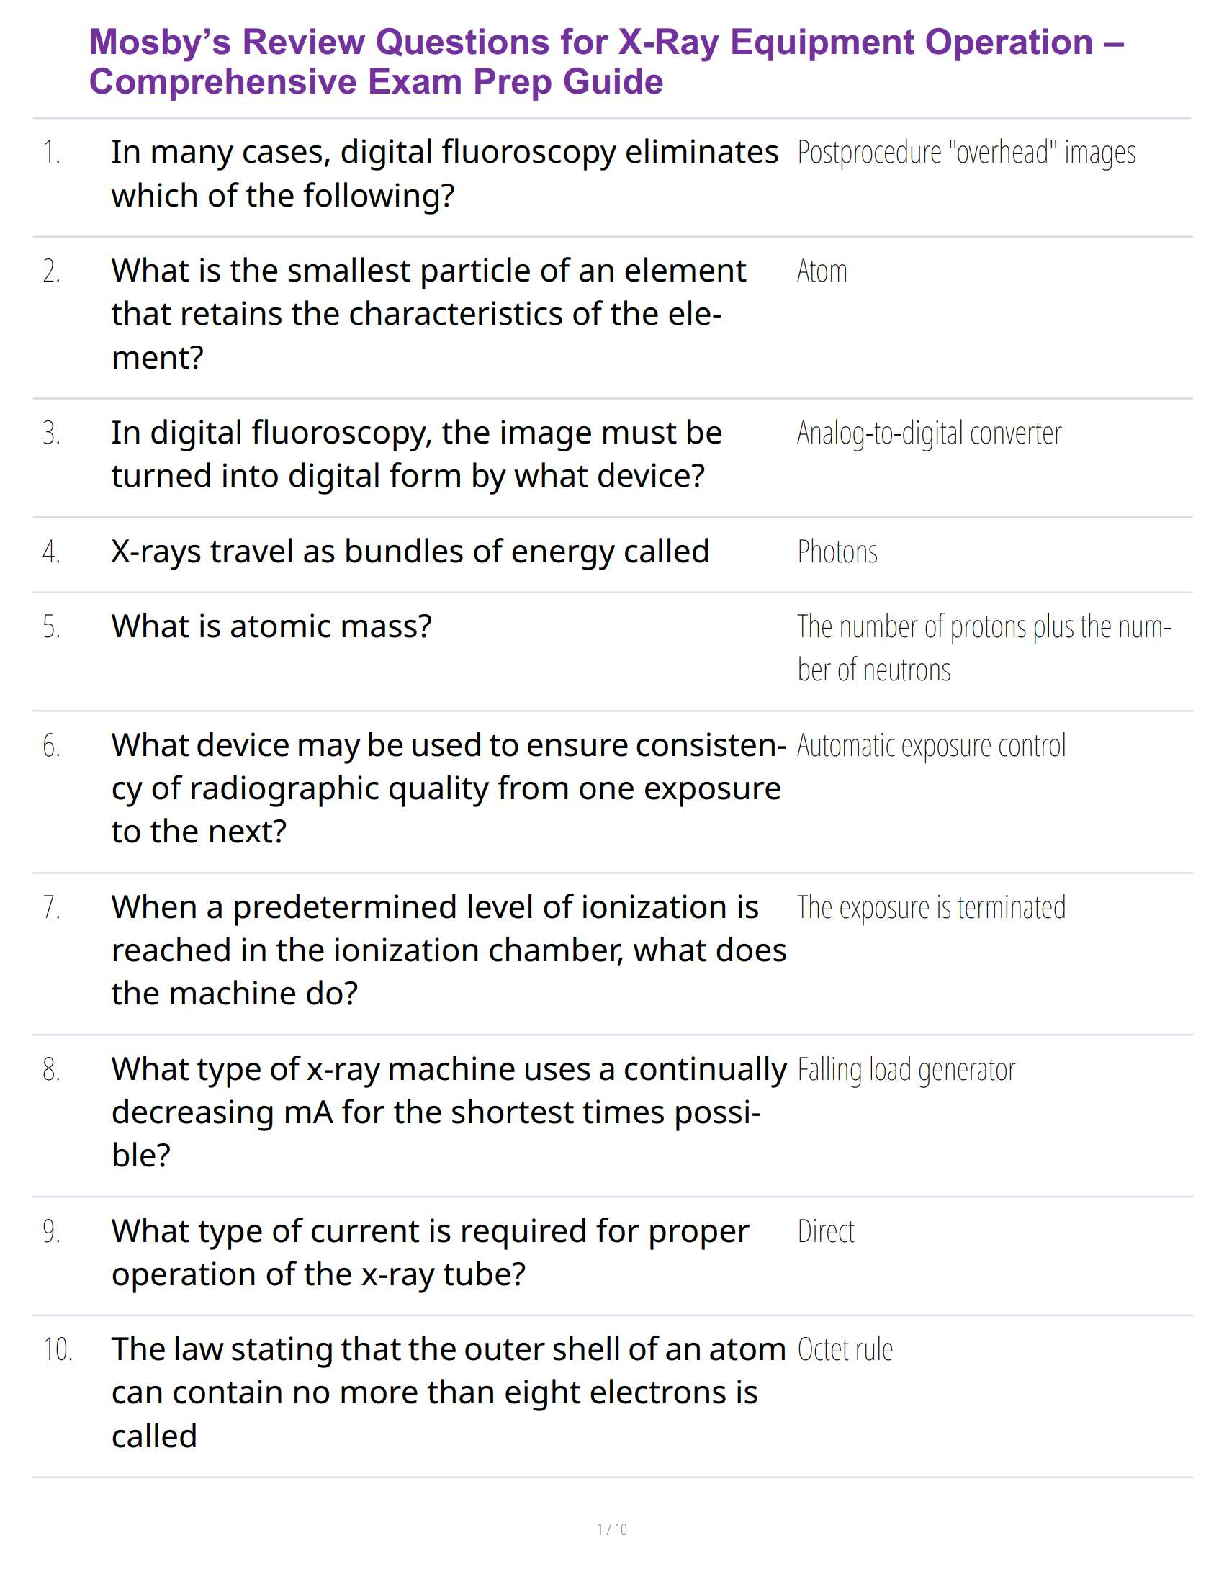
The Mathematical Association of Victoria Trial Examination 2020 FURTHER MATHEMATICS Written Examination 2 Data Analysis The Australian Bureau of Statistics collects data on the travel moveme ... nts of persons arriving in Australia. A visitor is considered to be a short-term visitor if their stay is for less than one year. Question 1 (4 marks) When a visitor arrives in Australia, they are asked to state the reason for their visit. The table gives, in thousands, the reason for travel to Australia as stated by short-term visitors arriving for the months May and August in 2019. May | August Business/conference | 106 | 109 Visiting friends/relatives | 202 | 231 Holiday | 324 | 382 Other | 58 | 68a. What is the total number of short-term visitors who arrived in August, 2019? 1 mark b. Of the visitors who stated that their reason for travel for travel was a holiday, what percentage came in May? Give your answer correct to the nearest percentage. 1 mark SECTION A – Question 1- continued TURN OVER 2020 MAV Further Mathematics Trial Exam 2 © The Mathematical Association of Victoria, 2020 4 c. Does the information provided above support the contention that reason for travel is associated with month? Justify your answer by quoting appropriate percentages. 2 marks Question 2 (6 marks) The stem plot below displays the number of visitors per month from New Zealand, NZ visitors, for 24 months. NZ visitors Key 8/4 = 84000 8 | 4 9 9 | 2 3 10 | 8 11 | 0 0 1 2 6 7 8 12 | 0 5 5 7 7 7 7 13 | 3 4 7 14 | 3 4a. Find the percentage of months, correct to the nearest whole percentage, where the number of visitors was greater than 100 000. 1 mark b. Use the information in the stem plot to find the median number of monthly NZ visitors. Add your answer to the table below. 1 mark minimum | Q1 | median (M) | Q3 | Maximum 84 000 | 110 000 | 127 000 | 144 000SECTION A - Question 2 – continued 5 c. Show that the month that had 84 000 NZ visitors is an outlier. 2 marks The graph below shows the boxplots for the the number of visitors per month from the United Kingdom and China for the same 24 months. [Show More]
Last updated: 3 years ago
Preview 1 out of 41 pages
Buy this document to get the full access instantly
Instant Download Access after purchase
Buy NowInstant download
We Accept:

Reviews( 0 )
$5.00
Can't find what you want? Try our AI powered Search
Document information
Connected school, study & course
About the document
Uploaded On
Aug 02, 2022
Number of pages
41
Written in
All

Additional information
This document has been written for:
Uploaded
Aug 02, 2022
Downloads
0
Views
171