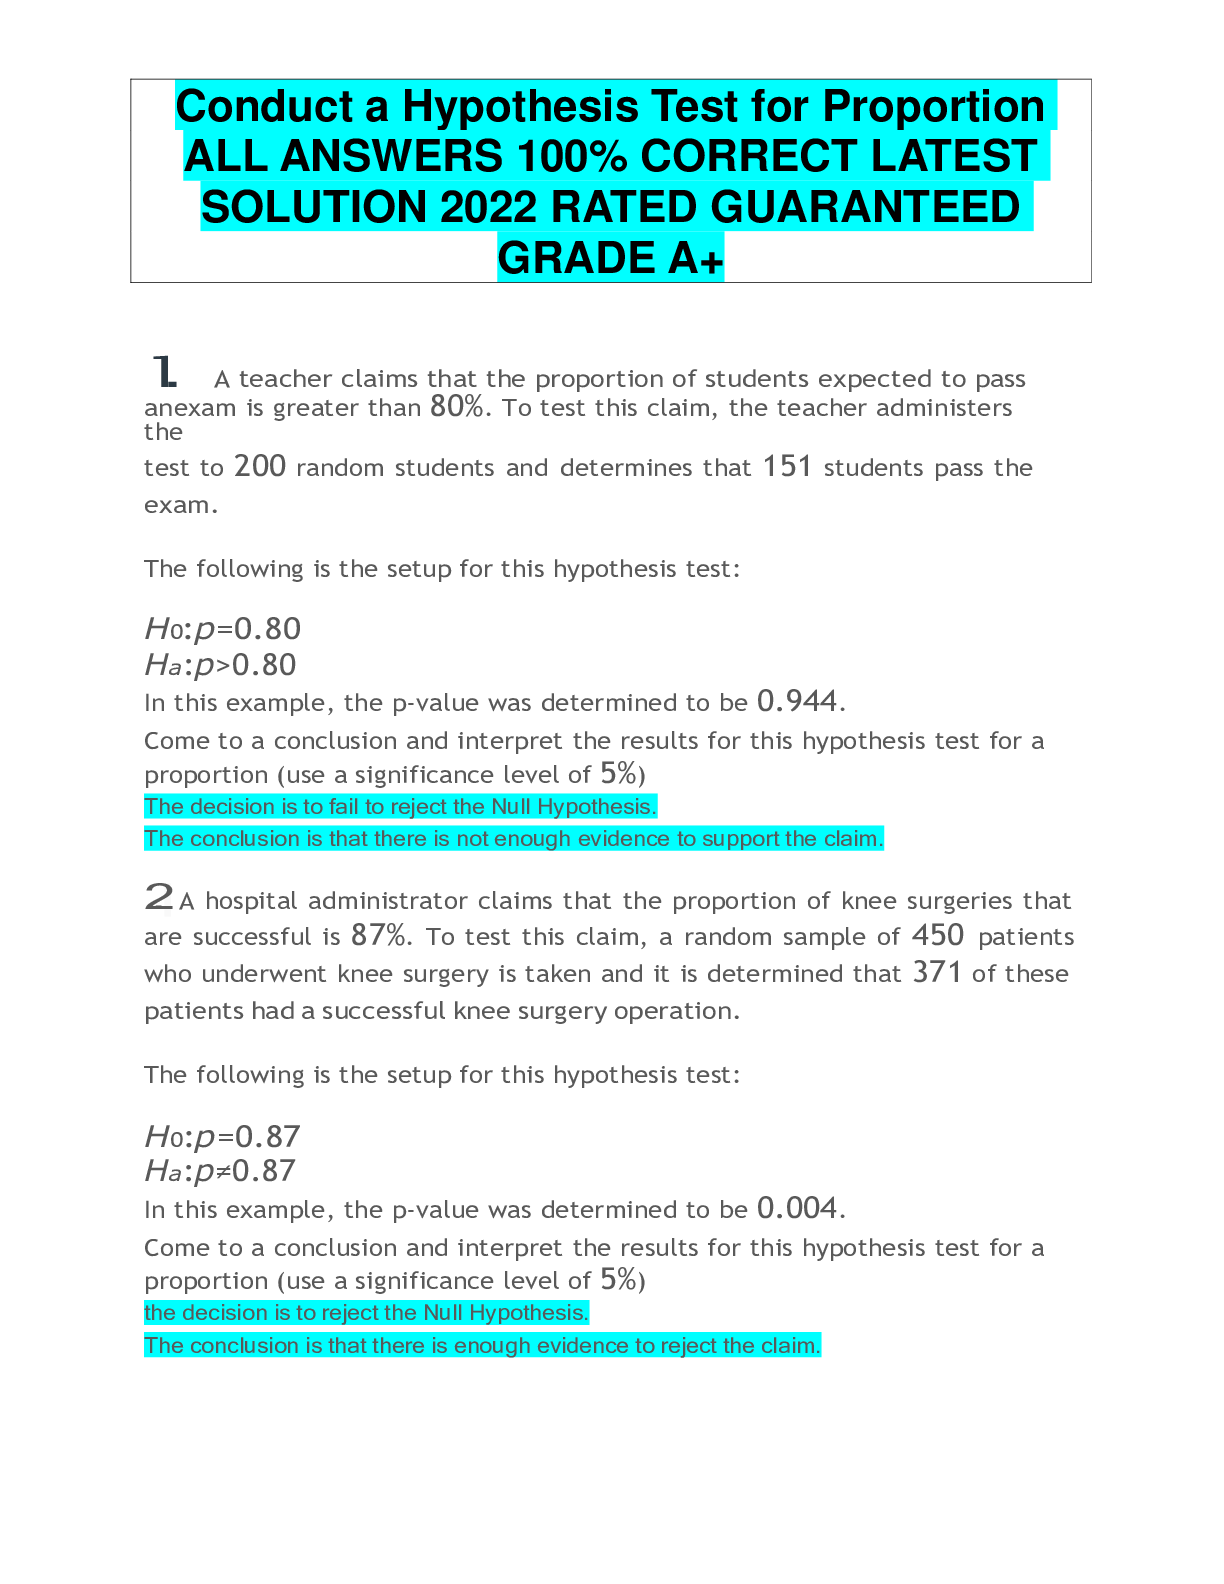
1. A teacher claims that the proportion of students expected to pass an exam is greater than 80%. To test this claim, the teacher administers the
test to 200 random students and determines that 151 students pass the exa
...
1. A teacher claims that the proportion of students expected to pass an exam is greater than 80%. To test this claim, the teacher administers the
test to 200 random students and determines that 151 students pass the exam.
The following is the setup for this hypothesis test:
H0:p=0.80 Ha:p>0.80
In this example, the p-value was determined to be 0.944.
Come to a conclusion and interpret the results for this hypothesis test for a proportion (use a significance level of 5%)
The decision is to fail to reject the Null Hypothesis.
The conclusion is that there is not enough evidence to support the claim.
2. A hospital administrator claims that the proportion of knee surgeries that are successful is 87%. To test this claim, a random sample of 450 patients who underwent knee surgery is taken and it is determined that 371 of these
patients had a successful knee surgery operation. The following is the setup for this hypothesis test:
H0:p=0.87
Ha:p≠0.87
In this example, the p-value was determined to be 0.004.
Come to a conclusion and interpret the results for this hypothesis test for a proportion (use a significance level of 5%)
the decision is to reject the Null Hypothesis.
The conclusion is that there is enough evidence to reject the claim.
3. A college administrator claims that the proportion of students that are nursing majors is greater than 40%. To test this claim, a group of 400 students are randomly selected and its determined that 190 are nursing majors.
The following is the setup for this hypothesis test:
H0:p=0.40 Ha:p>0.40
Find the p-value for this hypothesis test for a proportion and round your answer to 3 decimal places.
The following table can be utilized which provides areas under the Standard Normal Curve:
0.001.
4. A police officer claims that the proportion of accidents that occur in the daytime (versus nighttime) at a certain intersection is 35%. To test this claim, a random sample of 500 accidents at this intersection was examined from police records it is determined that 156 accidents occurred in the daytime.
The following is the setup for this hypothesis test:
H0:p = 0.35
Ha:p ≠ 0.35
Find the p-value for this hypothesis test for a proportion and round your answer to 3 decimal places.
0.076
5. A teacher claims that the proportion of students expected to pass an exam is greater than 80%. To test this claim, the teacher administers the test to 200 random students and determines that 151 students pass the exam.
The following is the setup for this hypothesis test:
H0:p=0.80 Ha:p>0.80
Find the p-value for this hypothesis test for a proportion and round your answer to 3 decimal places.
From a lookup table of the area under the Standard Normal curve, the corresponding area is then 1 - 0.056 = 0.944.
6. A human resources representative claims that the proportion of employees earning more than $50,000 is less than 40%. To test this claim, a random sample of 700 employees is taken and 305 employees are determined to earn more than $50,000.
The following is the setup for this hypothesis test:
H0:p=0.40 Ha:p<0.40
Find the p-value for this hypothesis test for a proportion and round your answer to 3 decimal places.P= 0.973
7. A college administrator claims that the proportion of students that are nursing majors is less than 40%. To test this claim, a group of 400 students are randomly selected and its determined that 149 are nursing majors.
The following is the setup for this hypothesis test:
H0:p=0.40 Ha:p<0.40 0.003
8. A business owner claims that the proportion of online orders is greater
than 75%. To test this claim, the owner checks the next 1,000 orders and determines that 745 orders are online orders.
The following is the setup for this hypothesis test:
H0:p=0.75
Ha:p>0.75 0.643.
[Show More]

.png)
 2e Peter Olver, Chehrzad Shakiban.png)