BUSN 499 - Situational Analysis Ferris State University BUSN 499 .
Document Content and Description Below
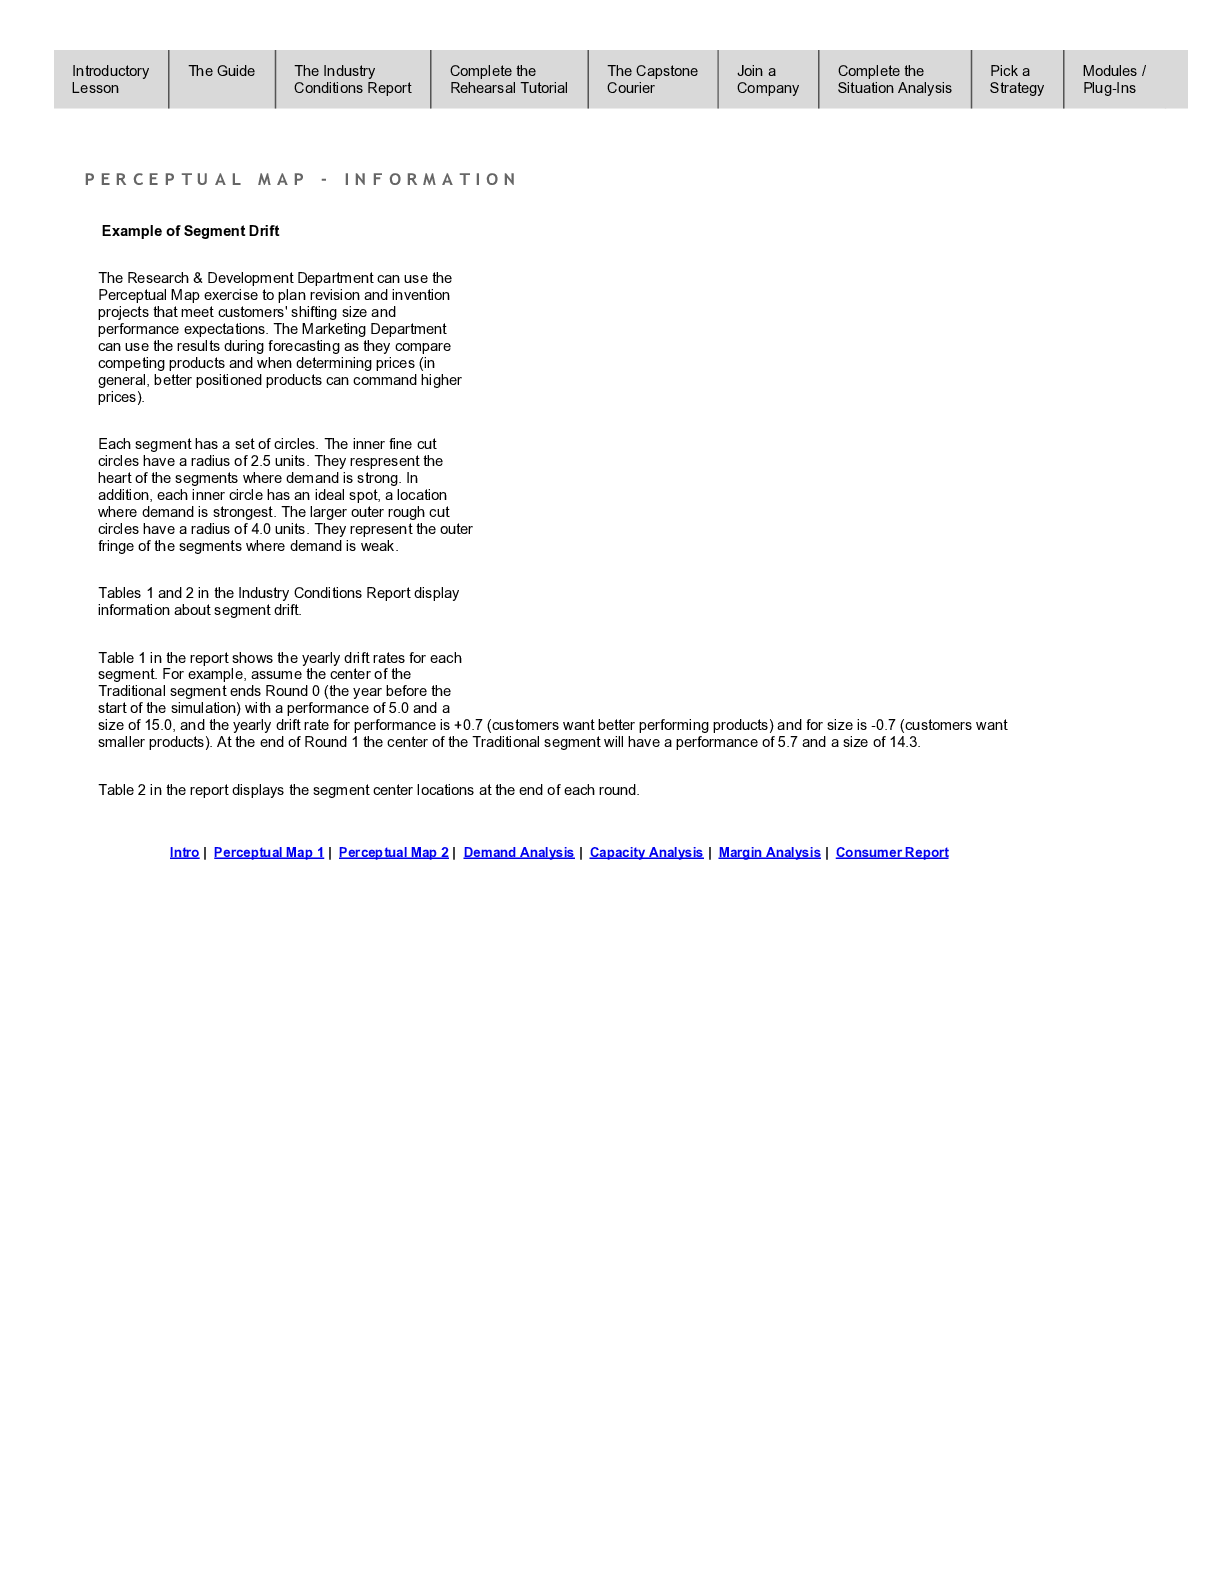
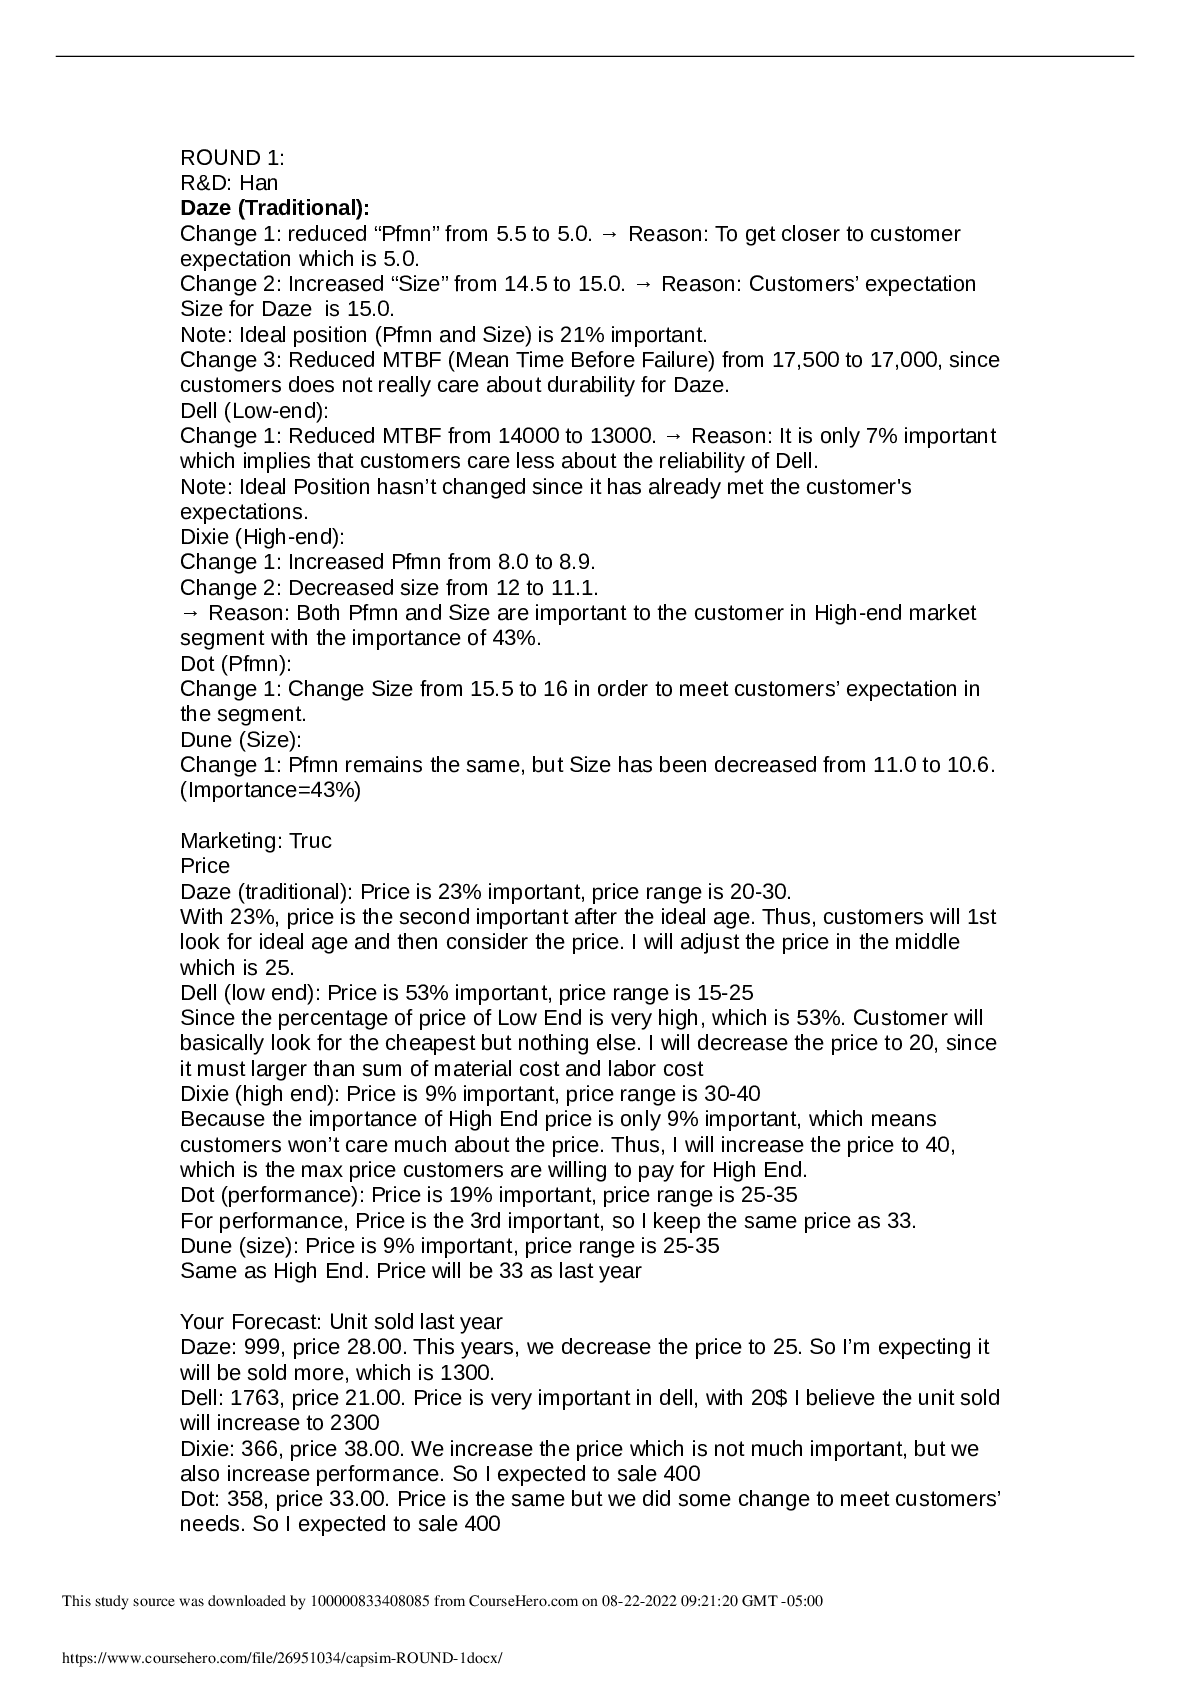
Example of Segment Drift
The Research & Development Department can use the
Perceptual Map exercise to plan revision and invention
projects that meet customers' shifting size and
performance expectations. The Marketin
...
[Show More]
Last updated: 4 years ago
Preview 1 out of 9 pages
Instant download
Buy this Document to get the Full Access Instantly
Provided by Students Who Aced it
We Verify Document Content to Gurantee Accuracy
Reviews( 0 )
Document information
Connected school, study & course
About the document
Uploaded On
Aug 22, 2022
Number of pages
9
Written in
All

Additional information
This document has been written for:
Uploaded
Aug 22, 2022
Downloads
0
Views
301
Topic Tags
Recommended For You
Get more on Capism »
$19
983 Pages
Solution Manual for Canadian Income Taxation 20232024 26th Edi...
.png)
$9
6 Pages
Capsim Baldwin Final Report (C82618) .University of Washington...
$25
211 Pages
Solution Manual for Canadian Income Taxation (2022-2023) 25th...
$22
374 Pages
Concepts in Strategic Management and Business Policy Globaliza...

$32
2186 Pages
Business Law 17th Edition Langvardt Test Bank.Answers and chea...
$25
61 Pages
Business Ethics 5th Edition Crane, Matten, Glozer, Spence | Te...


$29
78 Pages
Solutions Manual for Business Research Methods, 5th Edition By...

$5
2 Pages
Capsim_Training_Quiz Training Beginner Level Certification: Sc...

$15
217 Pages
BUSINESS 1007 | Managers utilize organizational resources such...

More related documents below
.png)

.png)

