Motor Development > EXAM > Questions and Answers > Capella University PSYC 4700 PSYC4700 - Statistics for the Behavioral Scienc (All)
Questions and Answers > Capella University PSYC 4700 PSYC4700 - Statistics for the Behavioral Sciences Week 3: Central Tendency exam
Document Content and Description Below
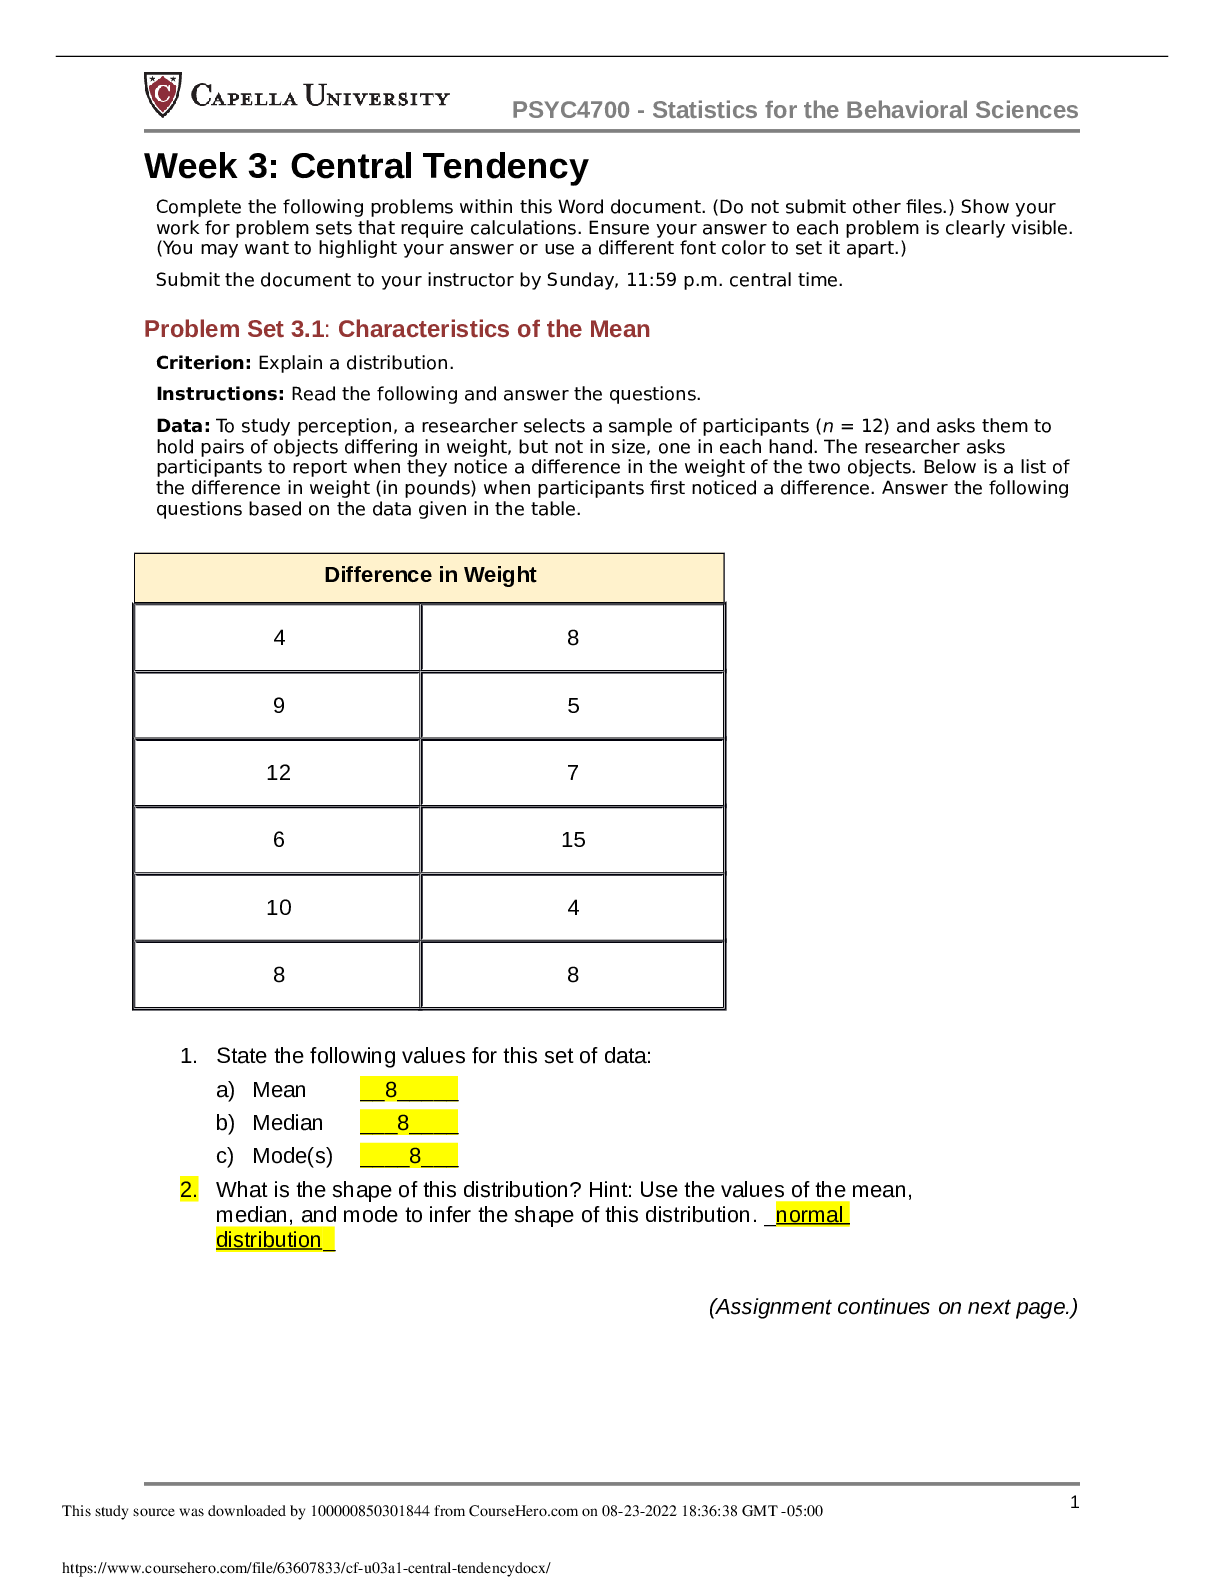
Capella University PSYC 4700 PSYC4700 - Statistics for the Behavioral Sciences Week 3: Central Tendency Complete the following problems within this Word document. (Do not submit other files.) Show ... your work for problem sets that require calculations. Ensure your answer to each problem is clearly visible. (You may want to highlight your answer or use a different font color to set it apart.) Submit the document to your instructor by Sunday, 11:59 p.m. central time. Problem Set 3.1: Characteristics of the Mean Criterion: Explain a distribution. Instructions: Read the following and answer the questions. Data: To study perception, a researcher selects a sample of participants (n = 12) and asks them to hold pairs of objects differing in weight, but not in size, one in each hand. The researcher asks participants to report when they notice a difference in the weight of the two objects. Below is a list of the difference in weight (in pounds) when participants first noticed a difference. Answer the following questions based on the data given in the table. Problem Set 3.2: Interpret Means in a Chart Criterion: Interpret means in a chart. Instructions: Read the information below and answer the questions. Data: General life satisfaction across culture. Gilman and colleagues (2008) measured general life satisfaction in 1,338 adolescents from two individualistic nations (Ireland, United States) and two collectivist nations (China, South Korea) using the Multidimensional Students’ Life Satisfaction Scale (MSLSS). Mean participant scores on the MSLSS are given in the following table. Problem Set 3.3: Understanding Standard Deviations in a Chart Criterion: Interpret standard deviations in a chart. Instructions: Read the following and answer the question based on the data in the chart. Data: Acceptable height preferences. Salska and colleagues (2008) studied height preferences among dating partners. In their first study, they reviewed Yahoo Personals for heterosexual individuals living within 250 miles of Los Angeles, California, and recorded the acceptable range of heights for their dating partners. The following table lists some of the results. Problem Set 3.4: Range, Variance, and Standard Deviation in Excel Criterion: Calculate measures of variability in Excel from a group of raw scores. Data: A sample of likes per post on Facebook: 45, 789, 16, 5, 486, 1, 87, 18, 48, 1 Instructions: Complete the following steps: o Install the data analytics package in Excel. o If you are unsure about how to do this, visit Load the Analysis Toolpak in Microsoft Excel, which has tutorials for both Windows and Mac. Used with permission from Microsoft. o Enter the data above into Excel using the variable name Data. In cell A1, type the word “Data.” Then, enter the data above in cells A2 to A11. o In the Toolbar, click Data Analysis, Select Descriptive Statistics, then click OK. o Next to input range type: $A$2:$A$11 o Double check that summary statistics has a check next to it. o Click OK. A new sheet will appear to the right with your data. o Copy and paste the descriptive statistics table below. o Highlight the range, mean, and standard deviation Problem Set 3.5: Range, Variance, and Standard Deviation in SPSS Criterion: Calculate measures of variability in SPSS from a group of raw scores. Instructions: Complete the following steps: a. Enter the data from Problem Set 3.4 into SPSS using the variable name Data. b. In the Toolbar, click Analyze, select Descriptive Statistics, and then select Descriptives. c. Click Data and then click Arrow to send it over to the right side of the table. Select Options, check the boxes Variance and Range, and then click Continue. d. Click OK and copy and paste the descriptive statistics table below. e. Highlight the range, mean, and standard deviation. Problem Set 3.6: Clean Your Data Criterion: Clean data. Instructions: Follow the directions below. a. Open the Excel file you downloaded from GSS (GSS.xls) b. Delete the entire row when there is an answer of “No answer,” “Not applicable,” or “Don’t know.” To delete a row, click the number of the row so it’s all highlighted, then click Delete from the toolbar. o SHORT CUT: Click on the row 1 to name of one of your variables, Click Sort & Filter from the toolbar, and then Sort A to Z. Now the answers are in order and you can highlight and delete. When one variable is done, repeat with your other variable. c. Using the information on the Codes tab, turn the information on your variables from words to numbers. For example, if label Depends equals code 3, replace Depends with a 3. If the answer Depends only appears in 1 of your two variables, you can go to Find & Select, then Replace, then enter the information. If the answer Depends appeared in both variables, you’ll want to do Sort & Filter as you did above. d. Take a screenshot of your completed work (it’s okay if not all data shows) and paste below. Problem Set 3.7: Importing Data from Excel to SPSS Criterion: Import data to SPSS. Instructions: Follow the directions below. a. Open SPSS, click on File, in the toolbar. Select Import Data. Click on Excel. b. Select the Excel file you downloaded from GSS (GSS.xls), click Open c. Click OK d. Open your Excel file from GSS (GSS.xls), and click the Codes tab. e. In SPSS, go to Variable View. For your first variable, click Values. Type 1 in Value; then look at Excel for 1 for that variable. In Label, type the label for 1. The click Add. When all values for the variable have been entered, click OK. f. In SPSS, go to Variable View. For your second variable, click Values. Type 1 in Value: then look at your Excel for 1 for that variable. In Label, type the label for 1. The click Add. When all values for the variable have been entered, click OK. g. Copy and paste your Variable View below. [Show More]
Last updated: 3 years ago
Preview 1 out of 6 pages
Buy this document to get the full access instantly
Instant Download Access after purchase
Buy NowInstant download
We Accept:

Reviews( 0 )
$8.00
Can't find what you want? Try our AI powered Search
Document information
Connected school, study & course
About the document
Uploaded On
Aug 24, 2022
Number of pages
6
Written in
All

Additional information
This document has been written for:
Uploaded
Aug 24, 2022
Downloads
0
Views
110