ISYE-6501 – HOMEWORK WEEK #14
Question 19.1
Describe analytics models and data that could be used to make good recommendations to the retailer. How much
shelf space should the company have, to maximize their sales or
...
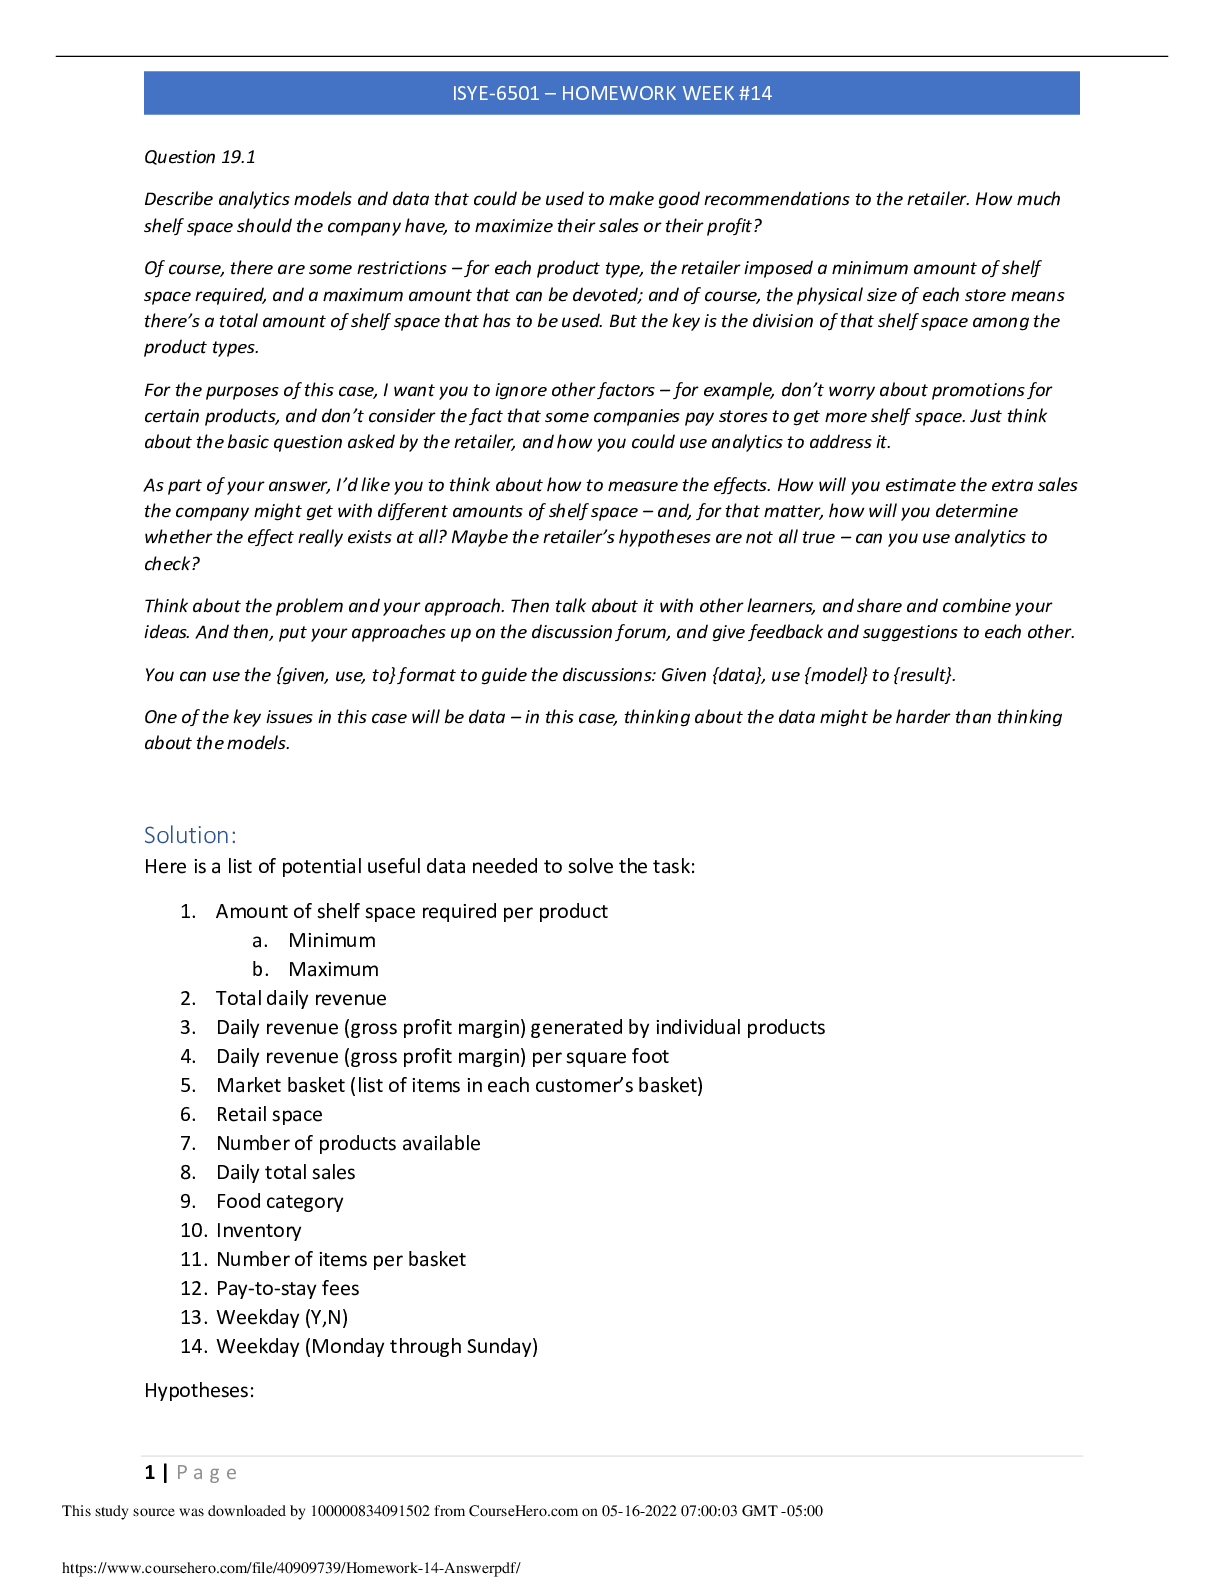
ISYE-6501 – HOMEWORK WEEK #14
Question 19.1
Describe analytics models and data that could be used to make good recommendations to the retailer. How much
shelf space should the company have, to maximize their sales or their profit?
Of course, there are some restrictions – for each product type, the retailer imposed a minimum amount of shelf
space required, and a maximum amount that can be devoted; and of course, the physical size of each store means
there’s a total amount of shelf space that has to be used. But the key is the division of that shelf space among the
product types.
For the purposes of this case, I want you to ignore other factors – for example, don’t worry about promotions for
certain products, and don’t consider the fact that some companies pay stores to get more shelf space. Just think
about the basic question asked by the retailer, and how you could use analytics to address it.
As part of your answer, I’d like you to think about how to measure the effects. How will you estimate the extra sales
the company might get with different amounts of shelf space – and, for that matter, how will you determine
whether the effect really exists at all? Maybe the retailer’s hypotheses are not all true – can you use analytics to
check?
Think about the problem and your approach. Then talk about it with other learners, and share and combine your
ideas. And then, put your approaches up on the discussion forum, and give feedback and suggestions to each other.
You can use the {given, use, to} format to guide the discussions: Given {data}, use {model} to {result}.
One of the key issues in this case will be data – in this case, thinking about the data might be harder than thinking
about the models.
Solution:
Here is a list of potential useful data needed to solve the task:
1. Amount of shelf space required per product
a. Minimum
b. Maximum
2. Total daily revenue
3. Daily revenue (gross profit margin) generated by individual products
4. Daily revenue (gross profit margin) per square foot
5. Market basket (list of items in each customer’s basket)
6. Retail space
7. Number of products available
8. Daily total sales
9. Food category
10. Inventory
11. Number of items per basket
12. Pay-to-stay fees
13. Weekday (Y,N)
14. Weekday (Monday through Sunday)
[Show More]