HOMEWORK 9 – SAMPLE SOLUTIONS
IMPORTANT NOTE
These homework solutions show multiple approaches and some optional extensions for most of the
questions in the assignment. You don’t need to submit all this in your assign
...
HOMEWORK 9 – SAMPLE SOLUTIONS
IMPORTANT NOTE
These homework solutions show multiple approaches and some optional extensions for most of the
questions in the assignment. You don’t need to submit all this in your assignments; they’re included here
just to help you learn more – because remember, the main goal of the homework assignments, and of
the entire course, is to help you learn as much as you can, and develop your analytics skills as much as
possible!
Question 12.1
Describe a situation or problem from your job, everyday life, current events, etc., for which a design of
experiments approach would be appropriate.
Here’s one possible situation. Restaurants (the high-level expensive ones I don’t often go to) often
prefer the same sort of simplicity as we sometimes do in modeling: they prefer to have a small number
of items on the menu. So, a restauranteur needs to decide what combinations of entrees, side dishes,
etc. to put on the menu. Of course, there are too many combinations to try them all, so a design-ofexperiments approach could help the restauranteur collect some data and make informed menu
decisions.
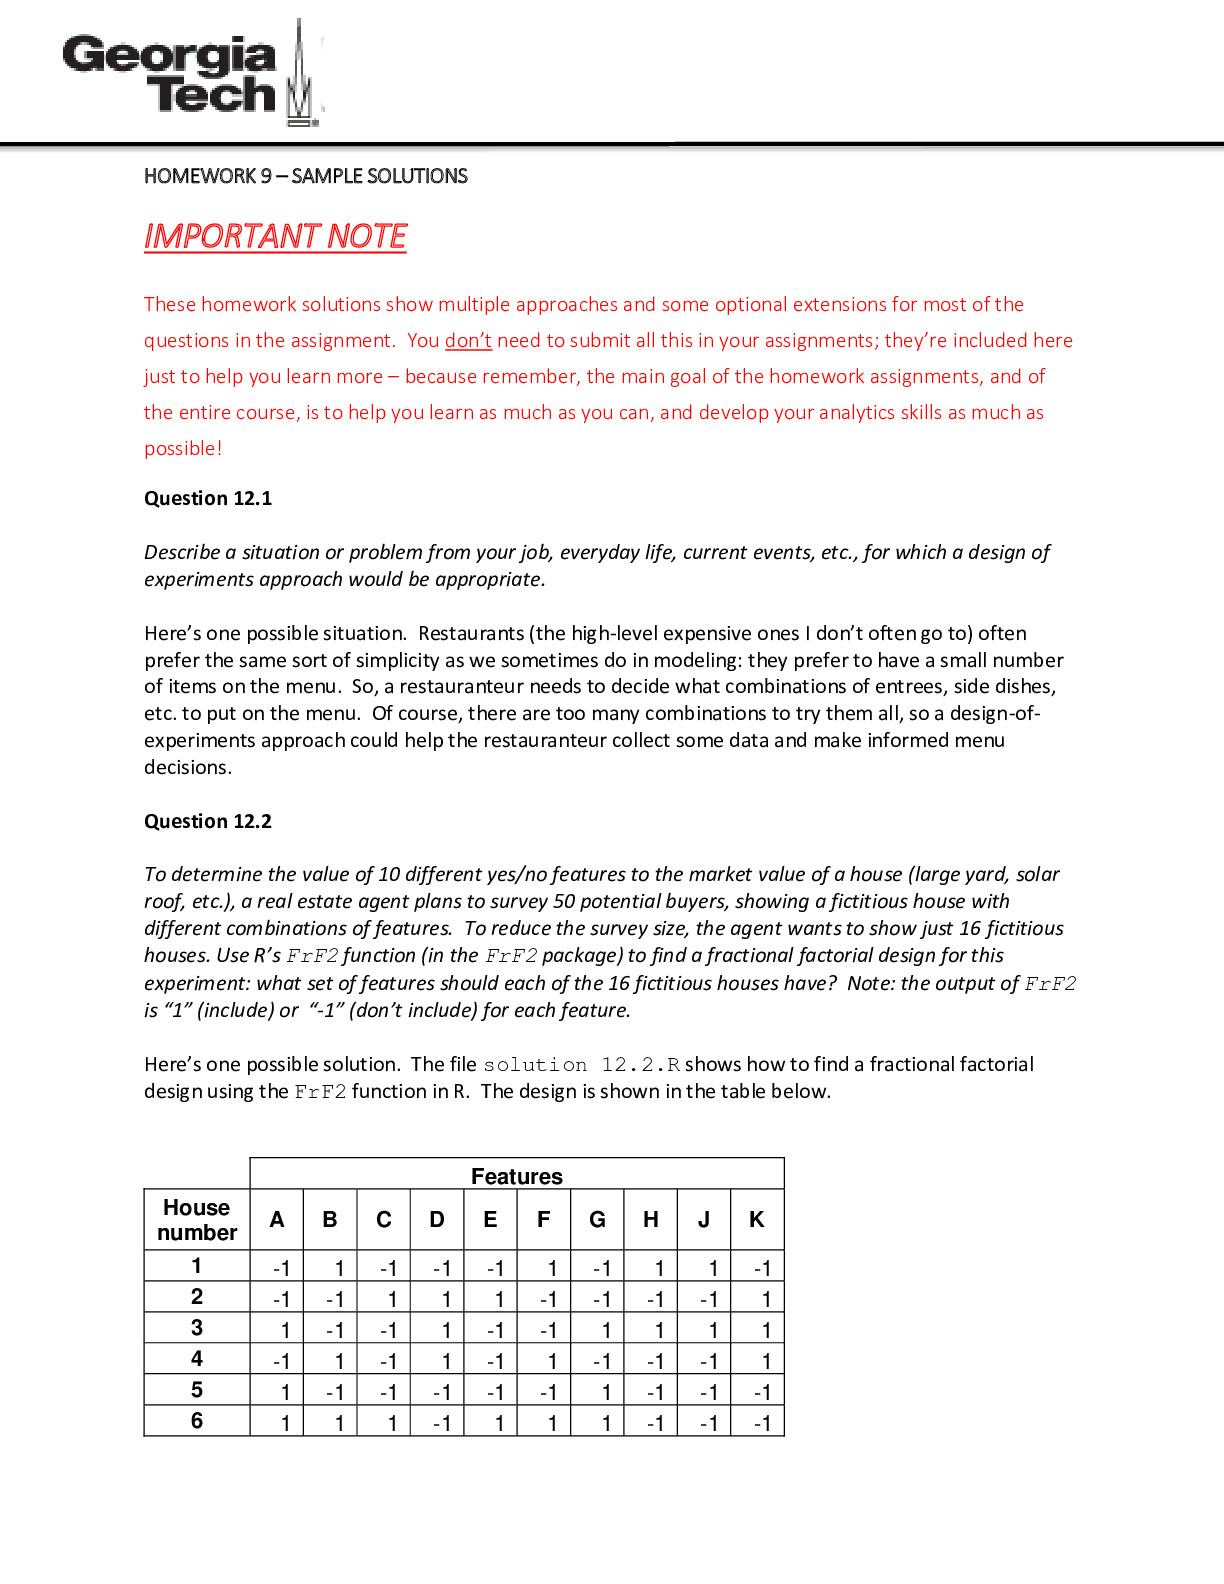
Question 12.2
To determine the value of 10 different yes/no features to the market value of a house (large yard, solar
roof, etc.), a real estate agent plans to survey 50 potential buyers, showing a fictitious house with
different combinations of features. To reduce the survey size, the agent wants to show just 16 fictitious
houses. Use R’s FrF2 function (in the FrF2 package) to find a fractional factorial design for this
experiment: what set of features should each of the 16 fictitious houses have? Note: the output of FrF2
is “1” (include) or “-1” (don’t include) for each feature.
Here’s one possible solution. The file solution 12.2.R shows how to find a fractional factorial
design using the FrF2 function in R. The design is shown in the table below.
Features
House
number A B C D E F G H J K
1 -1 1 -1 -1 -1 1 -1 1 1 -1
2 -1 -1 1 1 1 -1 -1 -1 -1 1
3 1 -1 -1 1 -1 -1 1 1 1 1
4 -1 1 -1 1 -1 1 -1 -1 -1 1
5 1 -1 -1 -1 -1 -1 1 -1 -1 -1
6 1 1 1 -1 1 1 1 -1 -1 -17 -1 -1 1 -1 1 -1 -1 1 1 -1
8 -1 1 1 1 -1 -1 1 -1 1 -1
9 1 -1 1 -1 -1 1 -1 -1 1 1
10 -1 -1 -1 1 1 1 1 -1 1 -1
11 1 1 -1 -1 1 -1 -1 -1 1 1
12 1 1 1 1 1 1 1 1 1 1
13 -1 1 1 -1 -1 -1 1 1 -1 1
14 -1 -1 -1 -1 1 1 1 1 -1 1
15 1 -1 1 1 -1 1 -1 1 -1 -1
16 1 1 -1 1 1 -1 -1 1 -1 -1
Note that due to differences in the random number generator, you might get slightly different results.
On a different machine, here’s another solution I got:
Features
House
number A B C D E F G H J K
1 -1 -1 1 -1 1 -1 -1 1 1 -1
2 1 -1 1 -1 -1 1 -1 -1 1 1
3 -1 -1 -1 1 1 1 1 -1 1 -1
4 1 1 -1 1 1 -1 -1 1 -1 -1
5 -1 1 -1 -1 -1 1 -1 1 1 -1
6 1 -1 -1 1 -1 -1 1 1 1 1
7 -1 1 -1 1 -1 1 -1 -1 -1 1
8 -1 1 1 1 -1 -1 1 -1 1 -1
9 1 -1 1 1 -1 1 -1 1 -1 -1
10 -1 -1 -1 -1 1 1 1 1 -1 1
11 1 -1 -1 -1 -1 -1 1 -1 -1 -1
12 -1 1 1 -1 -1 -1 1 1 -1 1
13 -1 -1 1 1 1 -1 -1 -1 -1 1
14 1 1 1 -1 1 1 1 -1 -1 -1
15 1 1 -1 -1 1 -1 -1 -1 1 1
16 1 1 1 1 1 1 1 1 1 1
Question 13.1
For each of the following distributions, give an example of data that you would expect to follow this
distribution (besides the examples already discussed in class).
a. BinomialIn a clinical trial, a new drug or treatment to cure a disease is tested on a bunch of patients.
Out of n total patients, the number successfully cured by the drug/treatment might follow
the binomial distribution.
b. Geometric
A consultant flies from New York to Atlanta early every Monday morning, arriving at 9am for
a 10:30am weekly meeting. The number of weeks the consultant will be on time before the
first time the flight is delayed long enough to miss the meeting, might follow the geometric
distribution.
c. Poisson
The expected number of babies that will be born in the United States tomorrow might
follow the Poisson distribution.
d. Exponential
The time between births of babies in the United States tomorrow might follow the
Exponential distribution.
e. Weibull
In training for track events, the length of time an athlete runs before having to stop might
follow the Weibull distribution. We would expect that k < 1: weaker athletes would last a
shorter amount of time, and stronger ones would last longer.
Question 13.2
In this problem, you can simulate a simplified airport security system at a busy airport. Passengers arrive
according to a Poisson distribution with λ1 = 5 per minute (i.e., mean interarrival rate 1 = 0.2 minutes) to
the ID/boarding-pass check queue, where there are several servers who each have exponential service
time with mean rate 2 = 0.75 minutes. [Hint: model them as one block that has more than one
resource.] After that, the passengers are assigned to the shortest of the several personal-check queues,
where they go through the personal scanner (time is uniformly distributed between 0.5 minutes and 1
minute).
Use the Arena software (PC users) or Python with SimPy (PC or Mac users) to build a simulation of the
system, and then vary the number of ID/boarding-pass checkers and personal-check queues to determine
how many are needed to keep average wait times below 15 minutes. [If you’re using SimPy, or if you
have access to a non-student version of Arena, you can use λ1 = 50 to simulate a busier airport.]
Here’s one possible solution. Please note that a good solution doesn’t have to try all of the possibilities
in the code; they’re shown to help you learn, but they’re not necessary.These solutions show both an ARENA model and a SimPy model; I suggest you look at both, just to get
familiar with the two of them.
ARENA VERSION
The file solution 13.2.doe contains the ARENA model for this problem. In the picture below:
(1) A “Create” block is used to model passenger arrivals to the system; they’re created as entities
that will go through the security system.
(2) From the passenger arrival block, they go to the ID and boarding pass check – because it’s a
queue, it’s a “Process” block. The line above the block is the queue where passengers wait until
it’s their turn if it’s animated.
(3) After the ID and boarding pass check, passengers go to the rhombus-shaped “Decide” block,
where they identify the scanner with the shortest queue, and go there.
(4) The four scanner “Process” blocks are queues, like the ID and boarding pass check.
(5) After finishing at a scanner, passengers leave the system. That’s a “Dispose” block; it tells the
system that it can dispose of the entity so it doesn’t need to track it anymore. (That’s especially
important if you have the student or trial version of Arena that can only handle 150 entities at a
time.)
[Show More]