Physics > QUESTIONS & ANSWERS > PSY 520 Topic 7 Exercise: Chapter 19 and 20-Latest Update (All)
PSY 520 Topic 7 Exercise: Chapter 19 and 20-Latest Update
Document Content and Description Below
Last updated: 3 years ago
Preview 1 out of 10 pages
Instant download
.png)
Buy this Document to get the Full Access Instantly
Provided by Students Who Aced it
We Verify Document Content to Gurantee Accuracy
Reviews( 0 )
Document information
Connected school, study & course
About the document
Uploaded On
Sep 07, 2022
Number of pages
10
Written in
All

Additional information
This document has been written for:
Uploaded
Sep 07, 2022
Downloads
0
Views
102
Document Keyword Tags
Recommended For You
Get more on QUESTIONS & ANSWERS »

Carleton UniversityECON 2030tbch19 CHAPTER 19 Asymmetric Infor...
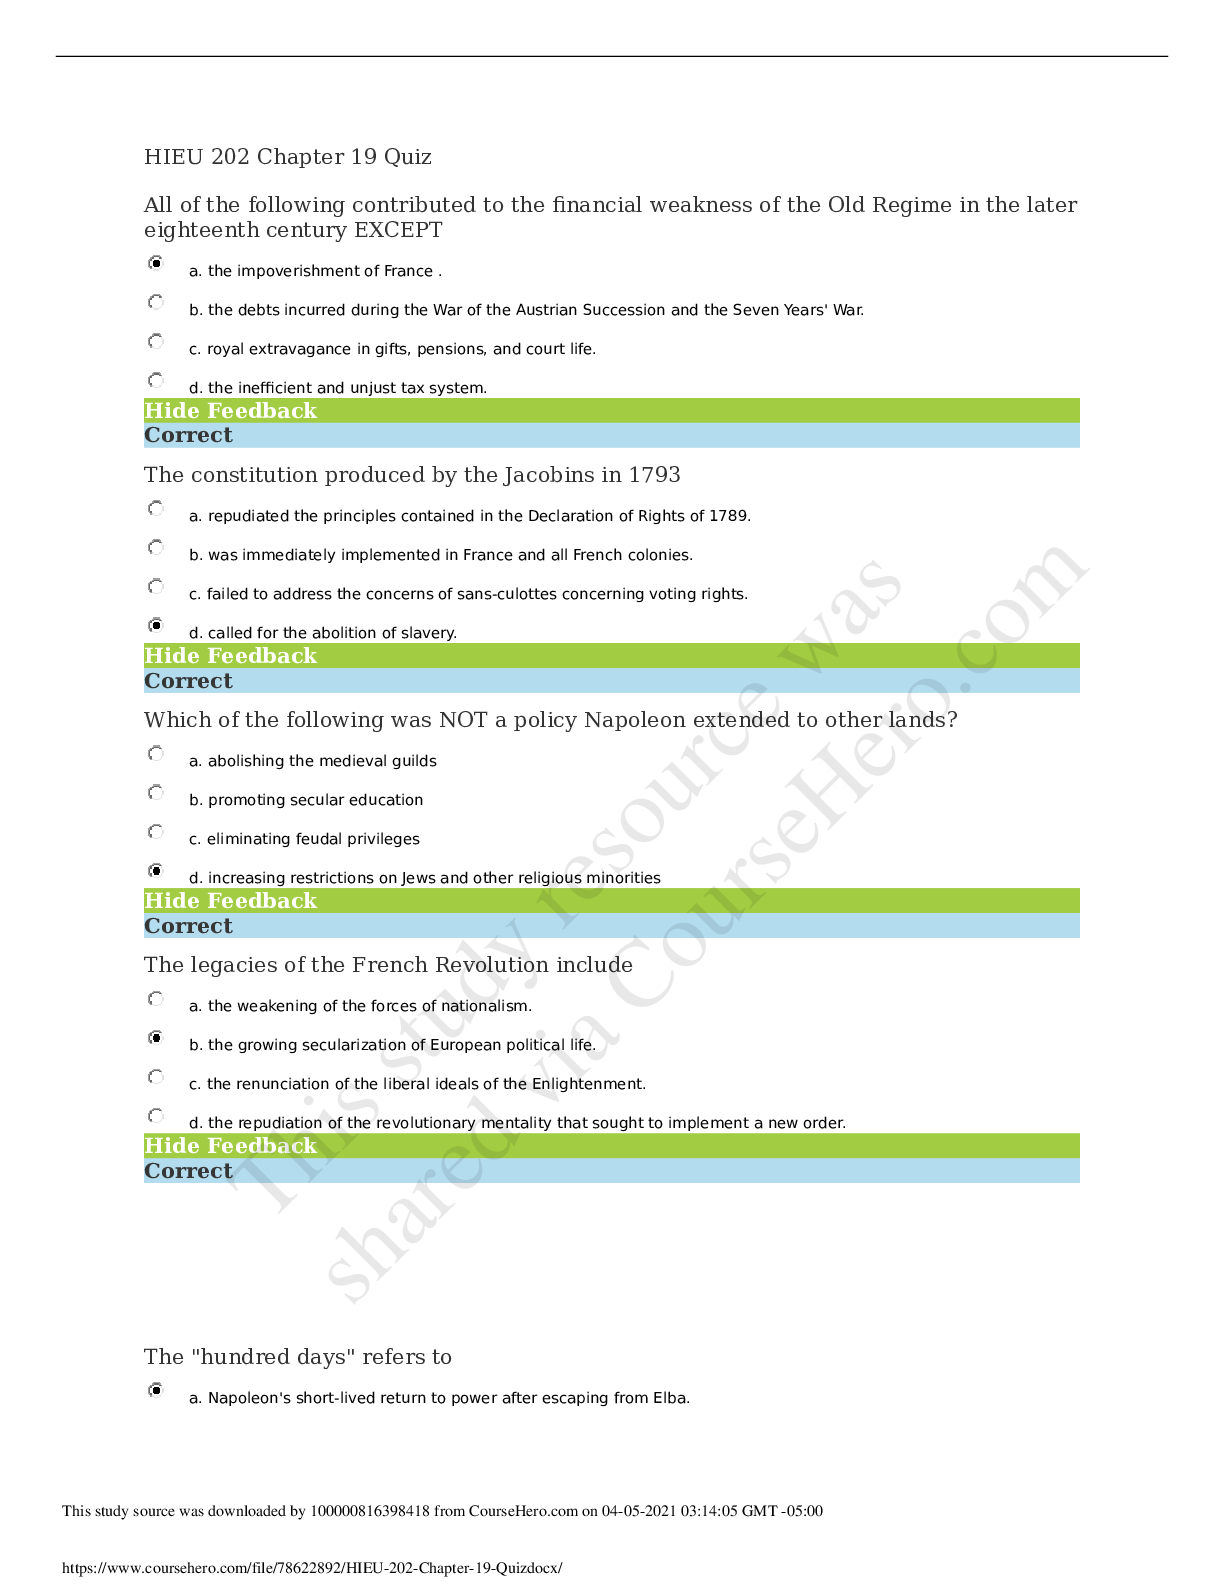
Liberty University - HIEU 202HIEU 202 Chapter 19 Quiz. ( ALL A...
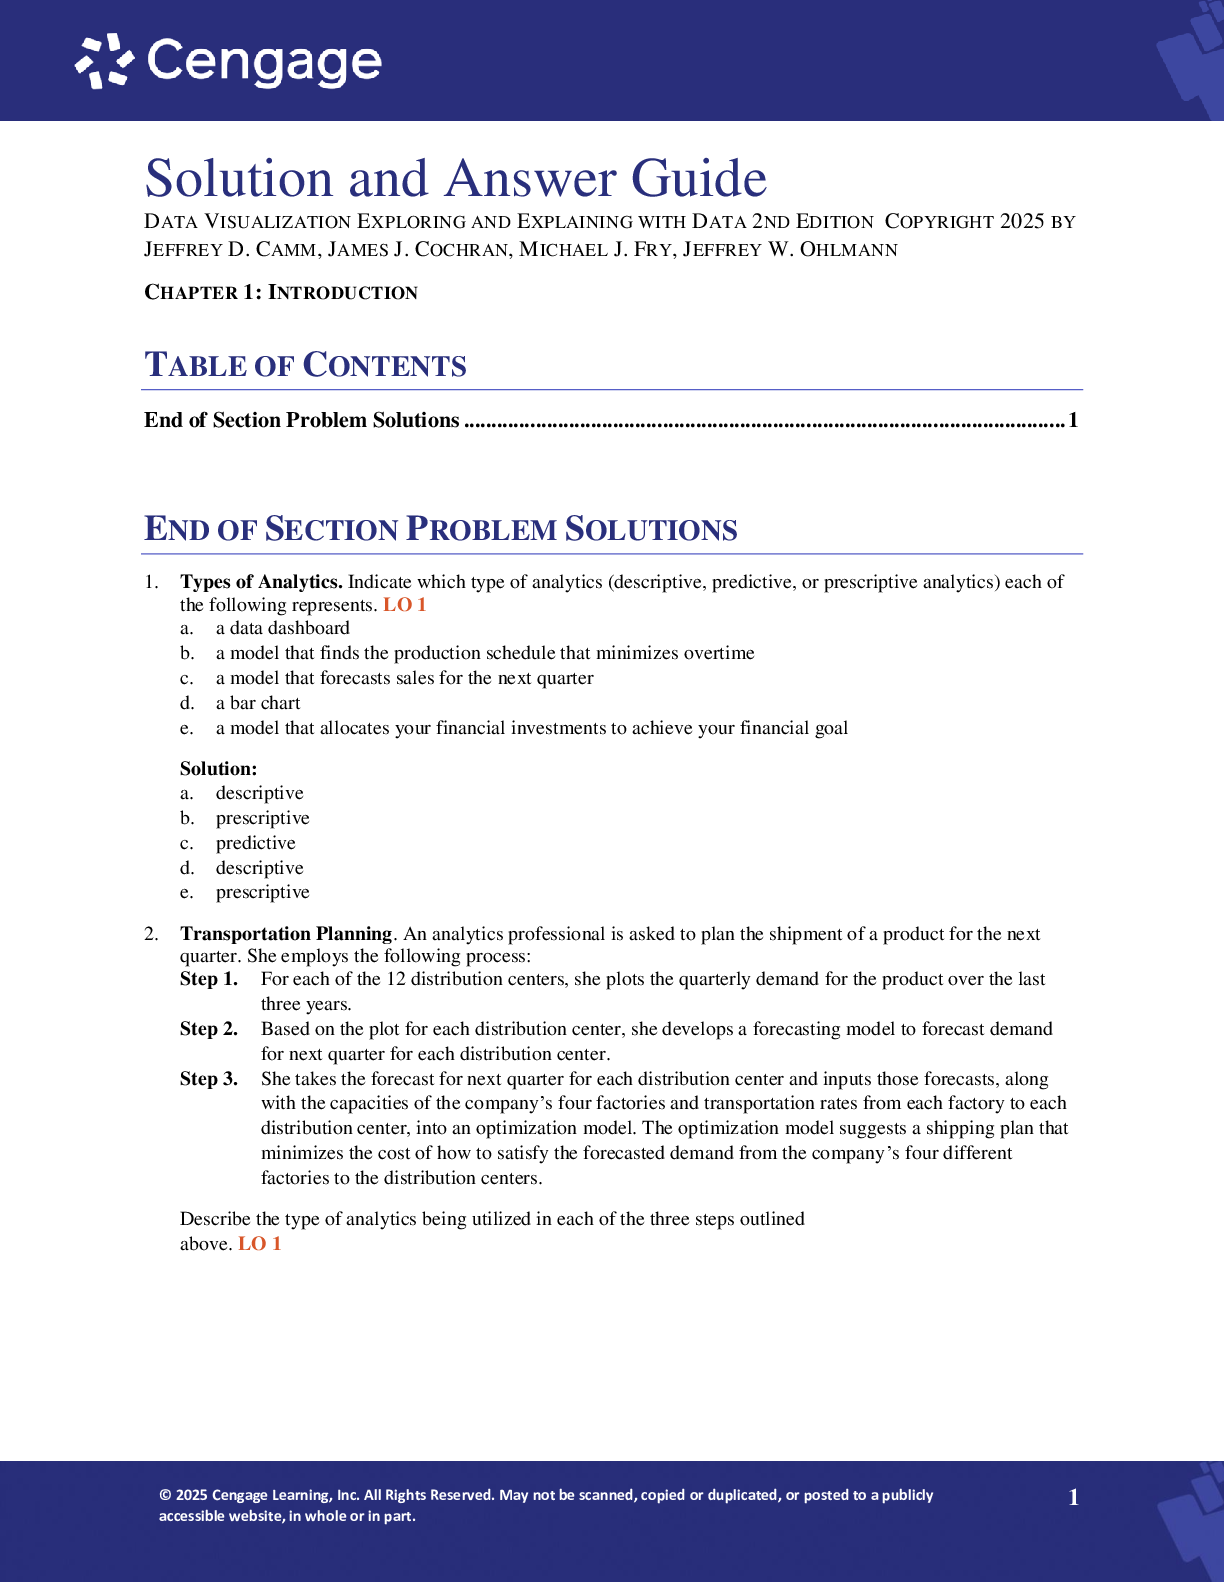
Solution Manual For Data Visualization Exploring and Explainin...
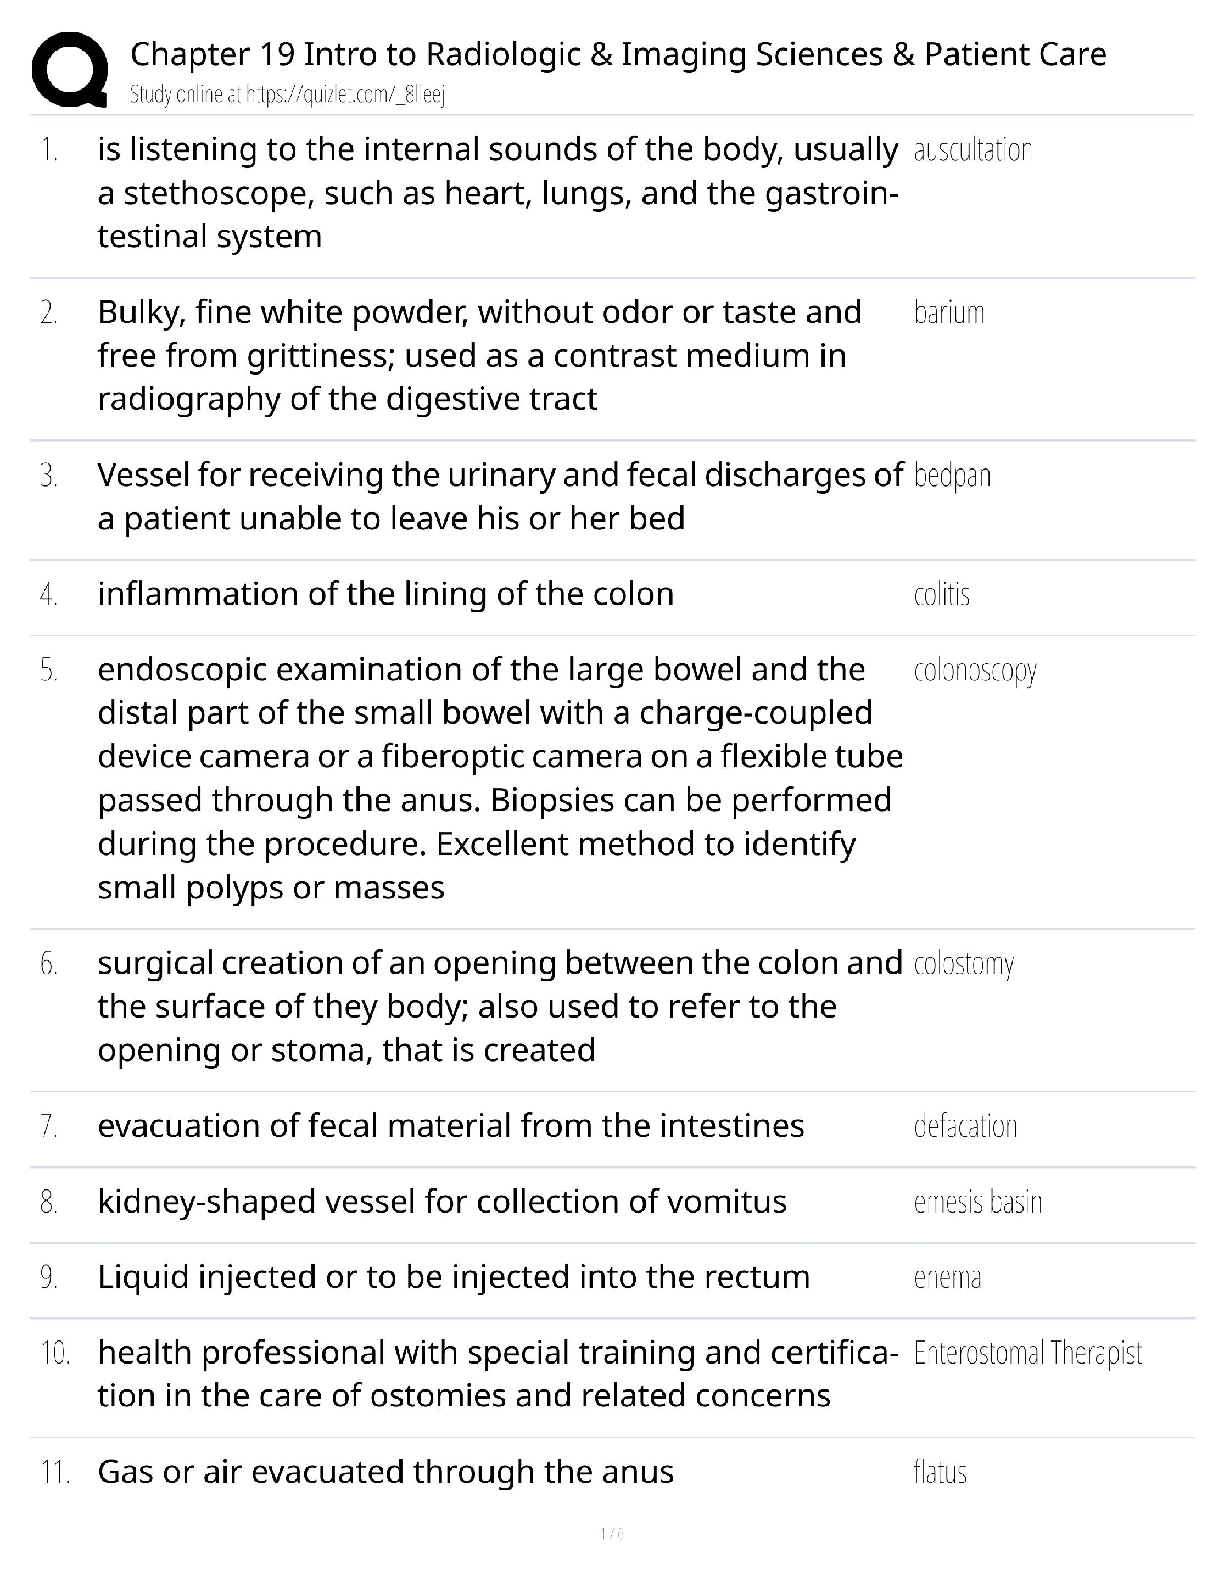
Radiology Chapter 19 / Nonaseptic Techniques Study Guide / 202...
.png)
TEST BANK Chapter 19 Thorax and Lungs: PHYSICAL EXAMINATION AN...
Chamberlain College of Nursing - BIO 255 chapter 19 LATEST UPD...
Solutions Manual for A First Course in Differential Equations...

TEST BANK for Computer Methods in Chemical Engineering 2nd Edi...

NUR 3065 | Chapter 19. Emergency Problems; Attempt Score; 100%
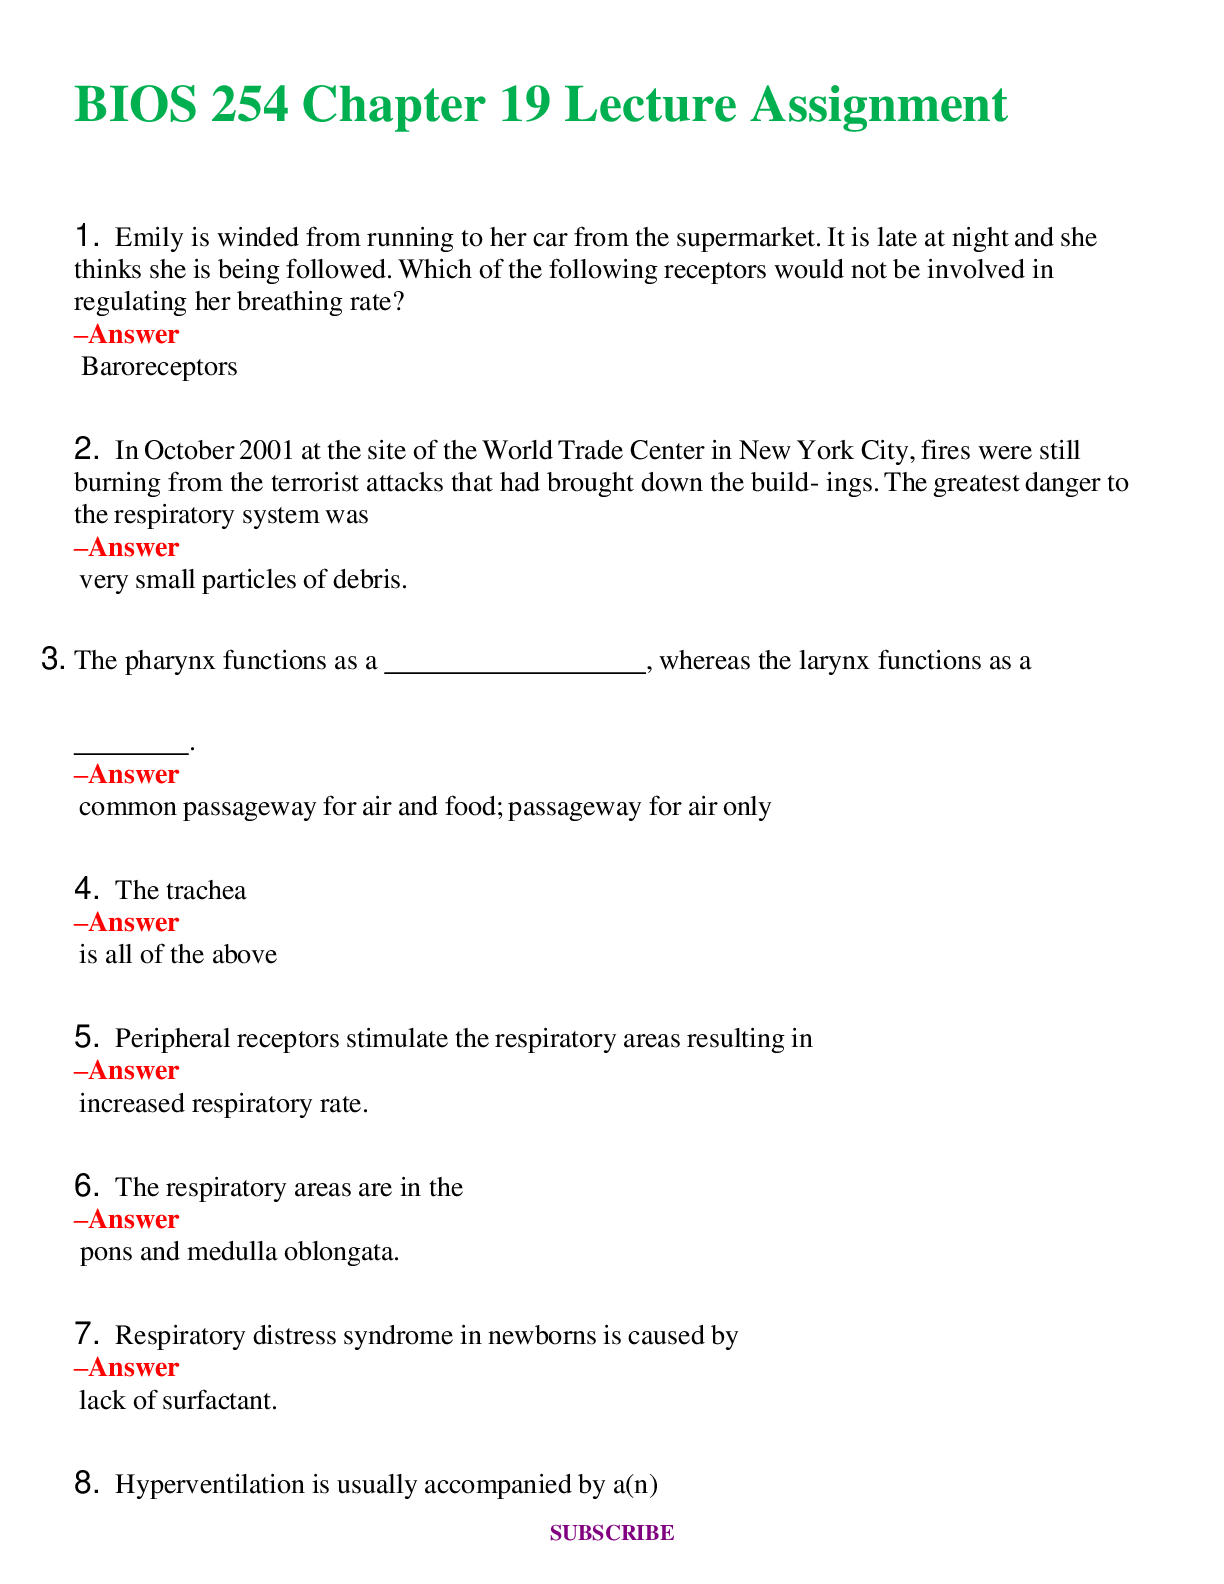
BIOS 254 Chapter 19 Lecture Assignment Questions and Answer...

NR601 / NR-601 Question Bank (Chapter 1 - Chapter 19): Primary...

BIOS242 / BIOS 242 Final Study Guide Chapter 1 -9 : Fundamen...


Southern Methodist University - CHEM 3372Chapter 19 Carboxylic...

Southern Methodist University - CHEM 3372SMU Chapter 19 Test