Operational Auditing > Summary > Table_Manipulation_and_Visualizations (All)
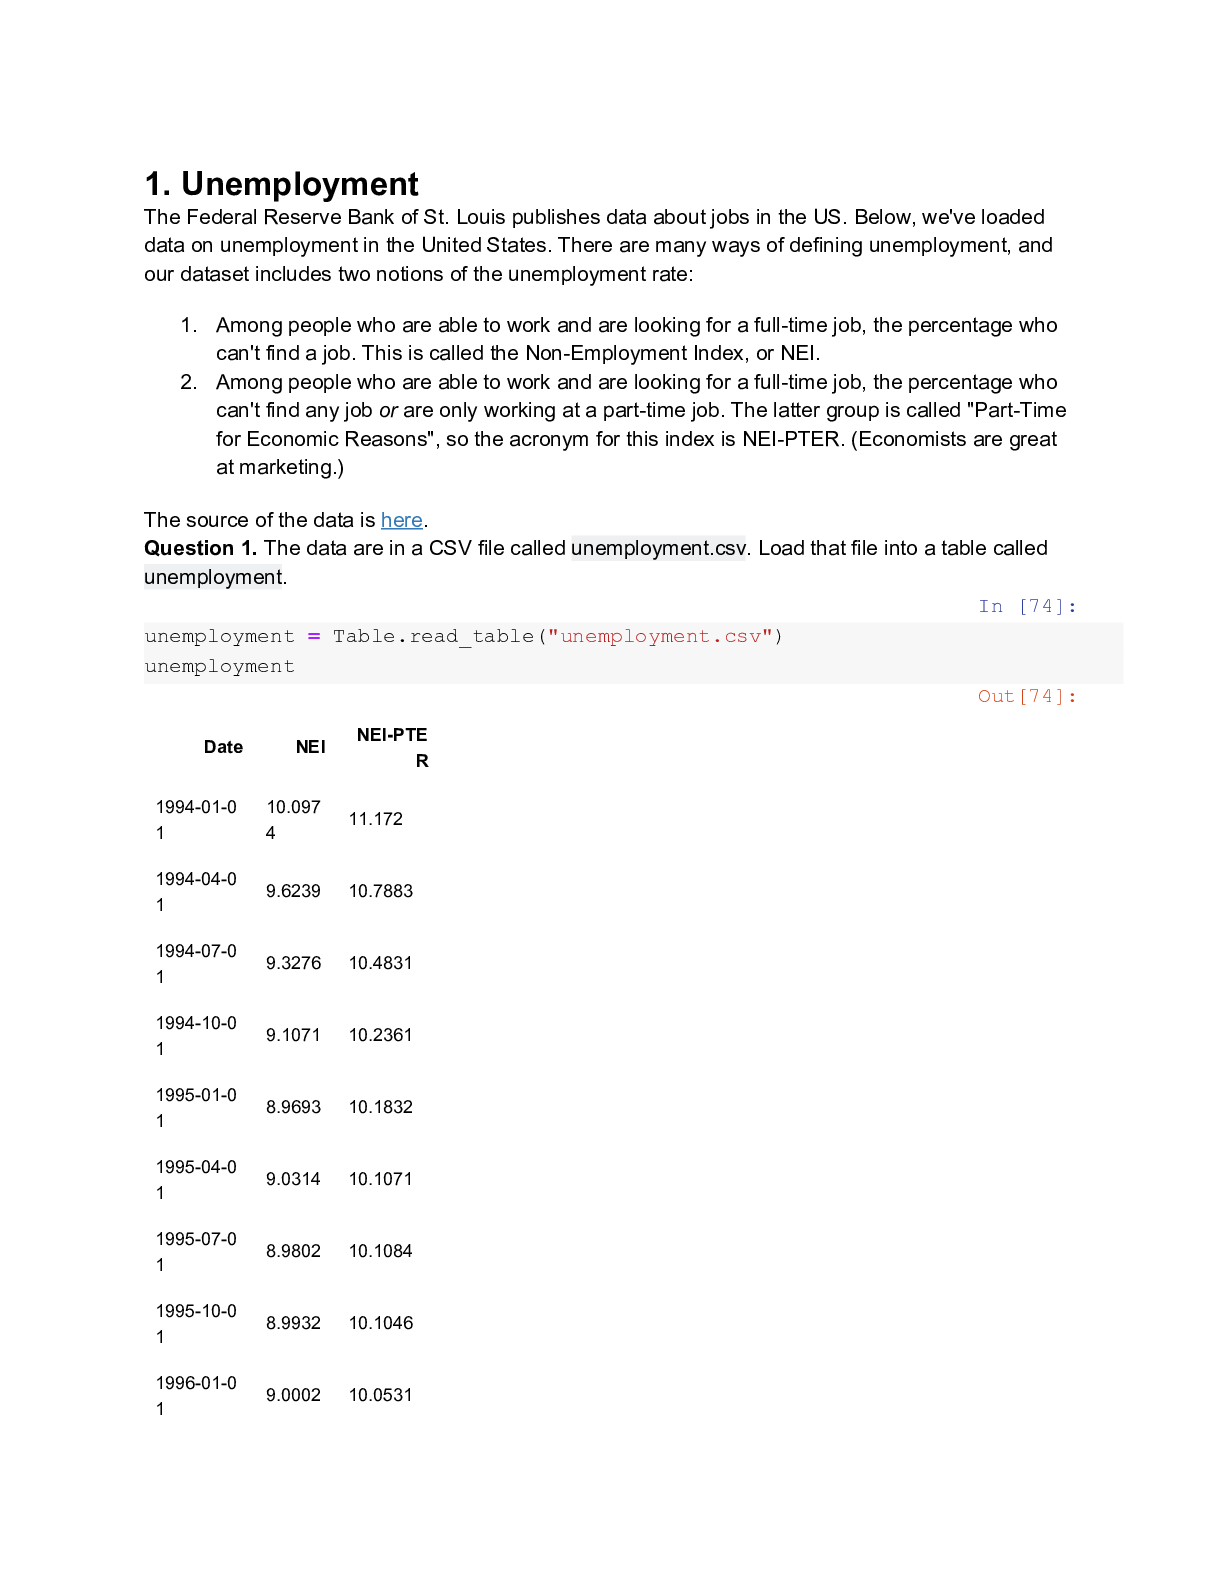
Table_Manipulation_and_Visualizations
Document Content and Description Below
Last updated: 3 years ago
Preview 1 out of 16 pages
Instant download
Buy this Document to get the Full Access Instantly
Provided by Students Who Aced it
We Verify Document Content to Gurantee Accuracy
Reviews( 0 )
Document information
Connected school, study & course
About the document
Uploaded On
Sep 13, 2022
Number of pages
16
Written in
All

Additional information
This document has been written for:
Uploaded
Sep 13, 2022
Downloads
0
Views
209
Document Keyword Tags
Recommended For You
Get more on Summary »
TEST BANK for Operating System Concepts, 10th Edition ISBN: 9...

Summary PN 2 STUDY REVIEW FOR FINAL EXAM (complete solution gu...

Summary PN1 Review/Blueprint for Final Exam Summer 2017 (compl...

NUR 2115 / NUR2115: Fundamentals of Professional Nursing Final...

NR603 / NR-603 Week 3 Quiz Topics (Latest): Advanced Clinical...

NR503 / NR 503: Final Quiz Concepts to Review (Latest 2021: Po...

NUR 2513 / NUR2513 Exam 1 Blue Print Updated: Maternal Child N...

Summary NSG 405 EXAM 1 Completed Study Guide > latest (Spring...
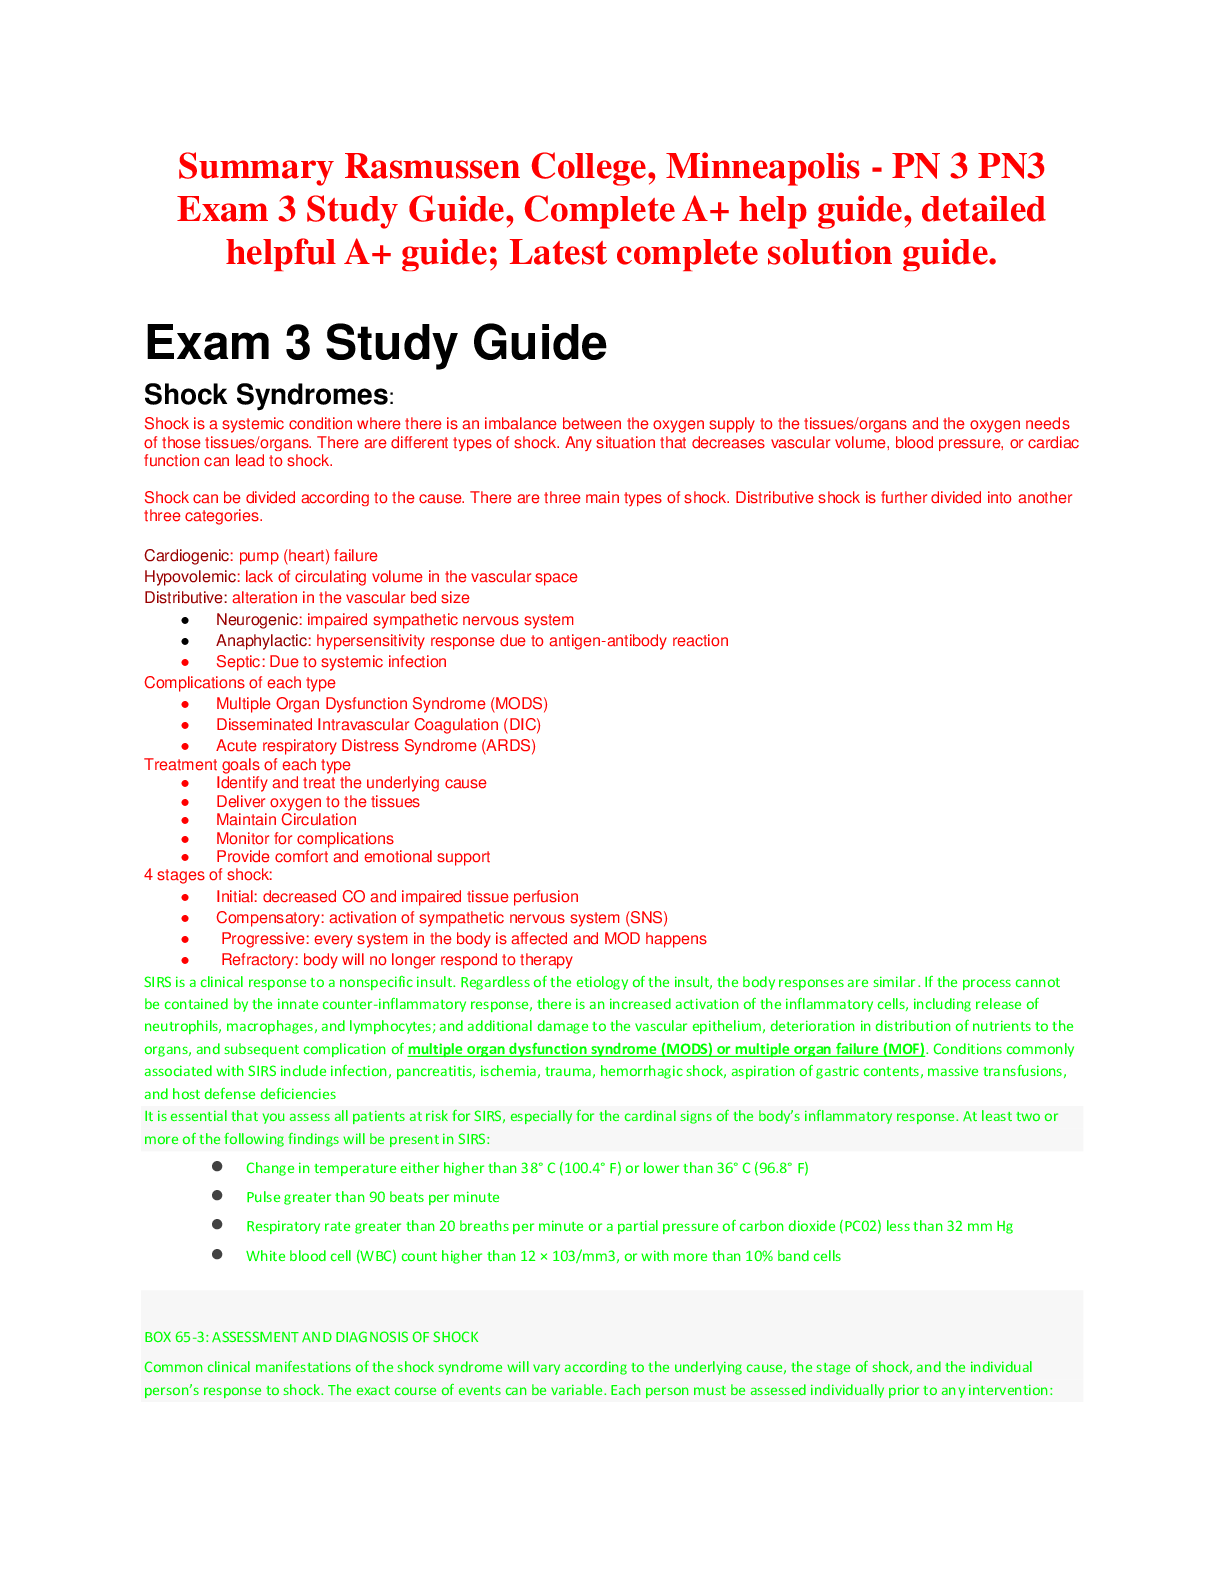
Summary Rasmussen College, Minneapolis - PN 3 PN3 Exam 3 Study...

Summary Med surg ATI (study guide; latest Fall 2020, A+ help


BIOS242 / BIOS 242 Final Study Guide Chapter 1 -9 : Fundamen...

NR566 / NR 566 Week 1 Notes (Latest): Advanced Pharmacology fo...
NUR2214 / NUR 2214: Nursing Care of the Older Adult Module 3 O...

NR603 / NR-603 Week 3 Summary Notes (Latest): Advanced Clinica...

NR603 / NR-603 Week 1 Summary Notes (Latest): Advanced Clinica...

NURS6521 / NURS 6521 Week 1 Summary Notes (Latest Update): Adv...

NR509 / NR 509 Week 5 Summary Notes (Latest): Advanced Physica...


