WGU C720 Complete OA Prep Guide Graded A+
Document Content and Description Below
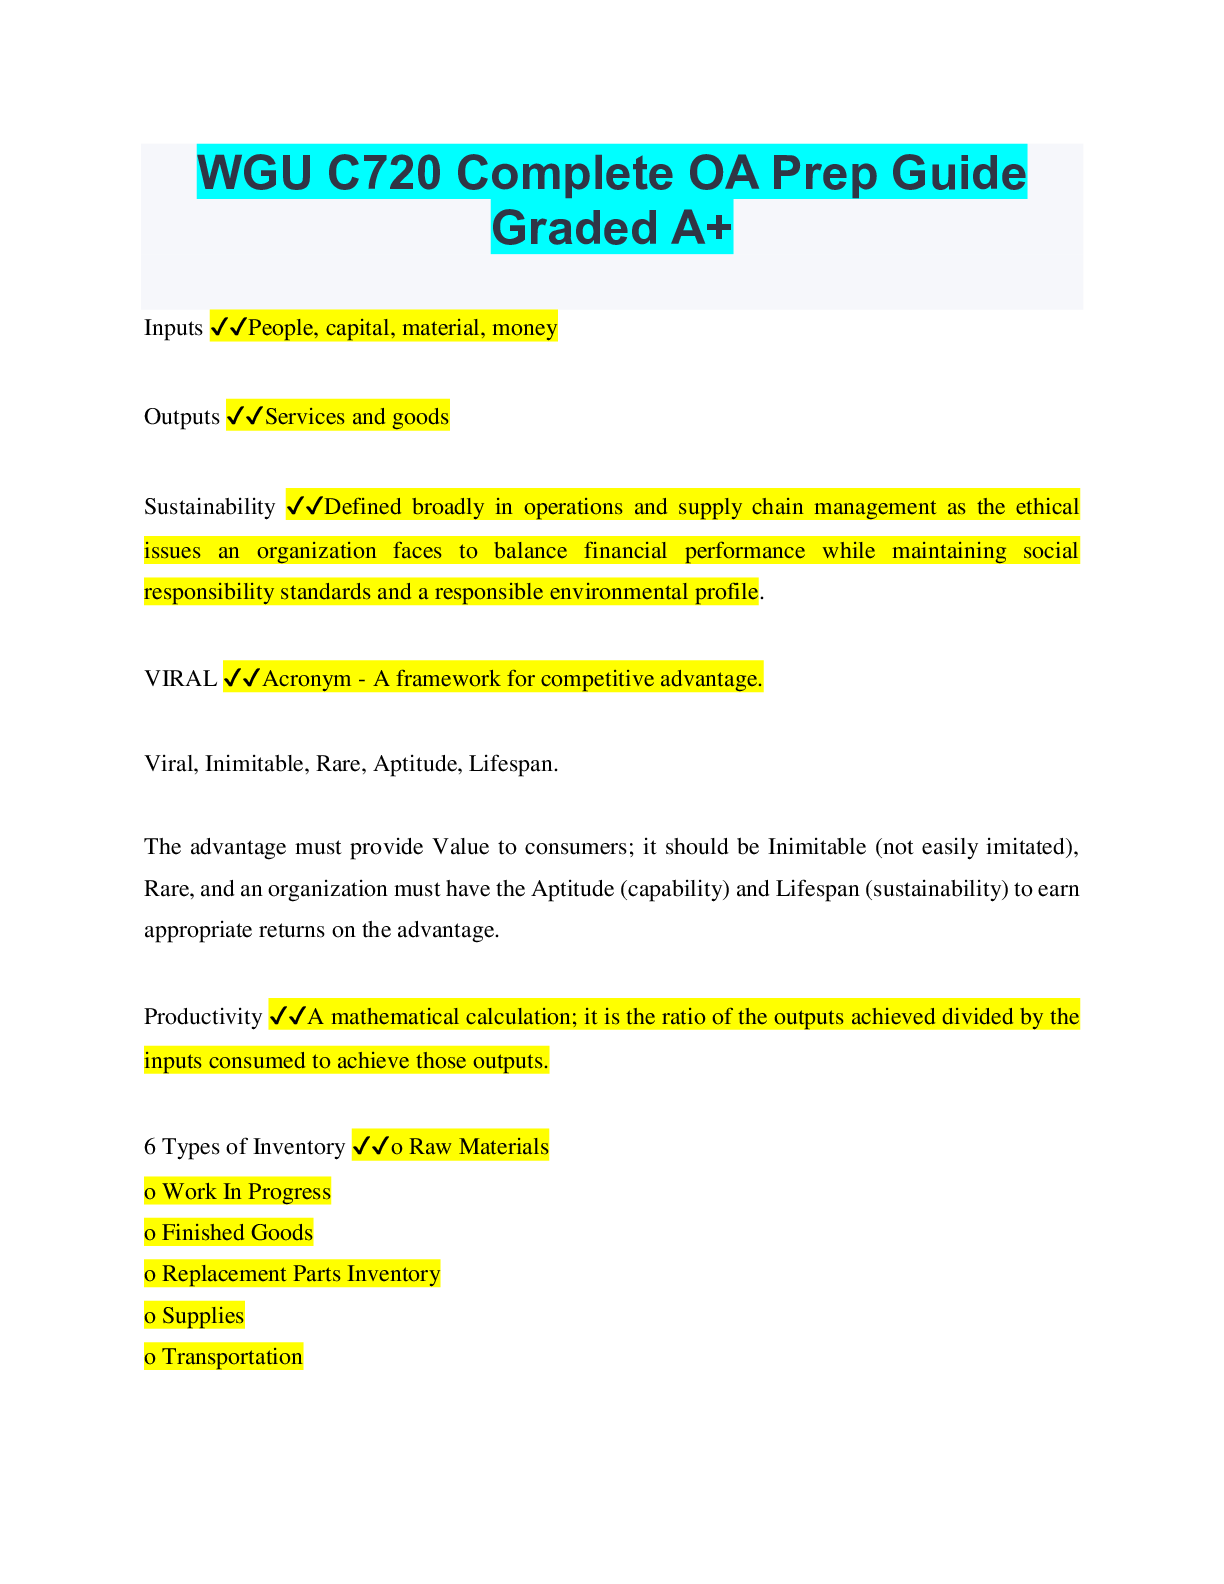
WGU C720 Complete OA Prep Guide
Graded A+
Inputs ✔✔People, capital, material, money
Outputs ✔✔Services and goods
Sustainability ✔✔Defined broadly in operations and supply chain managem
...
ent as the ethical
issues an organization faces to balance financial performance while maintaining social
responsibility standards and a responsible environmental profile.
VIRAL ✔✔Acronym - A framework for competitive advantage.
Viral, Inimitable, Rare, Aptitude, Lifespan.
The advantage must provide Value to consumers; it should be Inimitable (not easily imitated),
Rare, and an organization must have the Aptitude (capability) and Lifespan (sustainability) to earn
appropriate returns on the advantage.
Productivity ✔✔A mathematical calculation; it is the ratio of the outputs achieved divided by the
inputs consumed to achieve those outputs.
6 Types of Inventory ✔✔o Raw Materials
o Work In Progress
o Finished Goods
o Replacement Parts Inventory
o Supplies
o TransportationRaw Materials ✔✔These parts and materials are obtained from suppliers and are used in the
production process.
Work-in-process (WIP) ✔✔These are partly finished parts, components, sub-assemblies, or
modules.
Finished Goods ✔✔Items are ready to ship to the customer. No more work is required.
Replacement parts inventory ✔✔These are maintained to replace other parts in machinery or
equipment as those parts wear out
Supplies ✔✔Parts or materials are used to support the production process but not usually a
component of the product. These items, such as lubricant and cutting tools, are consumed in the
production process.
Transportation (pipeline): ✔✔The portion of inventory that is in the process of being shipped
through the distribution system.
4 Types of Demand ✔✔o Peak
o Seasonal
o Unexpected
o Chase
Peak Demand ✔✔Demand which occurs in response to planned events such as advertising,
publicity or promotion. The release of a popular game franchise's latest version often causes peak
demand for a few days or weeks.
Seasonal Demand ✔✔Demand as shoppers adjust their purchase velocity in line with holidays,
especially Christmas. But Halloween, Thanksgiving and even St. Patrick's Day also create seasonal
demand for certain kinds of merchandise.Unexpected Demand ✔✔Demand which occurs due to a usually-unexpected event. For example,
an underdog school may upset a favorite during the NCAA's basketball tournament, causing a run
on their merchandise.
Chase Demand ✔✔Demand that occurs when a company has to adjust production by rates to match
demand by varying the workforce and using overtime. Companies vary the workforce by adding
or reducing the number of employees on duty at any given time. And they may choose to provide
overtime by asking workers to stay on the job beyond their normally scheduled time.
Safety Stock ✔✔A cushion of inventory to protect against unexpected demand. In this way, they
can continue to meet customer demand without delays.
Stock Out ✔✔Occurs when inventory is depleted.
Perpetual Inventory System ✔✔Continuously monitors inventory levels and is also called a
continuous review system. Requires human input (i.e. cashier) and the ordering of more inventory
is triggered by reorder point.
o Requires an exact inventory balance at all times
o Best for big businesses, retail stores, or banks
o High value and high volume
o Expensive to implement and maintain
Periodic Inventory System ✔✔Randomly monitors inventory levels and is also called the fixed
order interval system.
o Requires a physical count periodically
o Used when a supplier will only deliver at specific time intervals
o Low value and volumeo Used for small businesses
o Inexpensive to implement and maintain
ABC analysis ✔✔Has been developed to determine which inventory items should receive the
highest level of control. By multiplying the dollar value of each item by its annual usage, a dollar
usage value can be obtained. Dollar usage follows the Pareto Principle in that frequently, only 20%
of all the items account for 80% of the total dollar usage, while the remaining items frequently
account for only 20% of the dollar usage. This principle leads to the _____ classification, which
is based on focusing efforts where the payoff is highest
Pareto Principle ✔✔Only 20% of all the items account for 80% of the total dollar usage, while the
remaining items frequently account for only 20% of the dollar usage. This principle leads to the
ABC classification, which is based on focusing efforts where the payoff is highest
Economic Order Quantity (EOQ) ✔✔For inventory that doesn't require production, when demand
is constant and known, when cost per unit does not depend on order quantity.
Most appropriate for retail stores or companies that order finished goods.
Economic Production Quantity (EPQ) ✔✔For inventory that will be used in production, When
incremental ordering and depletion of inventory is allowed, Also called production order quantity.
Most appropriate for manufacturing and production companies
The goal of firms using the EOQ & EPQ model ✔✔Minimize the total annual costs of ordering
and holding inventory by varying the order quantity.
Quantity discount model ✔✔A discount offered in price for ordering above a specified amountTransportation discounts ✔✔A discount offered on shipping cost for ordering above a specified
amount
Revenue Sharing ✔✔When 2 or more companies partner and divides the profits received based on
an agreement between all parties involved.
Reserve Capacity ✔✔When a company stores, or pays another company to store, excess inventory
to be used for unexpected demand
Quality ✔✔the degree to which a specific product conforms to its design characteristics or
specifications
The amount of a specific, desired attribute
The capacity to satisfy customers' needs
Consistently meeting or exceeding the customer's needs and expectations
Is everyone's responsibility in the organization
Internal orientation of quality ✔✔Directly measure characteristics of the product or service, such
as the number of packages delivered on time or the thickness of an engine part based on
manufactures specification.
External orientation of quality ✔✔Fitness for use for the customer or the capacity to satisfy
customer's needs.
Quality Function Deployment (QFD) ✔✔Taking customer expectations and transforming them
into specific actions designed to meet those expectations
Reliability ✔✔Ability to perform the promised service dependably and accurately.
Responsiveness ✔✔Willingness to help customers and provide prompt service.Assurance ✔✔Knowledge and courtesy of employees and their ability to convey trust and
confidence.
Empathy ✔✔Provision of caring, individualized attention to customers.
Tangibles ✔✔Appearance of physical facilities, equipment, personnel, and communication
materials, including access and effectiveness of Internet-based information.
Performance ✔✔Primary operating characteristics of a product.
Features ✔✔Secondary characteristics that supplement the product's basic functioning.
Reliability (quality of goods) ✔✔Length of time a product will function before it fails, or the
probability it will function for a stated period of time.
Conformance ✔✔Degree to which a product's design and operating characteristics match preestablished standards.
Durability ✔✔Ability of a product to function when subjected to hard and frequent use.
Serviceability ✔✔Speed, courtesy, and competence of repair.
Aesthetics ✔✔How a product looks, feels, sounds, tastes, or smells.
Perceived Quality ✔✔The image, advertising, or brand name of a product.
Crosby ✔✔Used the phrase "Do it right the first time."
Wrote a book in 1979 entitled "Quality is Free"Concept of zero defects as a measurable object Emphasized the importance of considering all costs
of quality
Juran ✔✔Focus was on the customer's perception of quality
Quality must be built on three elements:
o Quality planning
o Quality control
o Quality improvement.
Focused on Fitness for use and Pareto Principle
Taguchi ✔✔Used Robust Design
Parabolic Quality Loss Function
Perfecting of experiments to create higher quality products and processes
Argues that quality must be designed into a product
Deming ✔✔Had a 14-point quality plan
Statistical Process Control (SPC)
"System" caused defects, not employees
Endorsed the elimination of fear in the organization Modified Walter Shewart's Plan-Do-CheckAct (PDCA) to Plan-Do-Study-Analyze (PDSA)
Ishikawa ✔✔Developed Fishbone Chart (cause and effect diagram) Teamwork is essential for
quality leadership
Developed quality circles to solve problems lead by a champion (sr. manager) to oversee &
approve
Benchmarking ✔✔Process by which a company compares its performance to the performance of
other companies.The Plan-Do-Check-Act Cycle ✔✔Also referred to as the Deming Wheel or Shewhart Cycle.
o Plan - Make sure everything is documented and make a plan of action
o Do - Implement the plan and document changes
o Check - Analyze to see if goals have been achieved
o Act - Standardize the changes and communicate the results. This is a cycle, back to the beginning.
Statistical process control (SPC) ✔✔The use of statistical methods to determine when a process
that produces a good or service is getting close to producing an unacceptable level of defects.
Cause-and-effect diagrams or fishbone diagrams or Ishikawa diagrams ✔✔Show the impact of
various inputs into the result of a process. They help organizations isolate the root causes of
problems such as bottlenecks in their processes.
Check sheets ✔✔The means used to record data points in real-time at the site where the data is
generated. This is often the first tool used to assess a process and often the data is "raw" meaning
it is straight from the source and without any interpretation.
Control charts ✔✔Graphical depictions of process output where the raw data is plotted in realtime within upper (UCL) and lower control limits (LCL).
Run charts ✔✔Form of control chart plotted in real-time for processes that might have common
features, a common scale, or some form of central tendency
Histograms (or box chart) ✔✔Demonstrate the frequency of data observations within
[Show More]
Last updated: 3 years ago
Preview 1 out of 22 pages
