Week 8 Stats Assignment- Performing Linear Regressions with Technology –Exel
Determine the best fit linear regression equation using Technology - Excel
Question
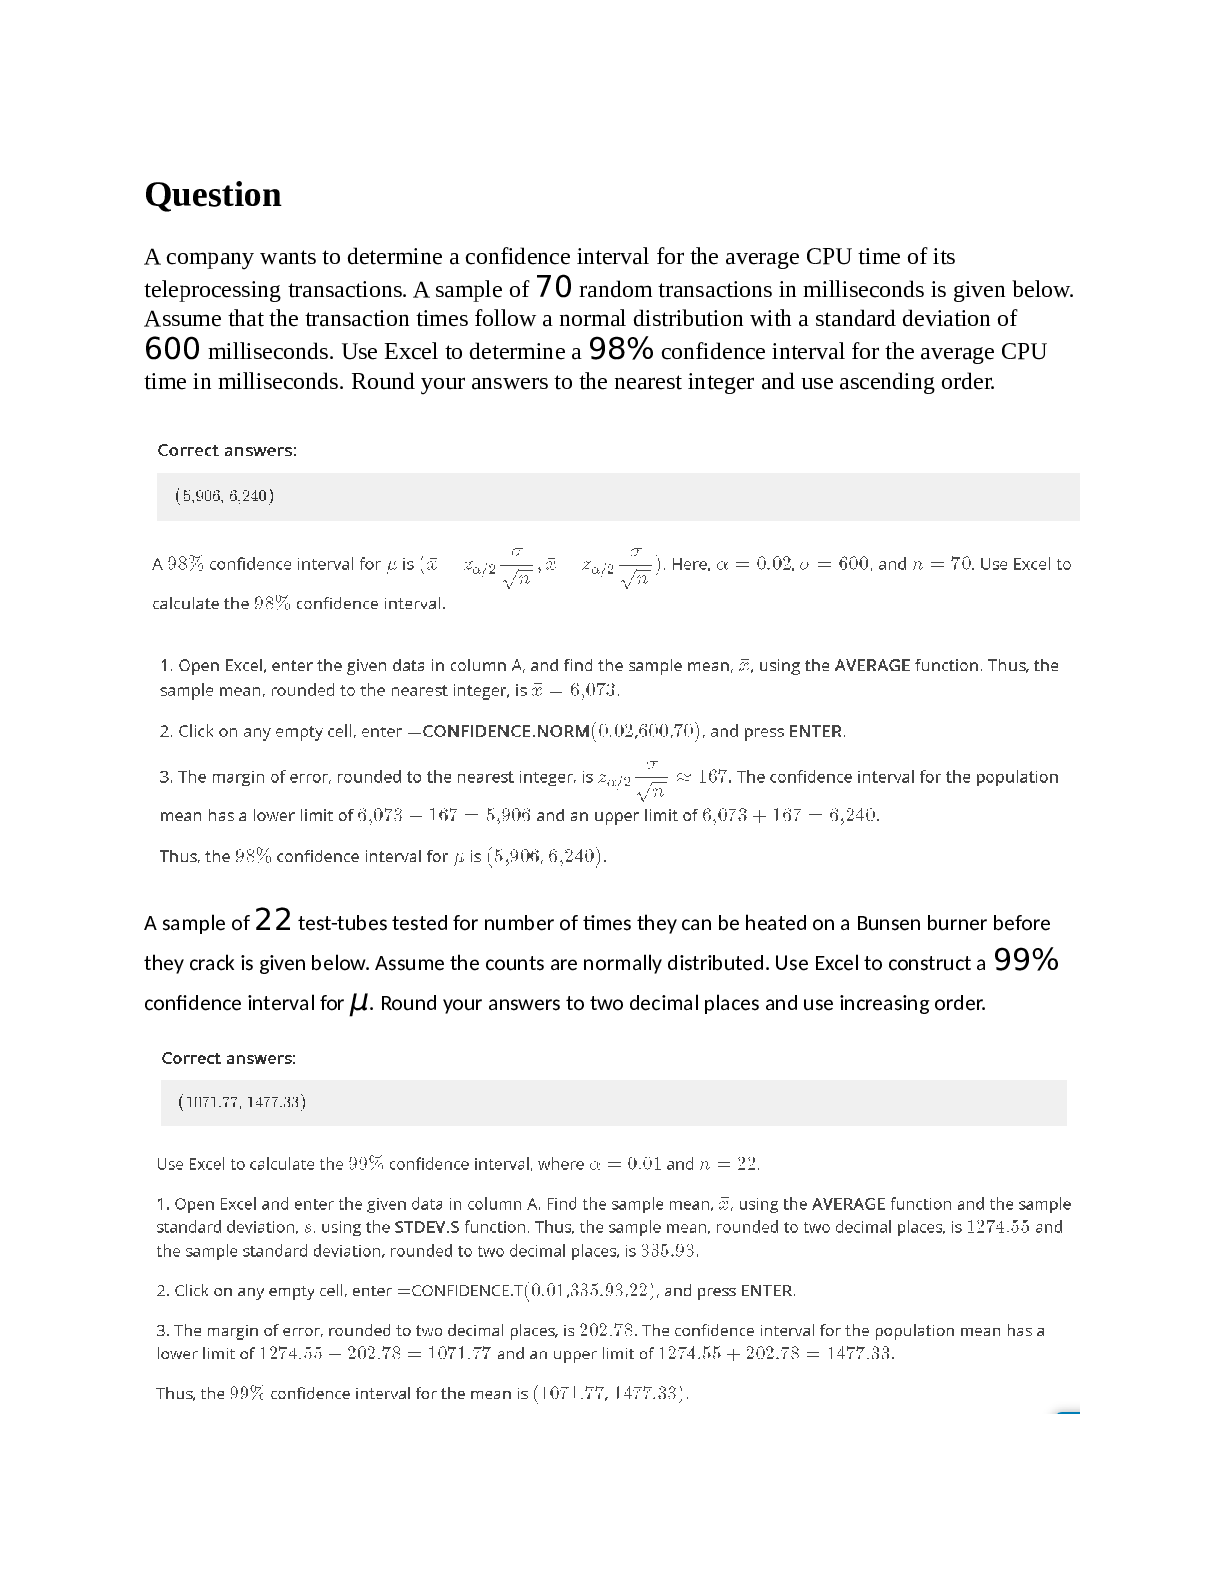
The table below shows data on annual expenditure, x (i
...
Week 8 Stats Assignment- Performing Linear Regressions with Technology –Exel
Determine the best fit linear regression equation using Technology - Excel
Question
The table below shows data on annual expenditure, x (in dollars), on recreation and annual income, y (in dollars), of 20 families. Use Excel to find the best fit linear
regression equation. Round the slope and intercept to the nearest integer. y=11.0 X+ 14949 Yes that's right. Keep it up!
Calculate the correlation coefficient using Technology - Excel
Question
An economist is studying the link between the total value of a country's exports and
that country's gross domestic product, or GDP. The economist recorded the GDP and Export value (in millions of $'s) for 30nations for the same fiscal year. This sample data is provided below.
Correct answers:
r= 0.49 Great work! That's correct.
Calculate the correlation coefficient using Technology - Excel
Question
An economist is trying to understand whether there is a strong link between CEO pay ratio and corporate revenue. The economist gathered data including the CEO
pay ratio and corporate revenue for 30 companies for a particular year. The pay
ratio data is reported by the companies and represents the ratio of CEO compensation to the median employee salary. The data are provided below. Use
Excel to calculate the correlation coefficient r between the two data sets. Round
your answer to two decimal places.
Correct answers:
r= −0.17 Yes that's right. Keep it up!
Determine the best fit linear regression equation using Technology - Excel
Question
The table below gives the average weight (in kilograms) of certain people ages 1–
20. Use Excel to find the best fit linear regression equation, where age is the explanatory variable. Round the slope and intercept to two decimal places. y
= 2.89 x + 4.69. Perfect. Your hard work is paying off
Determine the best fit linear regression equation using Technology - Excel
Question
In the following table, the age (in years) of the respondents is given as the x value, and the earnings (in thousands of dollars) of the respondents are given as
the y value. Use Excel to find the best fit linear regression equation in thousands of dollars. Round the slope and intercept to three decimal places. y = 0.433 x
+ 24.493 Perfect. Your hard work is paying off
Determine the best fit linear regression equation using Technology - Excel
Question
The heights (in inches) and weights (in pounds) of 25 baseball players are given below. Use Excel to find the best fit linear regression equation, where height is the explanatory variable. Round the slope and intercept to two decimal places. y
= 6.53 x - 275.47 Well done! You got it right.
Calculate the correlation coefficient using Technology - Excel
Question
A market researcher looked at the quarterly sales revenue for a large e-commerce store and for a large brick-and-mortar retailer over the same period. The
researcher recorded the revenue in millions of dollars for 30 quarters. The data
are provided below. Use Excel to calculate the correlation coefficient rbetween the
two data sets. Round your answer to two decimal places. Correct answers:
Calculate the correlation coefficient using Technology - Excel
Question
An amateur astronomer is researching statistical properties of known stars using a variety of databases. They collect the absolute magnitude or MV and stellar mass or M⊙ for 30 stars. The absolute magnitude of a star is the intensity of light that
would be observed from the star at a distance of 10 parsecs from the star. This is
measured in terms of a particular band of the light spectrum, indicated by the subscript letter, which in this case is V for the visual light spectrum. The scale is logarithmic and an MV that is 1 less than another comes from a star that
is 10 times more luminous than the other. The stellar mass of a star is how many
times the sun's mass it has. The data is provided below. Use Excel to calculate the correlation coefficient rbetween the two data sets, rounding to two decimal places. Correct answers:
r= −0.93 Yes that's right. Keep it up!
Calculate the correlation coefficient using Technology - Excel
Question
An owner of a large car lot believes that fuel prices are going to rise significantly and wonders how this rise might affect demand for the high performance vehicles. Specifically, the owner is investigating a link between how fast a car can go
from 0 to 60 miles per hour (measured in seconds) and the car's economy as measured in miles traveled per gallon used (mpg). If fast cars, which are normally
high in demand, are associated with higher mpg then there will be much less demand if gas prices rise as predicted. The owner gathers data on 20 vehicles. The data is provided below. Use Excel to calculate the correlation coefficient rbetween
the two data sets. Round your answer to two decimal places.
"mpg" 0 to 60 time (seconds)
28 7.7
25 8.2
25 8.6
22 7.4
22 8 ................... correlation r = 0.33
Explanation:
Copy and paste the data into excel sheet mpg data in column A from A1:A20
time data in column B from B1:B20
using excel function CORREL(array1, array2) we get
r = CORREL(A1:A20, B1:B20)
r = 0.33. Yes that's right. Keep it up! The correlation coefficient can be calculated easily with Excel using the built-in CORREL function.
1. Open the accompanying data set in Excel.
2. In an open cell, type "=CORREL(A2:A21,B2:B21)", and then hit ENTER.
You could label the result of this cell by writing "Correlation coefficient" or "r" in an adjacent open cell.The correlation coefficient, rounded to two decimal places,
is r≈0.33.
Calculate the correlation coefficient using Technology - Excel
Question
A researcher is interested in whether the variation in the size of human beings is proportional throughout each part of the human. To partly answer this question they looked at the correlation between the foot length (in millimeters) and height
(in centimeters) of 30 randomly selected adult males. The data is provided below.
Use Excel to calculate the correlation coefficient r between the two data sets.
Round your answer to two decimal places.
Correct answers:
r= 0.50 Correct! You nailed it.
The correlation coefficient can be calculated easily with Excel using the built-in CORREL function.
1. Open the accompanying data set in Excel.
2. In an open cell, type "=CORREL(A2:A31,B2:B31)", and then hit ENTER.
You could label the result of this cell by writing "Correlation coefficient" or "r" in an adjacent open cell. The correlation coefficient, rounded to two decimal places,
is r≈0.50.
[Show More]