Mathematics > EXAM > MATH 225N Week 8 Assignment Linear Regression Equations | Questions and Answer elaborations | Alread (All)
MATH 225N Week 8 Assignment Linear Regression Equations | Questions and Answer elaborations | Already GRADED A
Document Content and Description Below
Last updated: 3 years ago
Preview 1 out of 30 pages
Instant download

Buy this Document to get the Full Access Instantly
Provided by Students Who Aced it
We Verify Document Content to Gurantee Accuracy
Also available in bundle (1)
Click Below to Access Bundle(s)

MATH 225N Week 8 Bundle: Homework Assignments, Discussion, Final Exam
MATH 225N Week 8 Assignment: Correlation and Causation MATH-225N Week 8 Assignment: Performing Linear Regressions with Technology – Exel MATH 225N Week 8 Assignment: Coefficient of Determination...
By BestSeller_ScholarFriends 3 years ago
$14.5
8
Reviews( 0 )
Document information
Connected school, study & course
About the document
Uploaded On
Oct 20, 2022
Number of pages
30
Written in
All
Seller

Reviews Received
Additional information
This document has been written for:
Uploaded
Oct 20, 2022
Downloads
0
Views
113
Document Keyword Tags
Recommended For You
Get more on EXAM »

MATH 225N Final Exam 2 - Question and Answers 2020/2021

MATH 225N Week 4 Statistics Quiz 2020 – Chamberlain College of...
MATH 225N Statistics Final EXAM (2020) – Chamberlain College o...
MATH 225N STATISTIC FINAL - CHAMBERLAIN COLLEGE OF NURSING
MATH 225N Week 6 Assignment Understanding Confidence Intervals...
Chamberlain College of Nursing MATH 225N Week 5 Assignment: Ce...

Chamberlain College of NursingMATH 225N MATHWeek 7 Assignment...
MATH 225N Week 3 Lab Assignment: Adolescents First Tobacco Pro...
CHAMBERLAIN COLLEGE OF NURSING - MATH 225N STATISTIC FINAL
Solution Manual for A First Course in Probability 10th Edition...
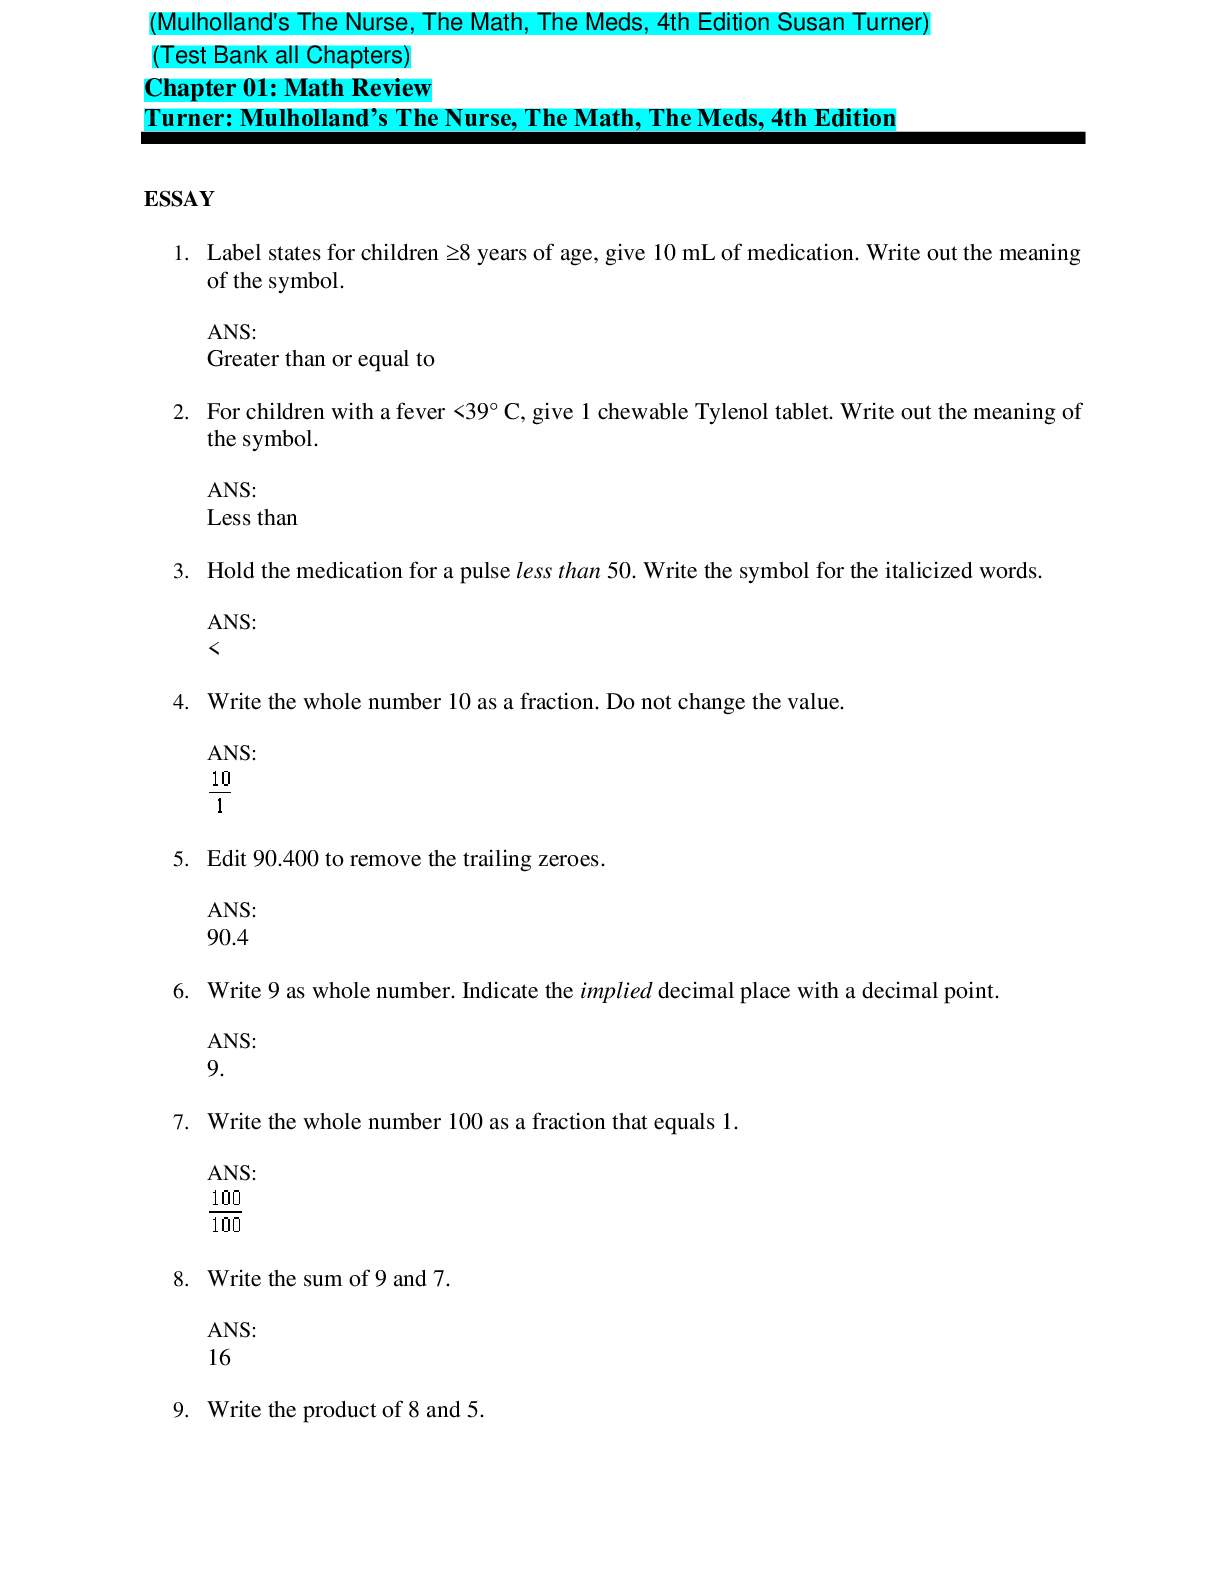
Mulholland's The Nurse, The Math, The Meds 4th Edition By Susa...

Solution Manual for A First Course in Probability 10th Edition...

Solutions Manual For A First Course in Probability 9th Edition...