Health Care > EXAM > IHI QI 104 / 100% VERIFIED SOLUTIONS (All)
IHI QI 104 / 100% VERIFIED SOLUTIONS
Document Content and Description Below
Last updated: 3 years ago
Preview 1 out of 3 pages
Instant download

Buy this Document to get the Full Access Instantly
Provided by Students Who Aced it
We Verify Document Content to Gurantee Accuracy
Also available in bundle (1)
Click Below to Access Bundle(s)

IHI QI:104 / EXAM / 100% CORRECT ANSWERS
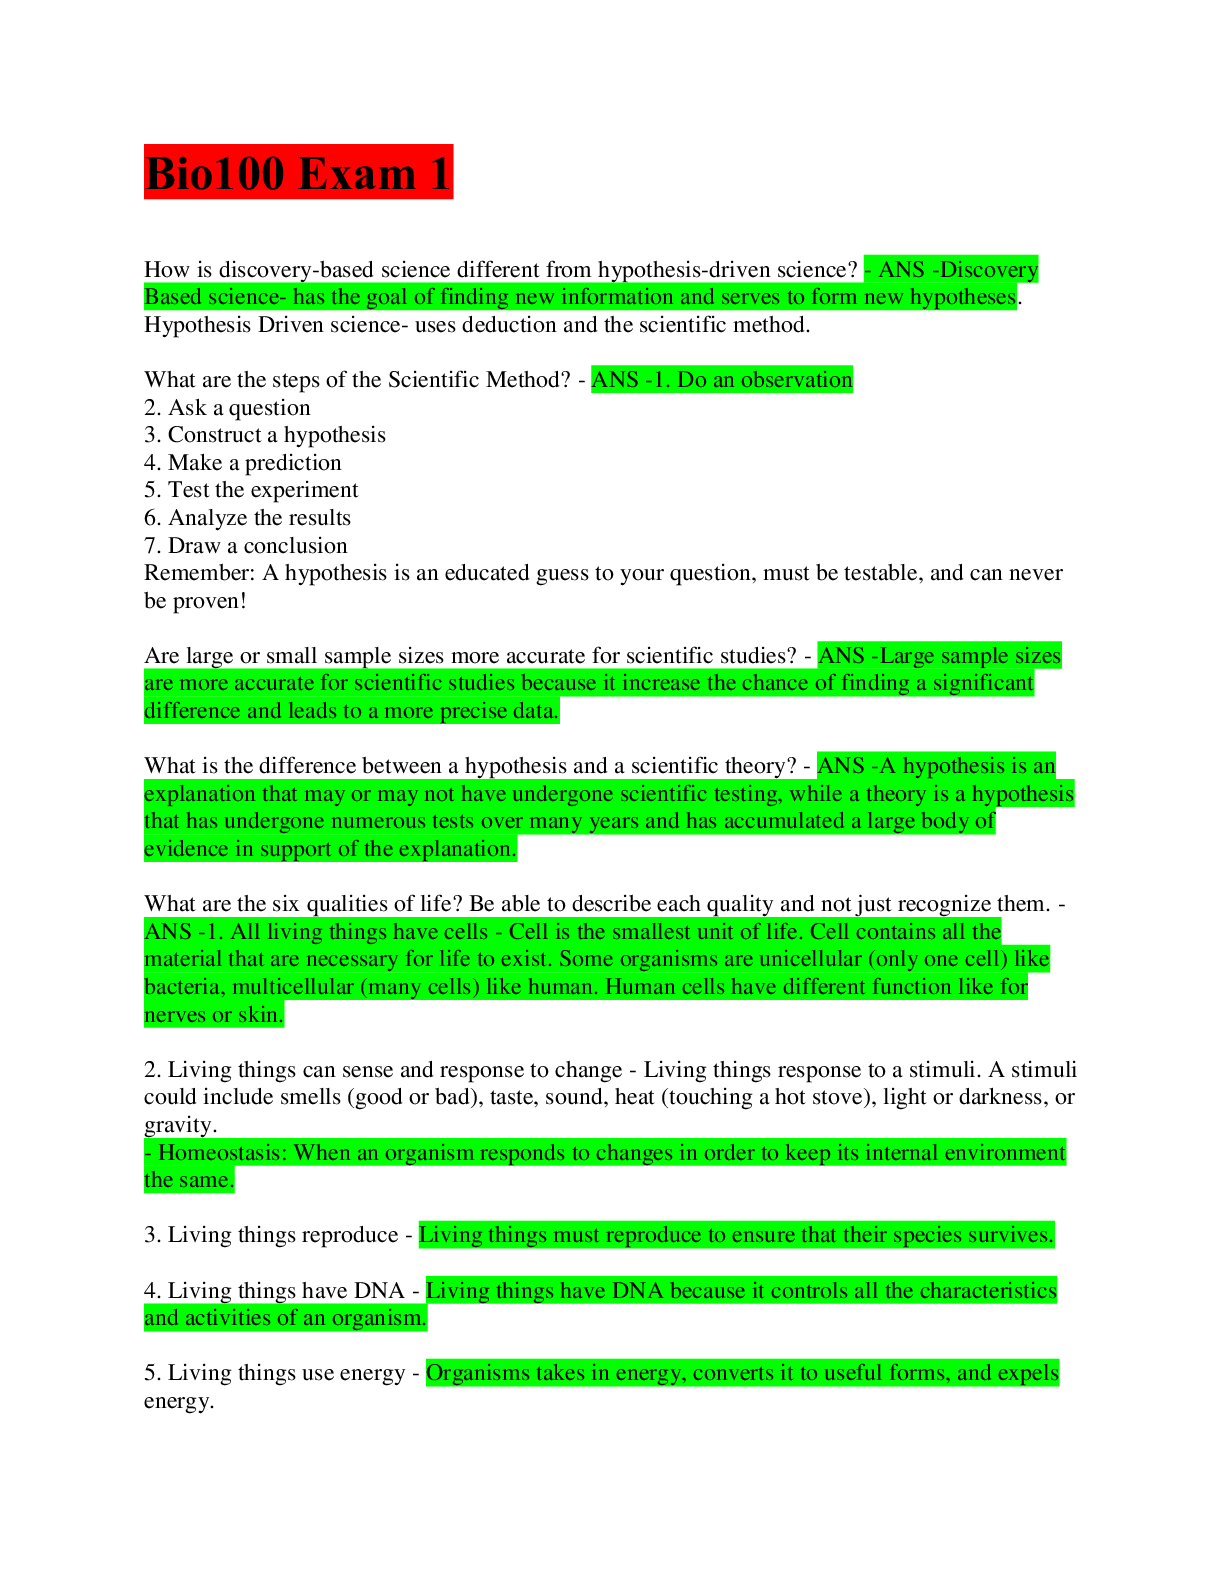
When you are graphing a proportion or a percent, what should you look at to help you understand the bigger picture? - ANS -The denominator of the measured value Within the following data set, what...
By MARIA J 3 years ago
$2
3
Reviews( 0 )
Document information
Connected school, study & course
About the document
Uploaded On
Oct 20, 2022
Number of pages
3
Written in
All

Additional information
This document has been written for:
Uploaded
Oct 20, 2022
Downloads
0
Views
164
Document Keyword Tags
Recommended For You
Get more on EXAM »


IHI QI 104; Interpreting Data; Run Charts, Control Charts, and...

Test Bank for Shah's Public Health and Preventive Health Care...
Strategic Healthcare Management Planning and Execution 2nd Edi...

Sonography 5th Edition By Reva Curry, Marilyn Prince (Test Ban...
TEST BANK For Little and Falace's Dental Management of the Med...
Test bank for Medical Emergencies-Essentials for the Dental Pr...