Statistics > EXAM > STAT 200 LAB 7 -LESSON 7: COMMON DISTRIBUTIONS; STAT200 ELEMENTARY STATISTICS LAB 7 (ANSWERED) (All)
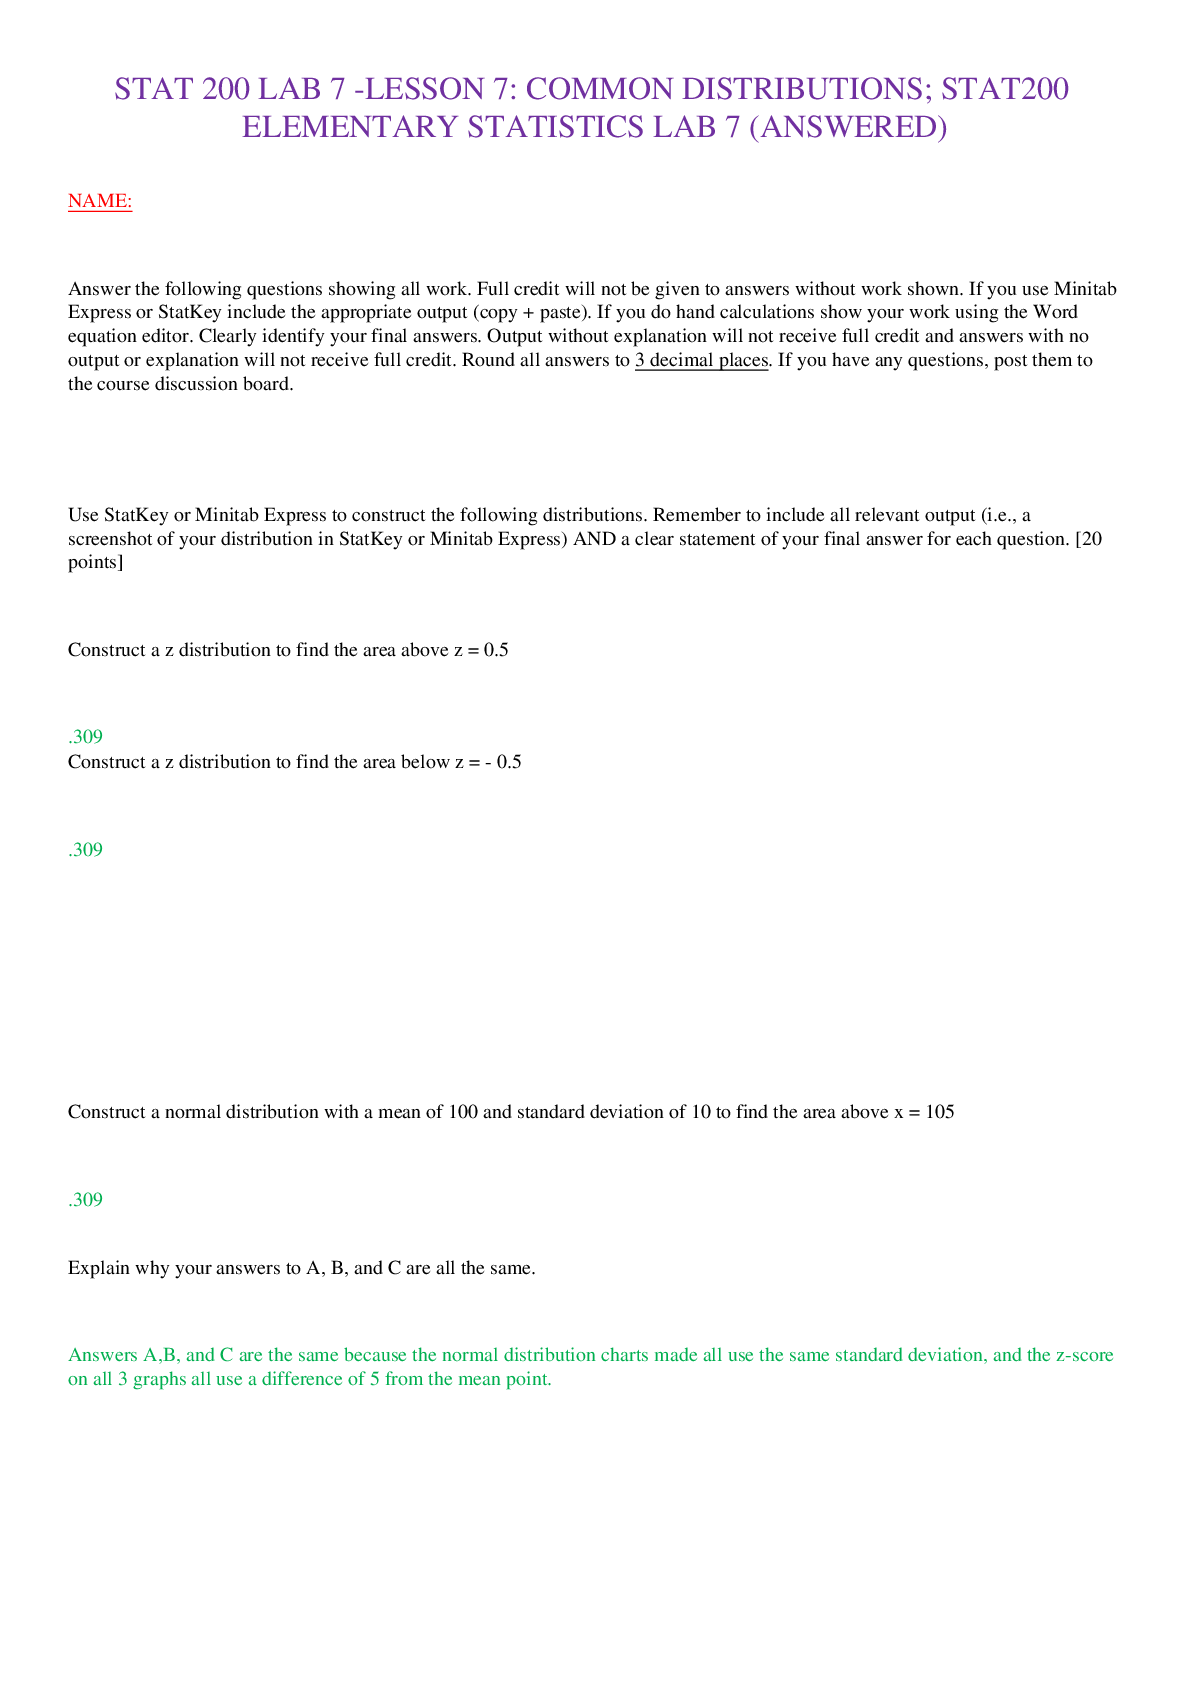
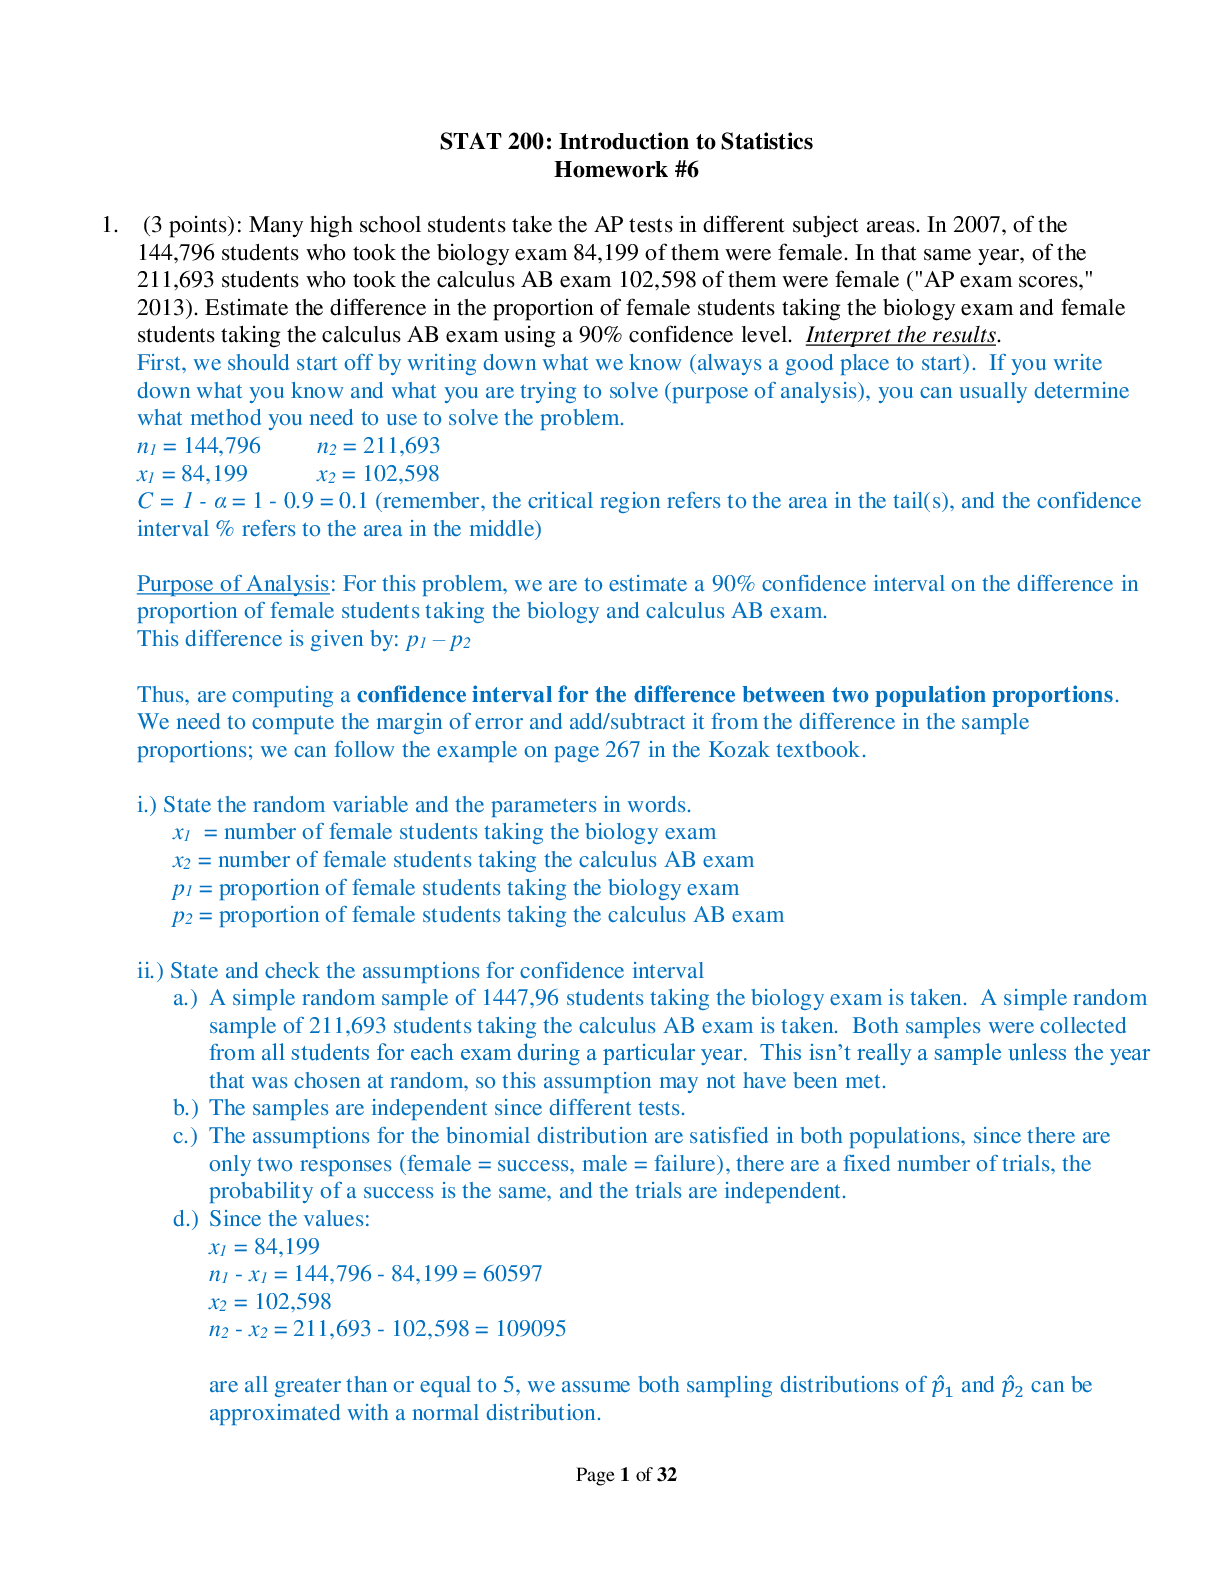
STAT 200 LAB 7 -LESSON 7: COMMON DISTRIBUTIONS; STAT200 ELEMENTARY STATISTICS LAB 7 (ANSWERED)
Document Content and Description Below
Last updated: 3 years ago
Preview 1 out of 4 pages
Instant download
Buy this Document to get the Full Access Instantly
Provided by Students Who Aced it
We Verify Document Content to Gurantee Accuracy
Reviews( 0 )
Document information
Connected school, study & course
About the document
Uploaded On
Oct 28, 2022
Number of pages
4
Written in
All

Additional information
This document has been written for:
Uploaded
Oct 28, 2022
Downloads
0
Views
74
Document Keyword Tags
Recommended For You
Get more on EXAM »
STAT 200 STAT200 MIDTERM EXAM ANSWERS (2021) - UMUC (all solut...

STAT 200 Week 2 Homework |Latest Questions And Answers {Comple...

STAT 200 FINAL EXAM 1 ; Latest Complete Solutions with shown w...

STAT 200 6372 Introduction to Statistics (2202) / STAT 200 wee...
STAT 200 6372 Introduction to Statistics (2202) / STAT 200 wee...
STAT 200 6372 Introduction to Statistics (2202) / STAT 200 wee...

University of Maryland, University College - STAT 200 3150; St...

STAT 200 Week 7 Homework Problems | Solved Spring 2025/2026 |...

University of Maryland - STAT 200; Week 7 Homework Problems, A...


Elementary Statistics Using Excel, 7e Mario Triola (Solution M...

Solutions Manual for Elementary Statistics A Step By Step Appr...
.png)