ATI MED SURG REMEDIATION COMPLTE SOLUTION: LATEST-2021, COMPLETE GUIDE
$ 12.5

GT Students and Verified _ Midterm Quiz 1 _ ISYE6501x Courseware _ edX
$ 12
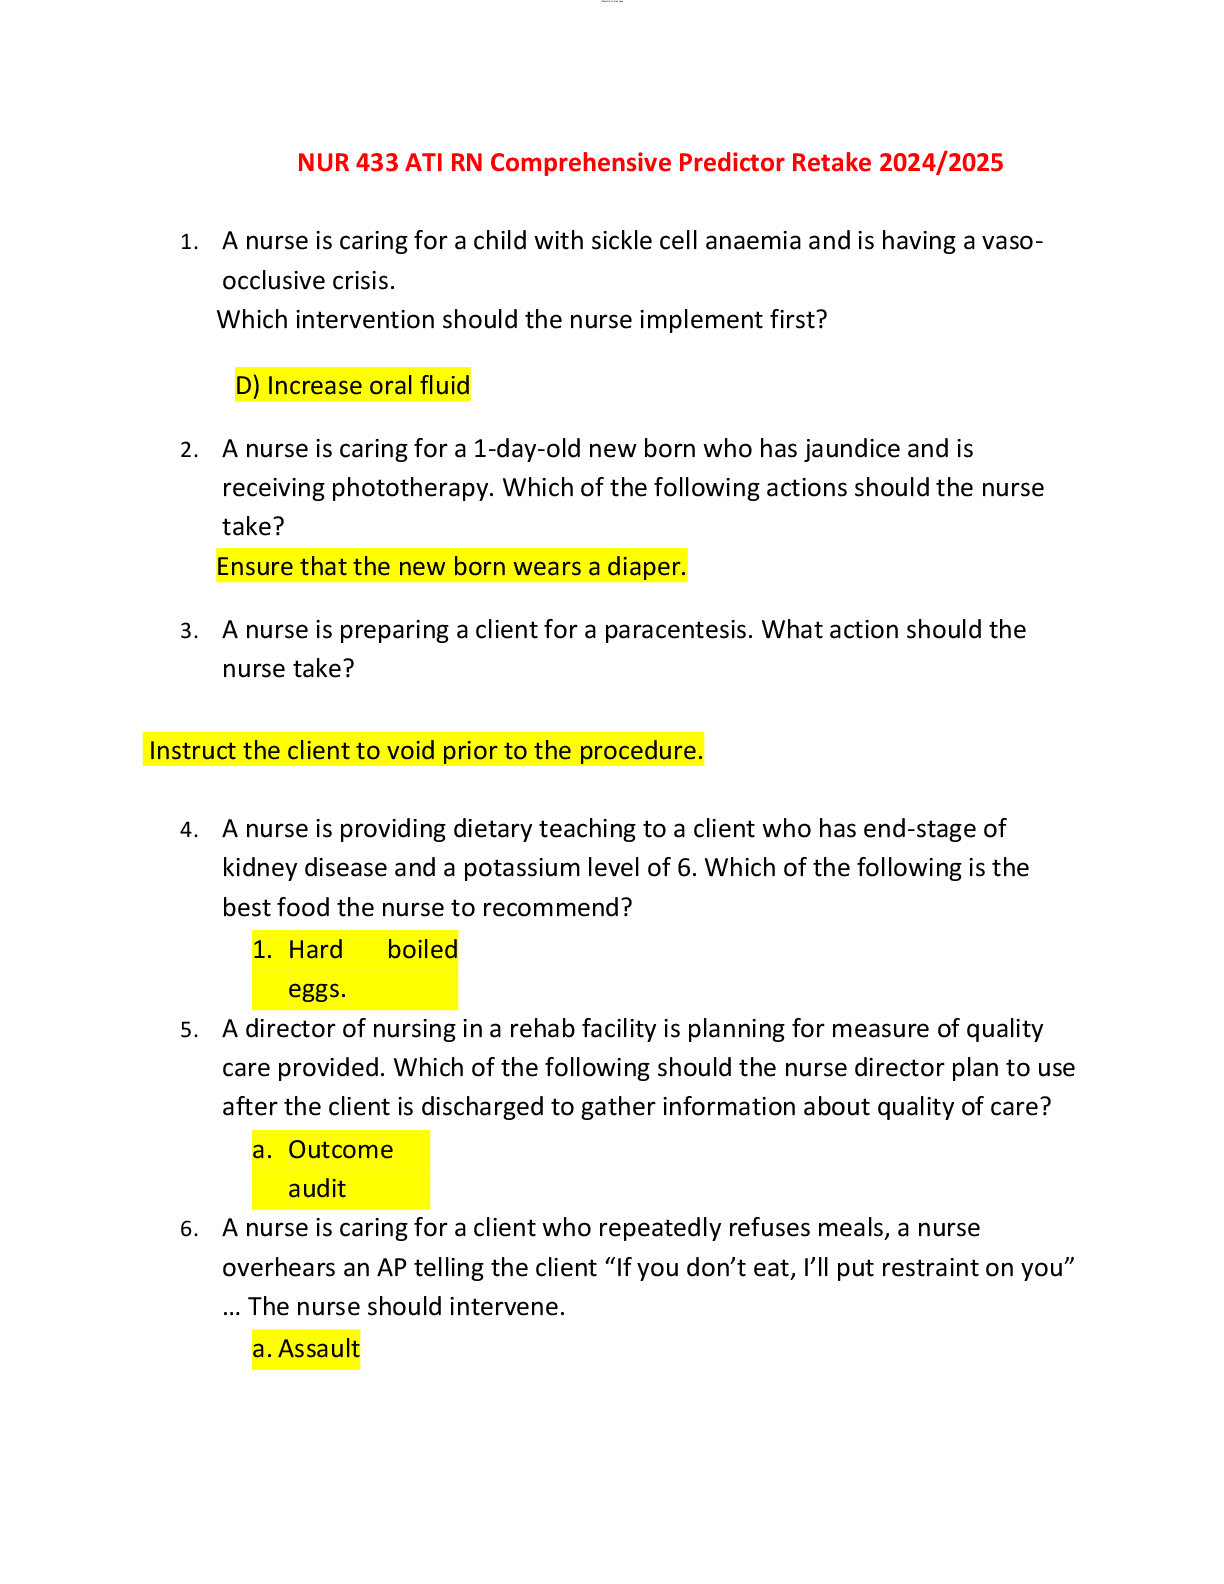
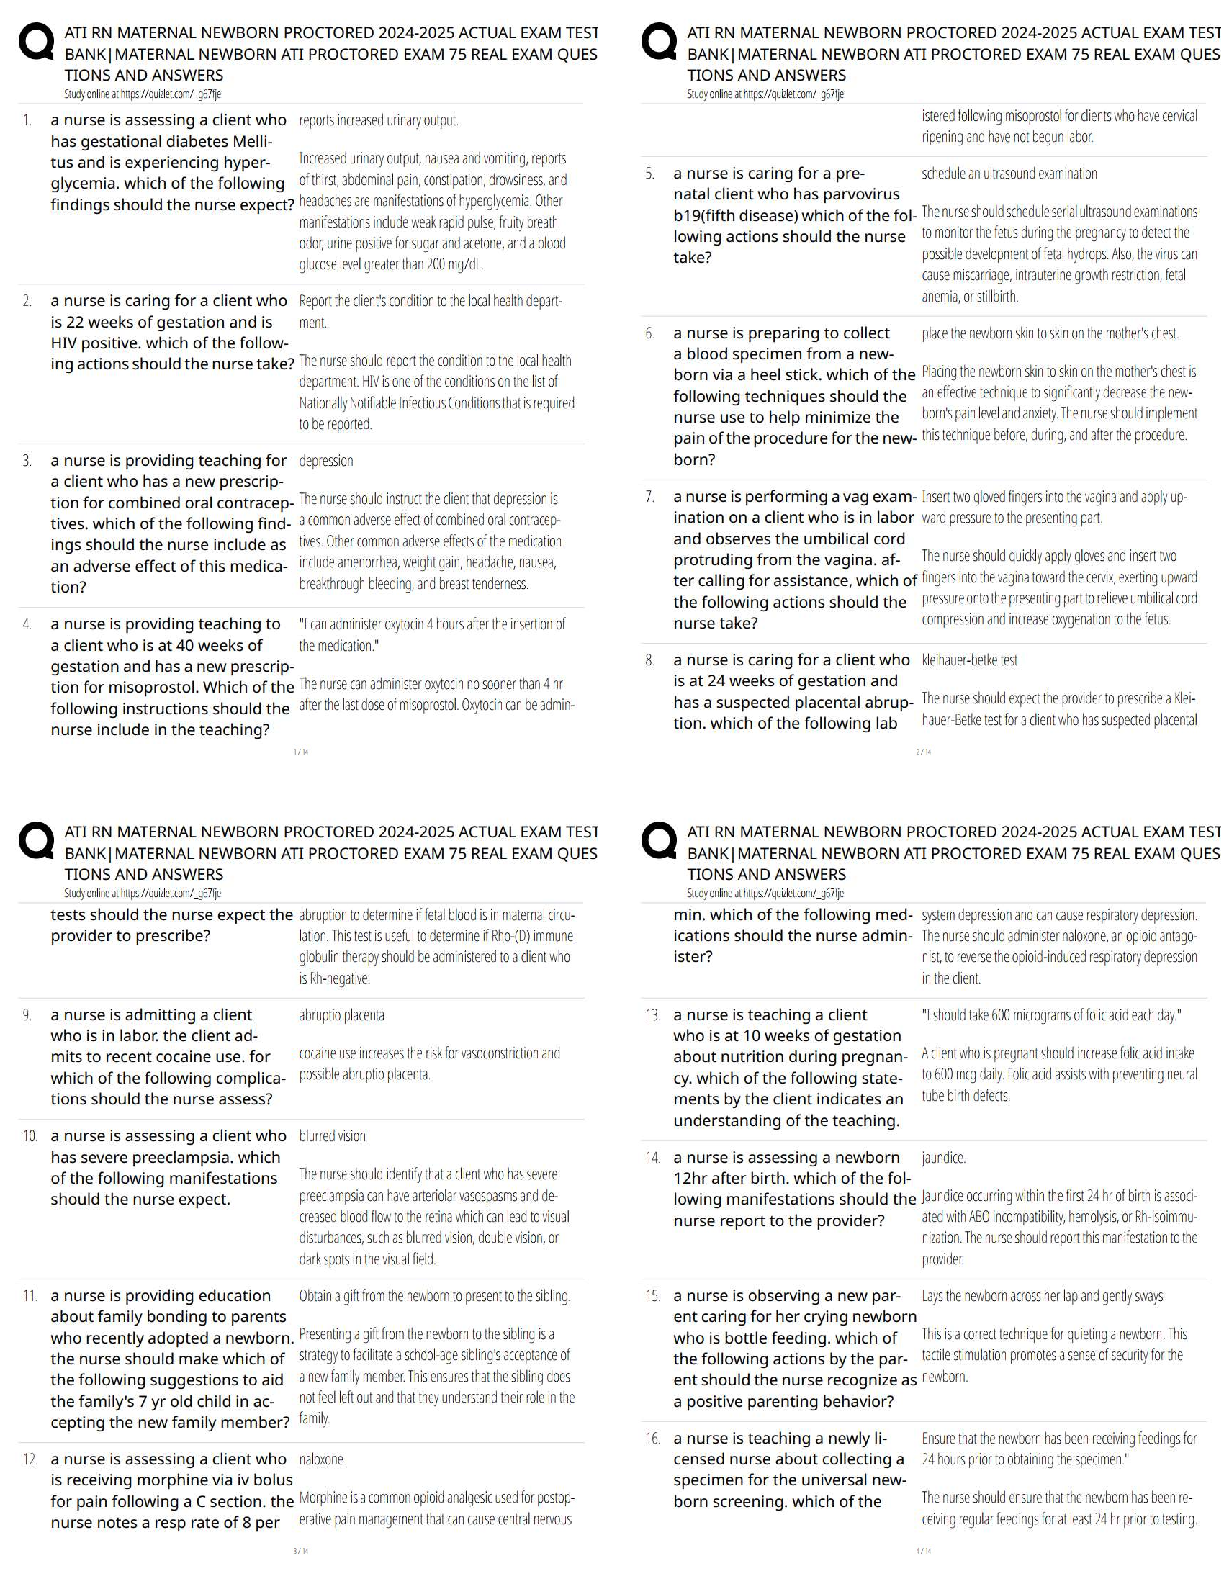
NUR 433 ATI RN Comprehensive Predictor Retake 2024-2025
$ 36.5

ADVANCED P 6521 Case Study: An Elderly Hispanic Man with Major Depressive Disorder | Complete Solution Guide | Walden University.
$ 8

Sophia_Visual Communications_Milestone2 (question & answers) Passed_Latest Fall 2020.
$ 10
.png)
CBCS Practice Exam Predicted Questions 2022 300 Questions with 100% Correct Answers
$ 8
[eTextBook] [PDF] Foundations of Early Childhood Education Teaching Children in a Diverse Society 8th Edition By Janet Gonzalez-Mena
$ 29

ATI Mental Health Proctored Exam 2020 100% CORRECT| COMPLETE DOCUMENTS QUIZ BANK
$ 14.5

HESI RN EXIT V1 COMPLETE ASSESSMENT WITH QUESTIONS AND ANSWERS 100% SATISFACTORY QUESTIONS (160 questions all answered)
$ 14.5

Quick review NR 603 week 5 patient 1 responses Updated 2022.
$ 16.5
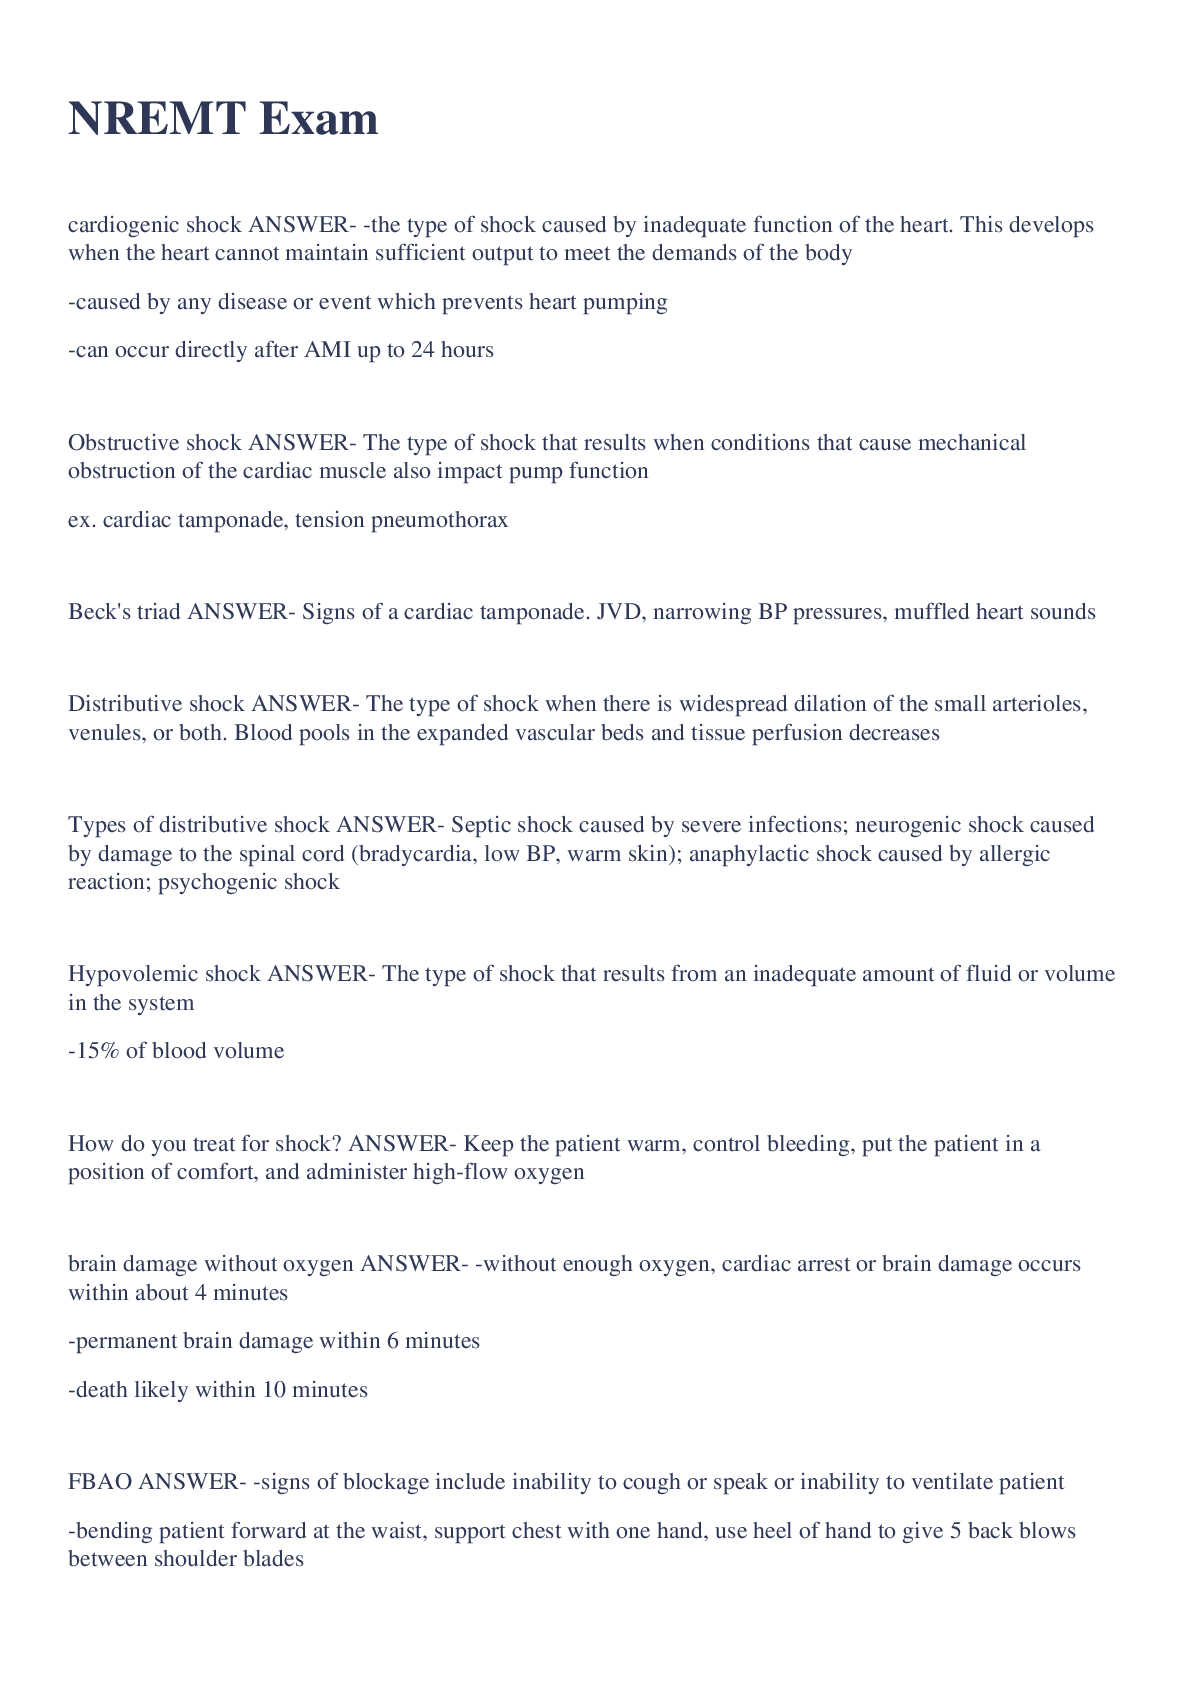
NREMT EXAM – QUESTIONS AND SOLUTIONS (VERIFIED)
$ 15.5

AHIP Exam Study Questions | with 100% Correct Answers
$ 8

The Role of Leadership in Shaping Organizational Culture
$ 3
OCR; GCE Computer Science H446/01: Computer systems Advanced GCE, Mark Scheme for November 2020
$ 6
ADVANCED PATHOPHYSIOLOGY QUIZZES 2022 100%correct
$ 16.5
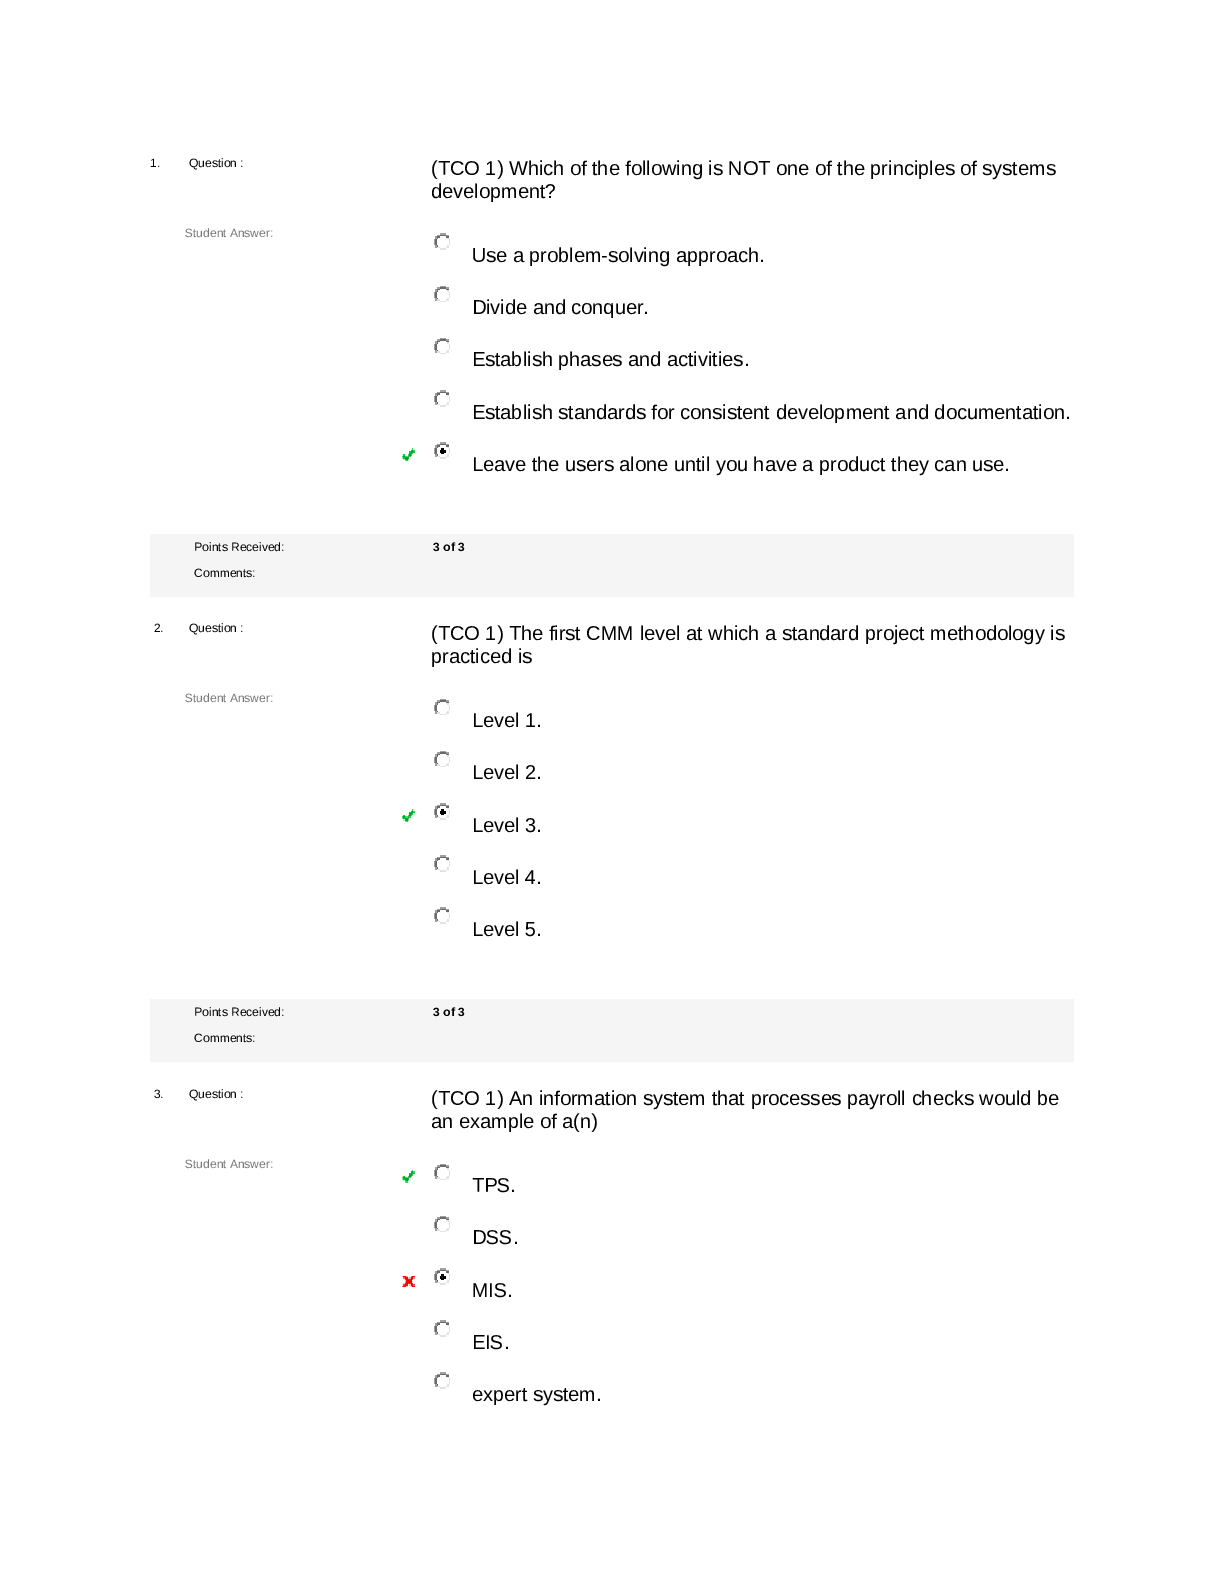
CIS 321 all quiz latest 2020 with complete solution;DeVry University
$ 9.5
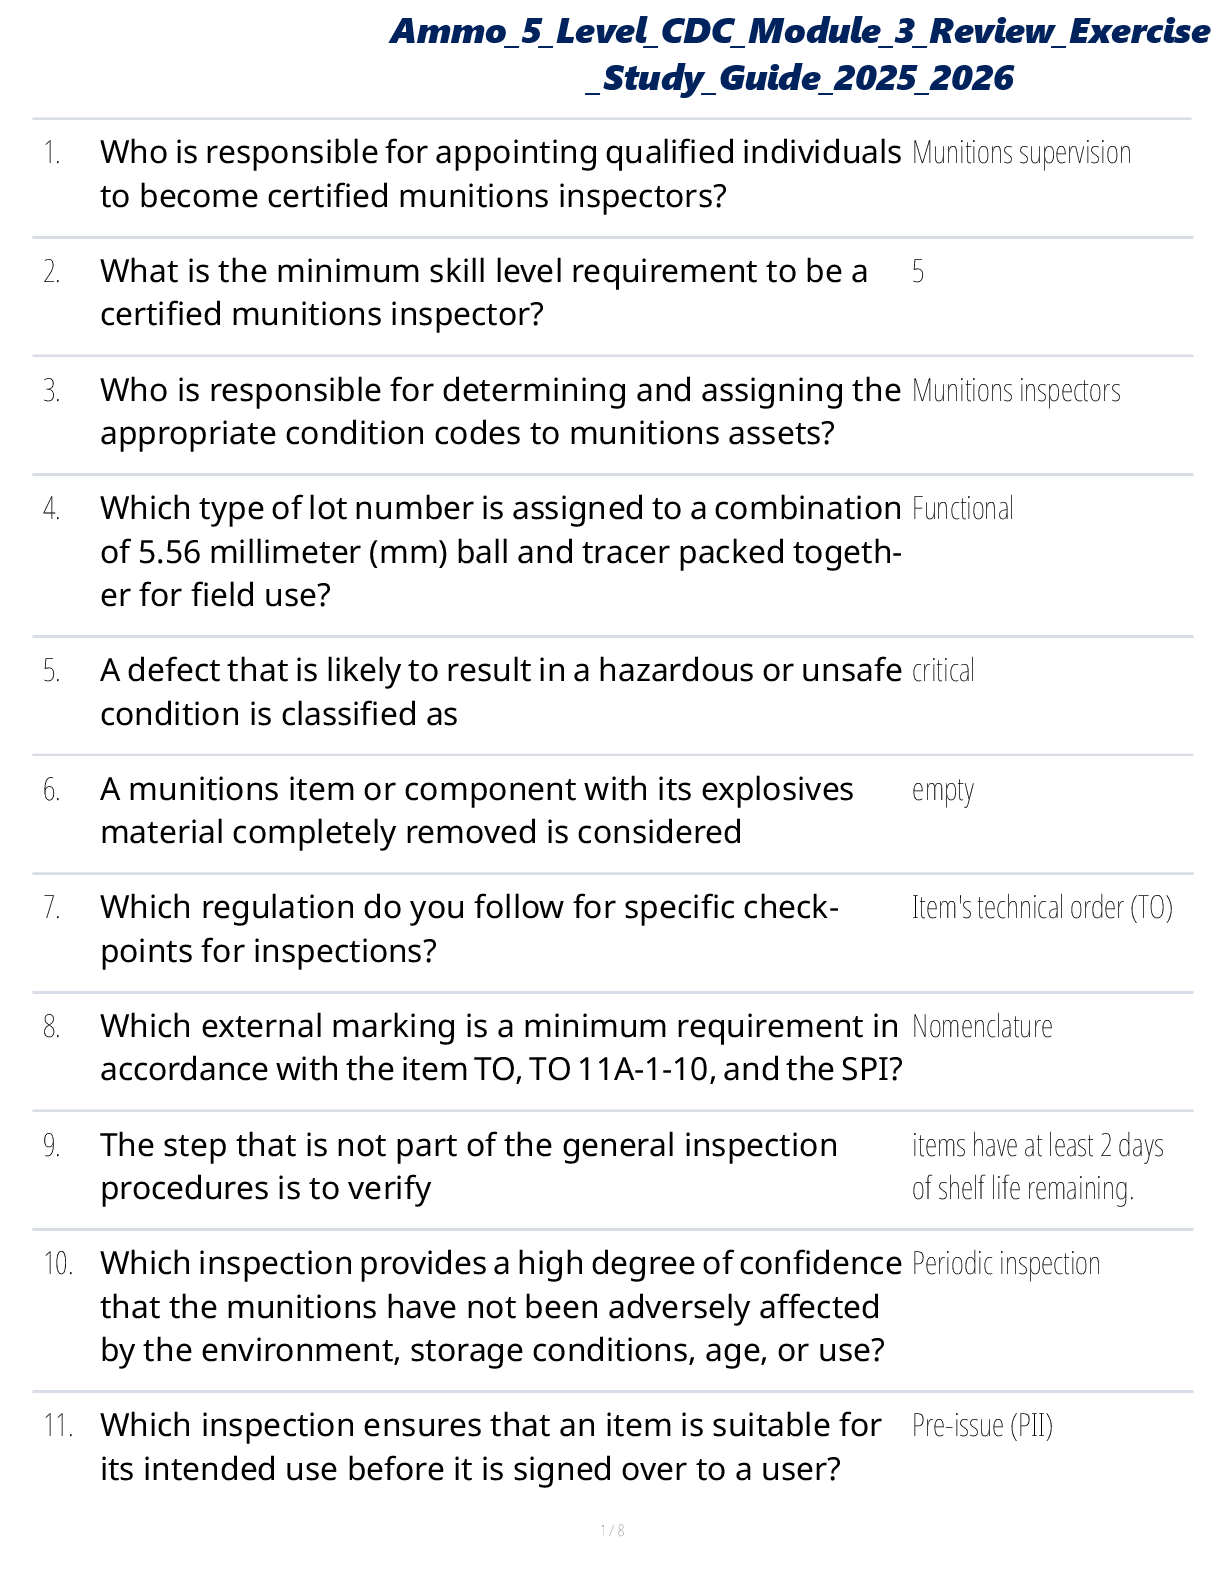
Ammo 5 Level CDC Module 3 Review Exercises Study Guide 2025
$ 12.5
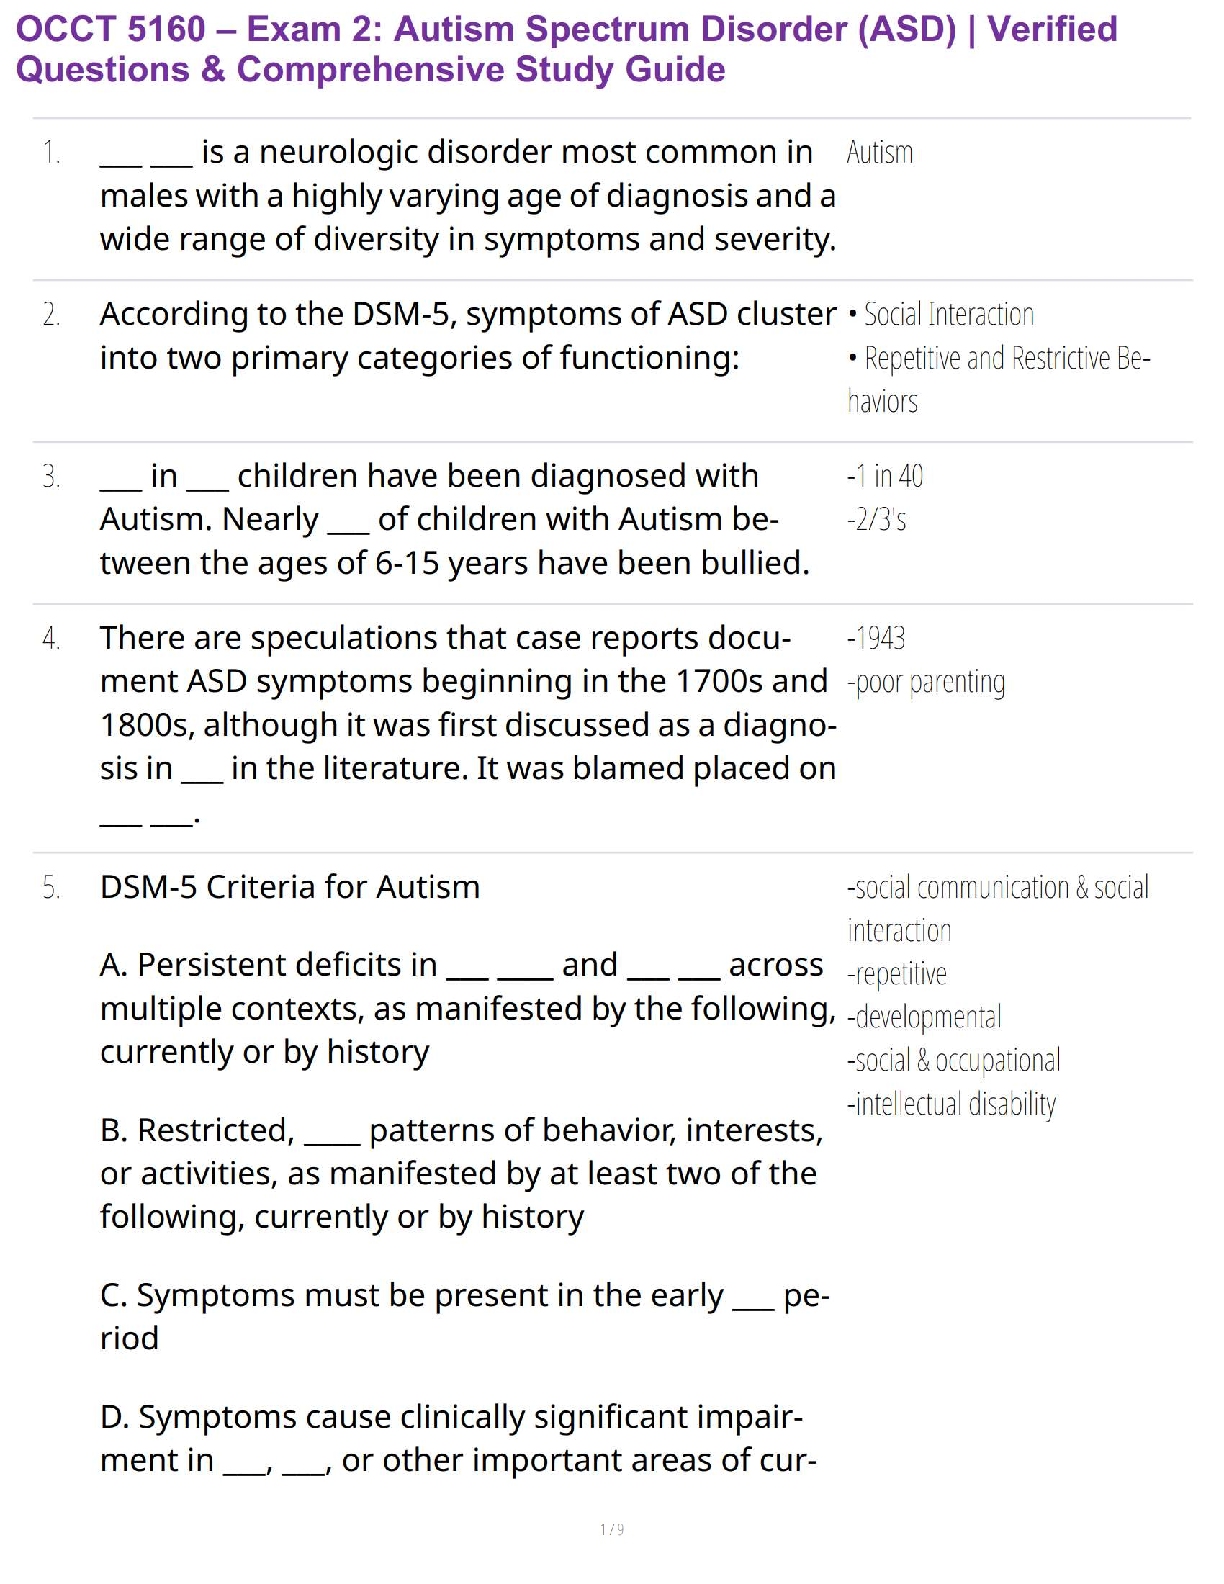
OCCT 5160 – Exam 2: Autism Spectrum Disorder (ASD) | Verified Questions & Comprehensive Study Guide
$ 10
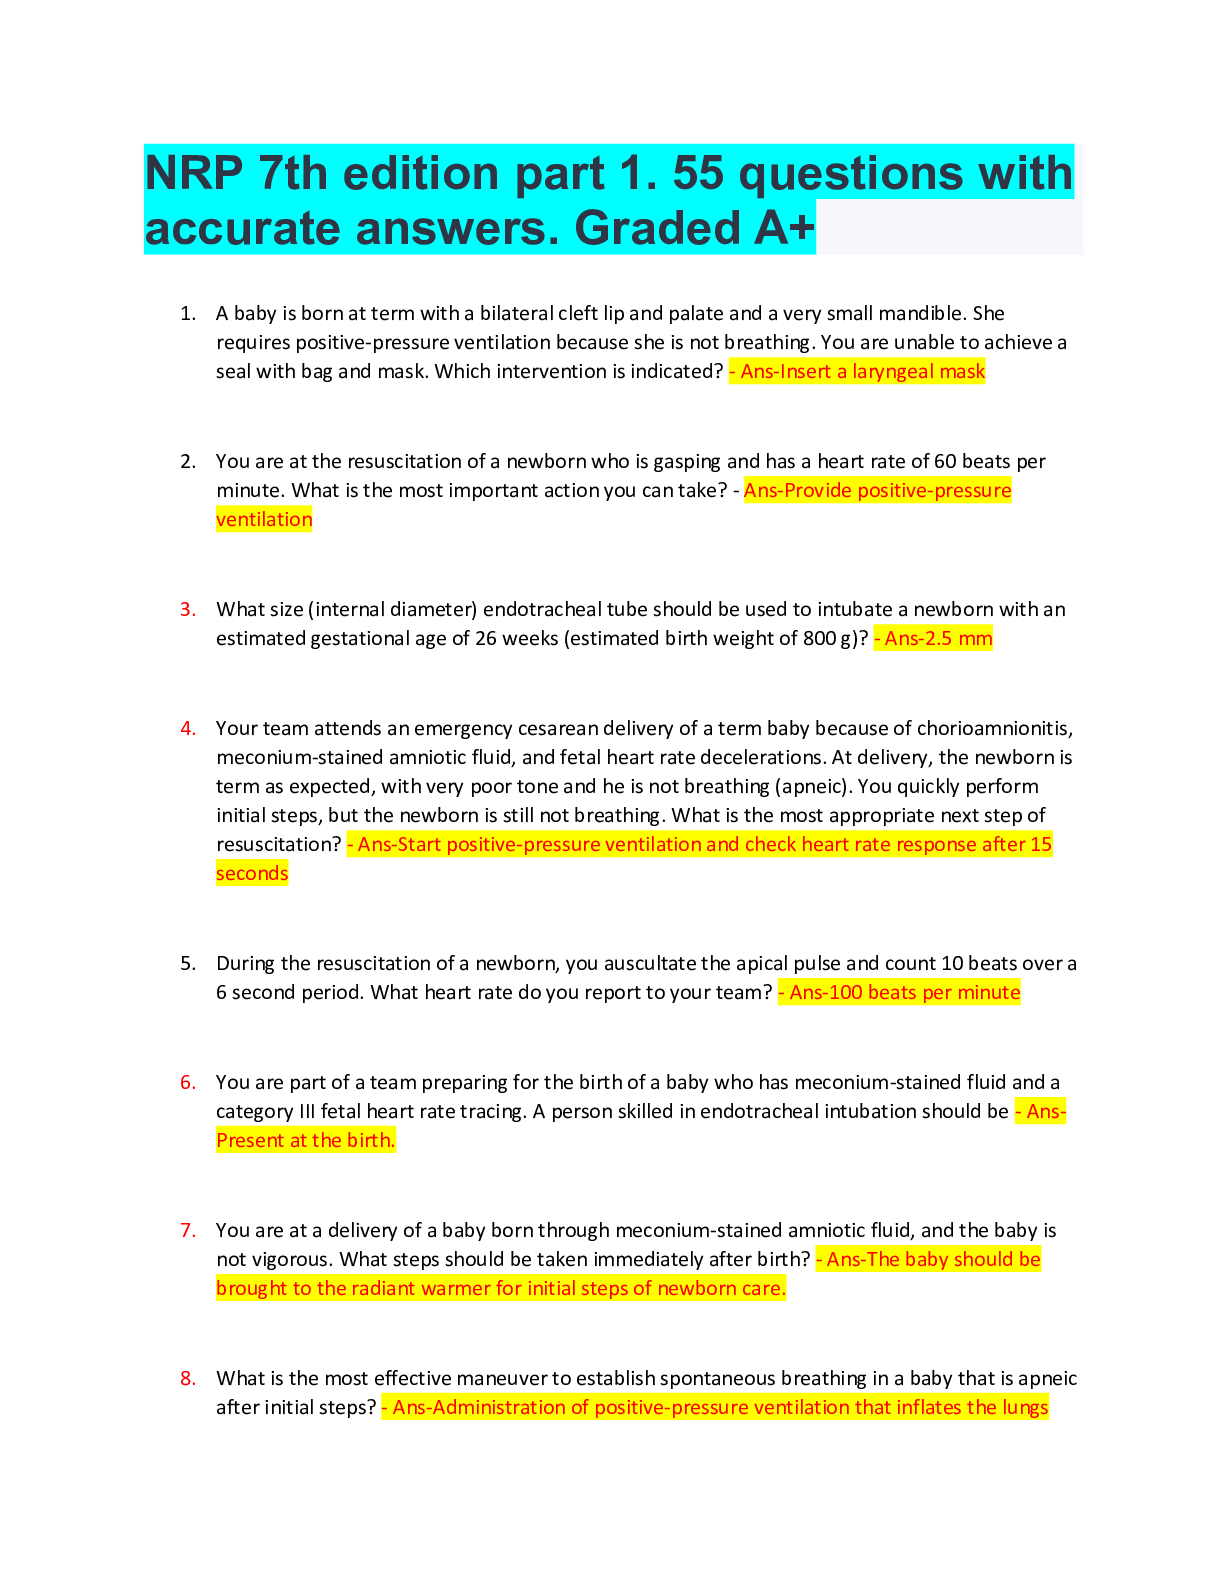
NRP 7th edition part 1. 55 questions with accurate answers. Graded A+
$ 7
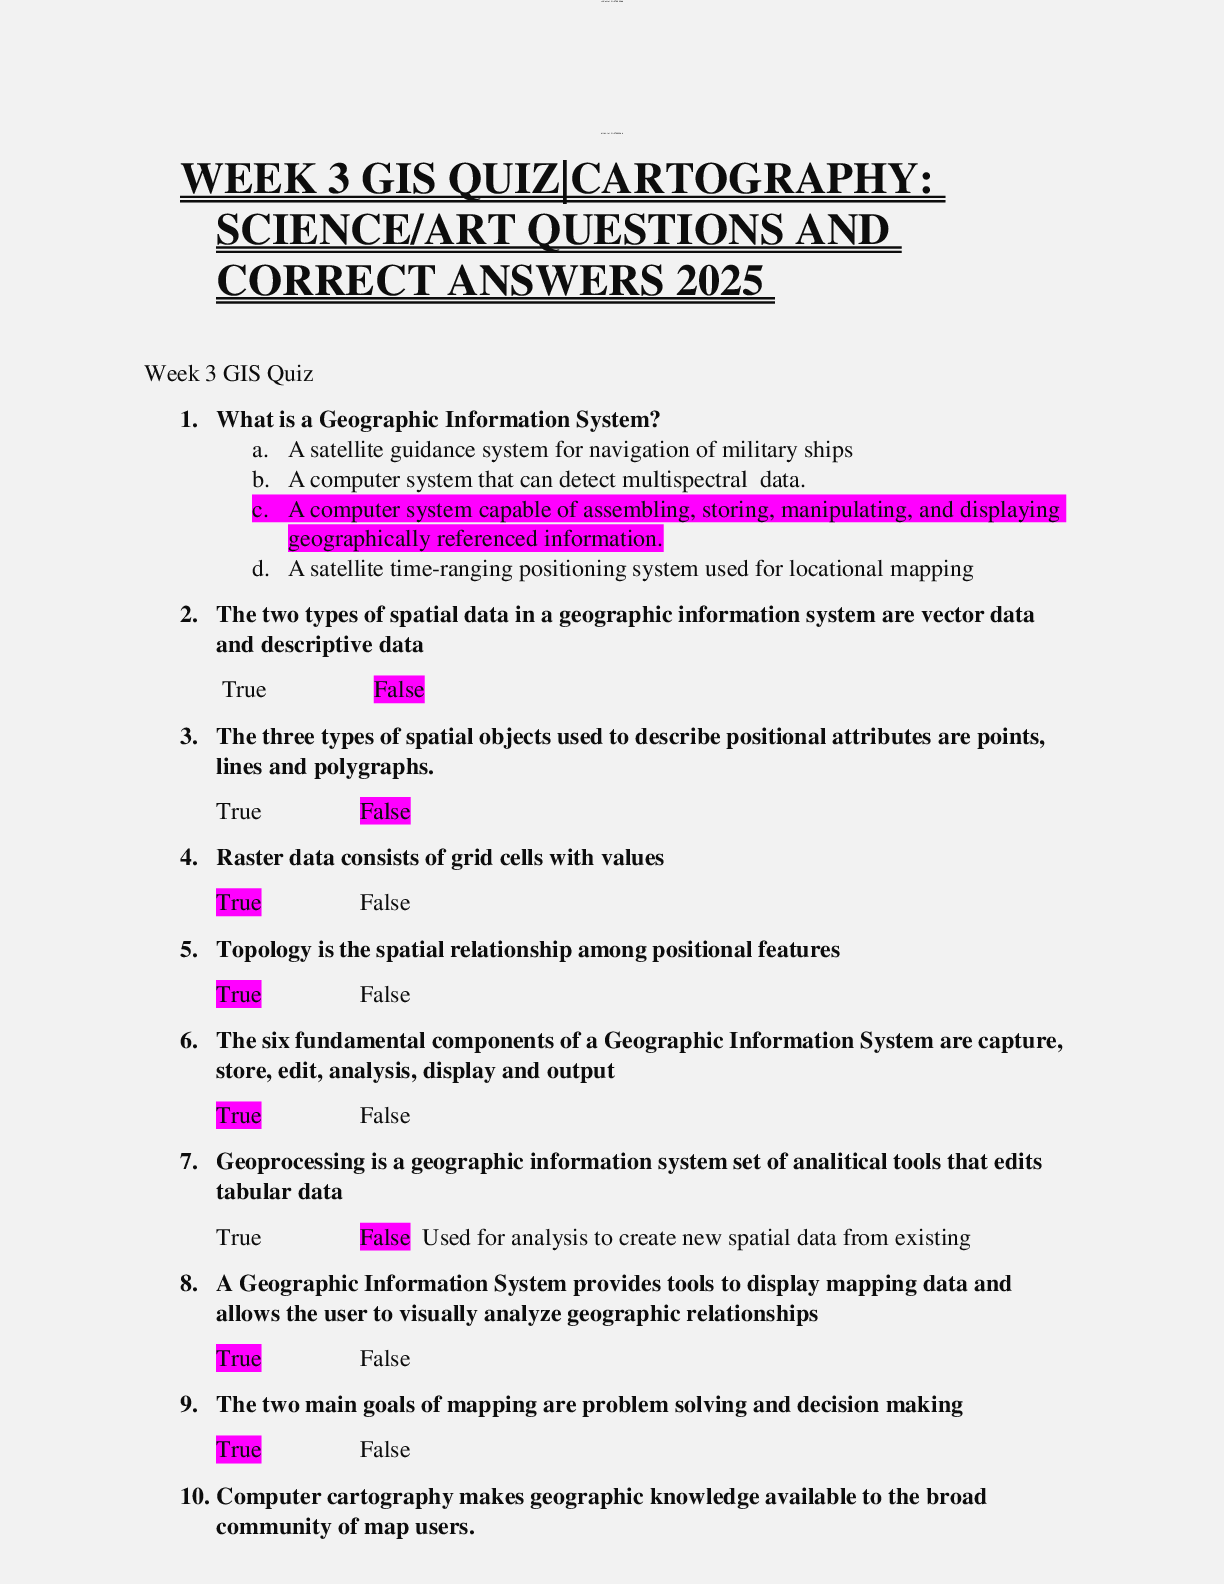
WEEK 3 GIS QUIZ|CARTOGRAPHY: SCIENCE/ART QUESTIONS AND CORRECT ANSWERS 2025
$ 10
.png)
WGU C777 Questions and Answers 100% Pass
$ 15
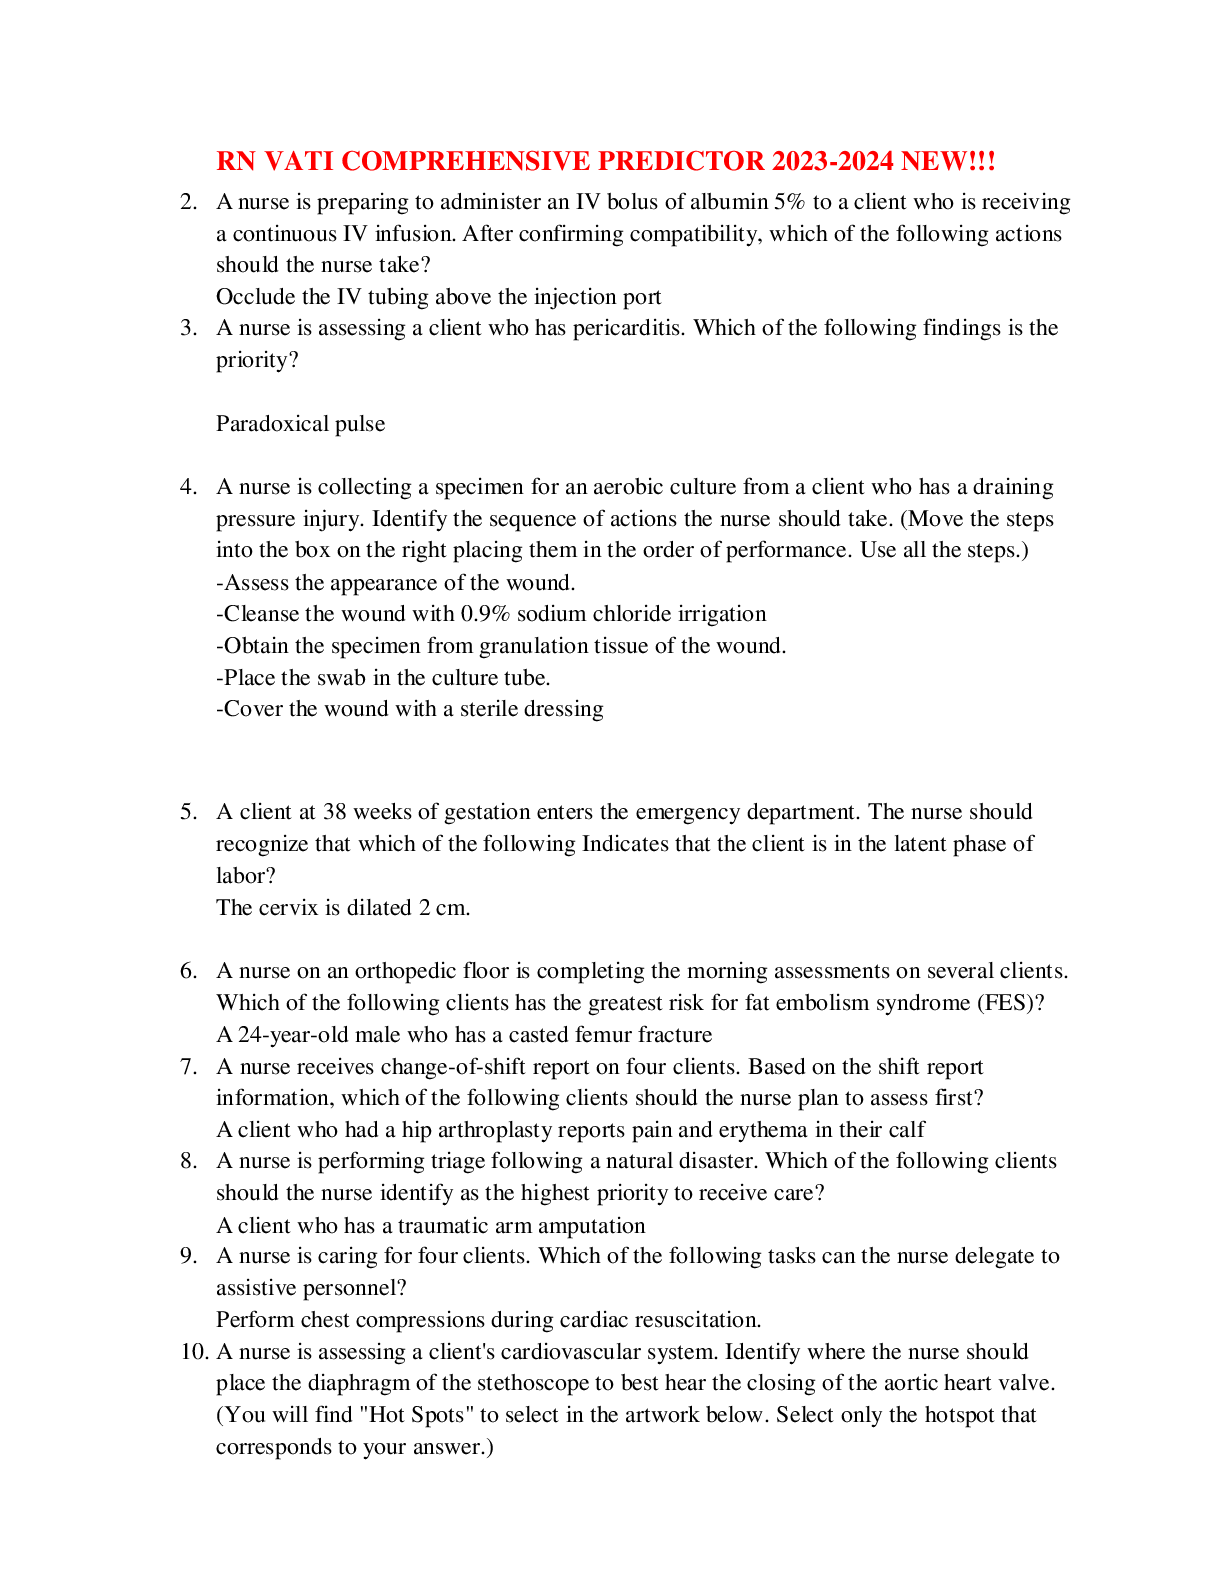
Rn vati comprehensive predictor 2023/2024 new!!!
$ 55
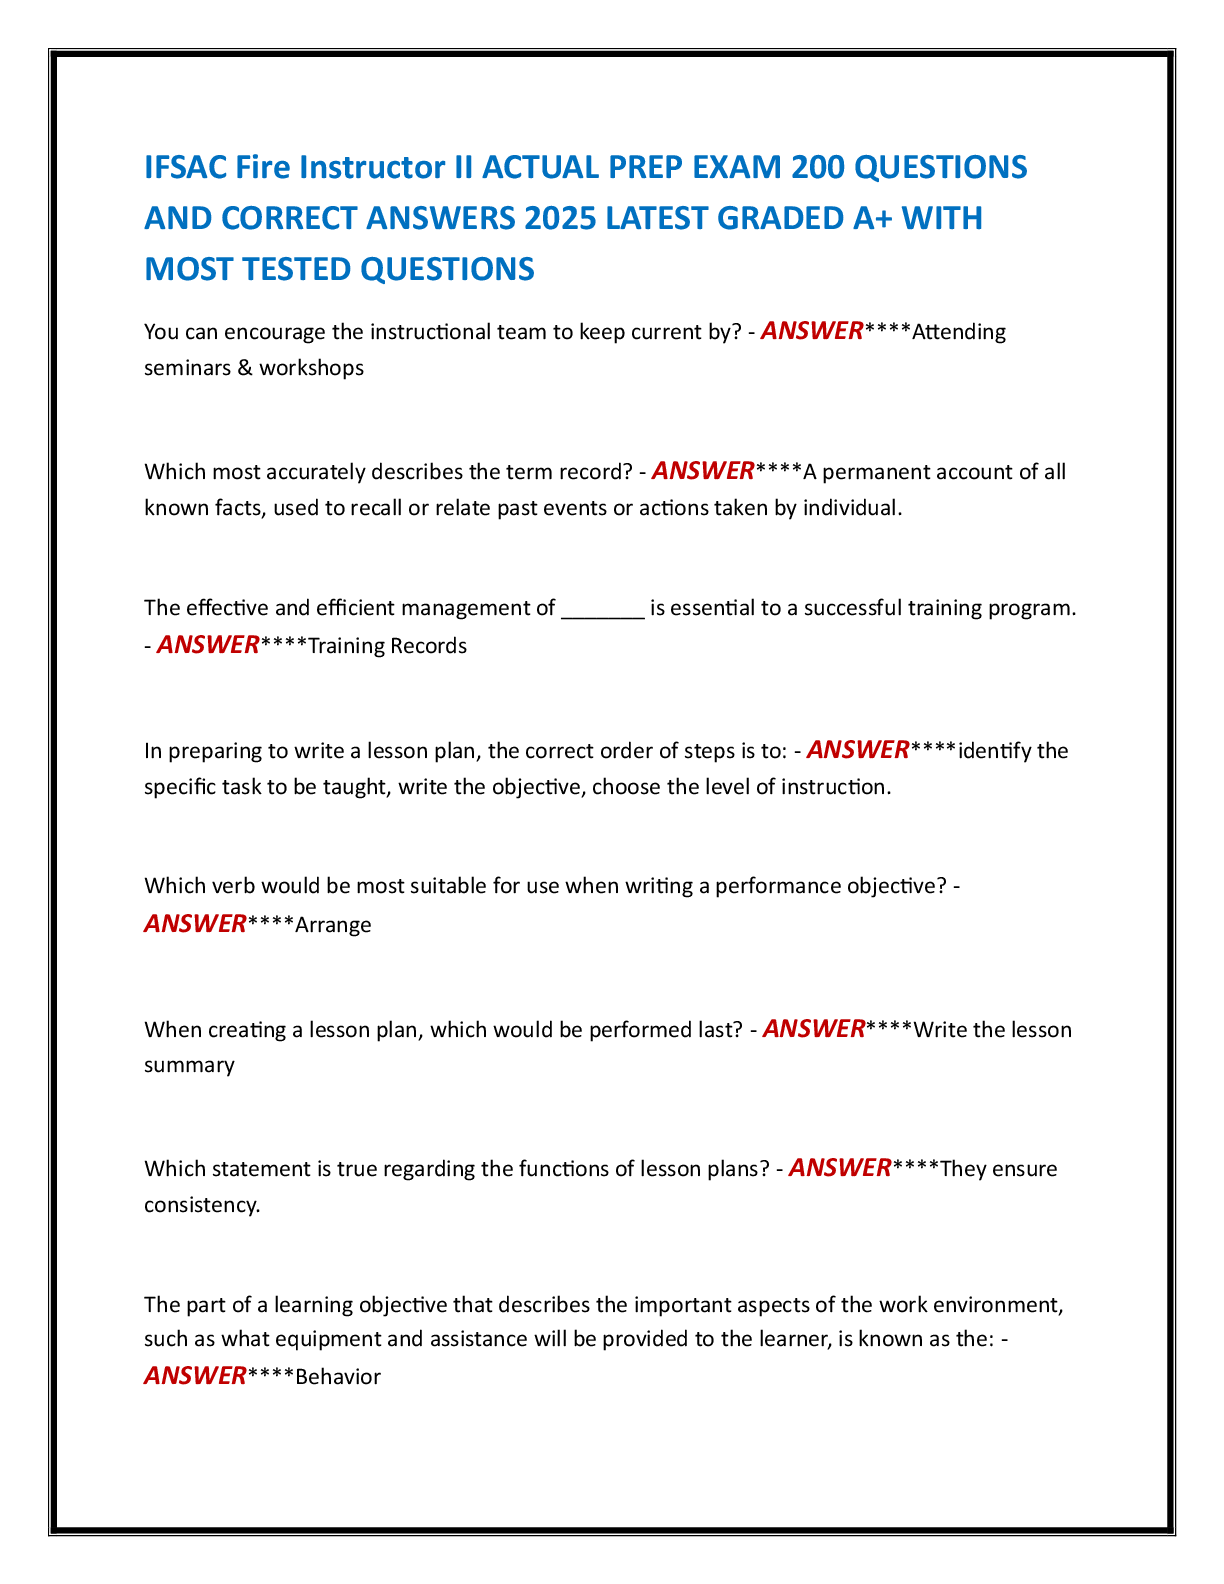
IFSAC Fire Instructor II ACTUAL PREP EXAM 200 QUESTIONS AND CORRECT ANSWERS 2025 LATEST GRADED A+ WITH MOST TESTED QUESTIONS
$ 22

Environmental Science Journal
$ 8.5
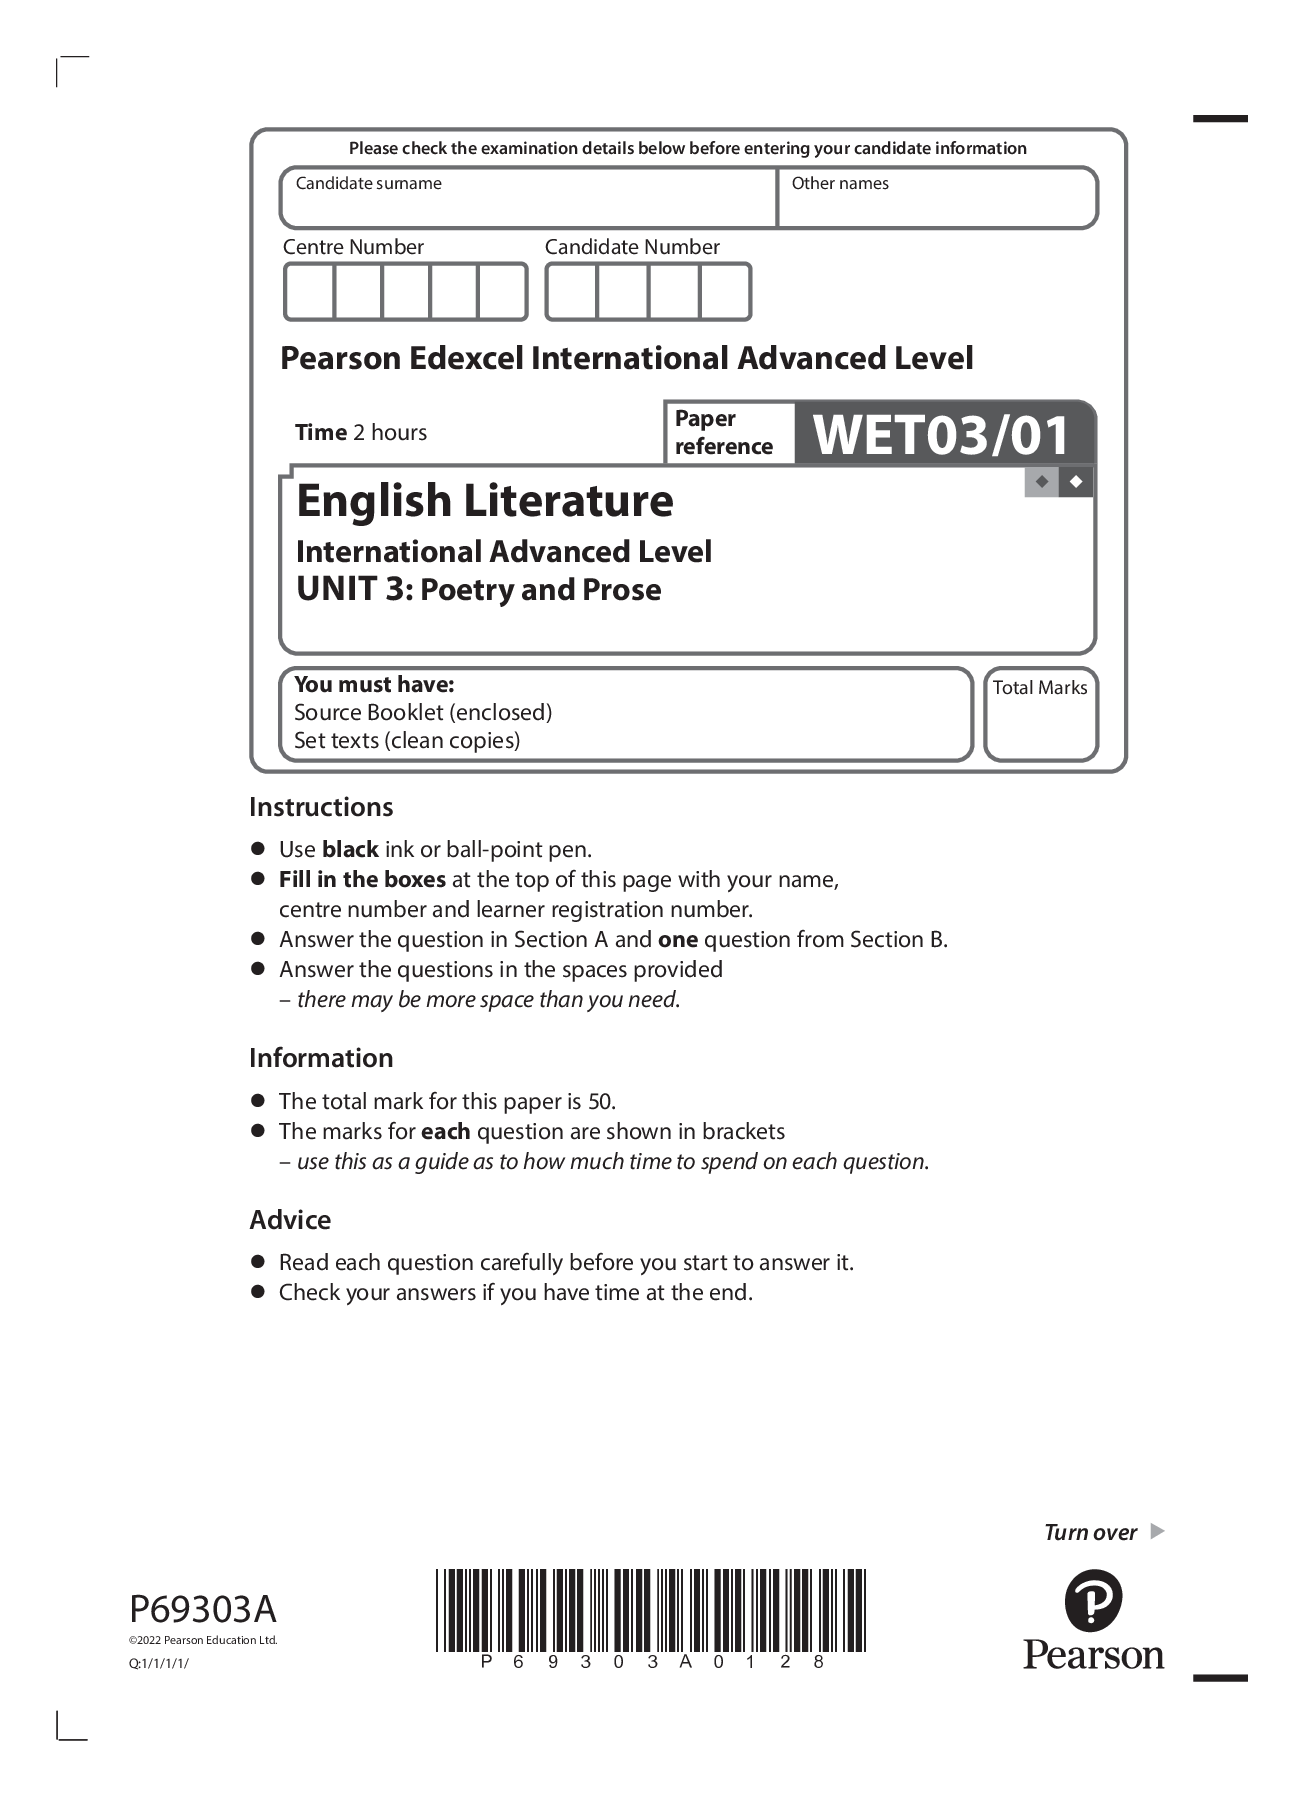
Pearson Edexcel IAL WET03/01 I A Level English Literature International Advanced Level UNIT 3: Poetry and Prose. QP Jan 2022
$ 4
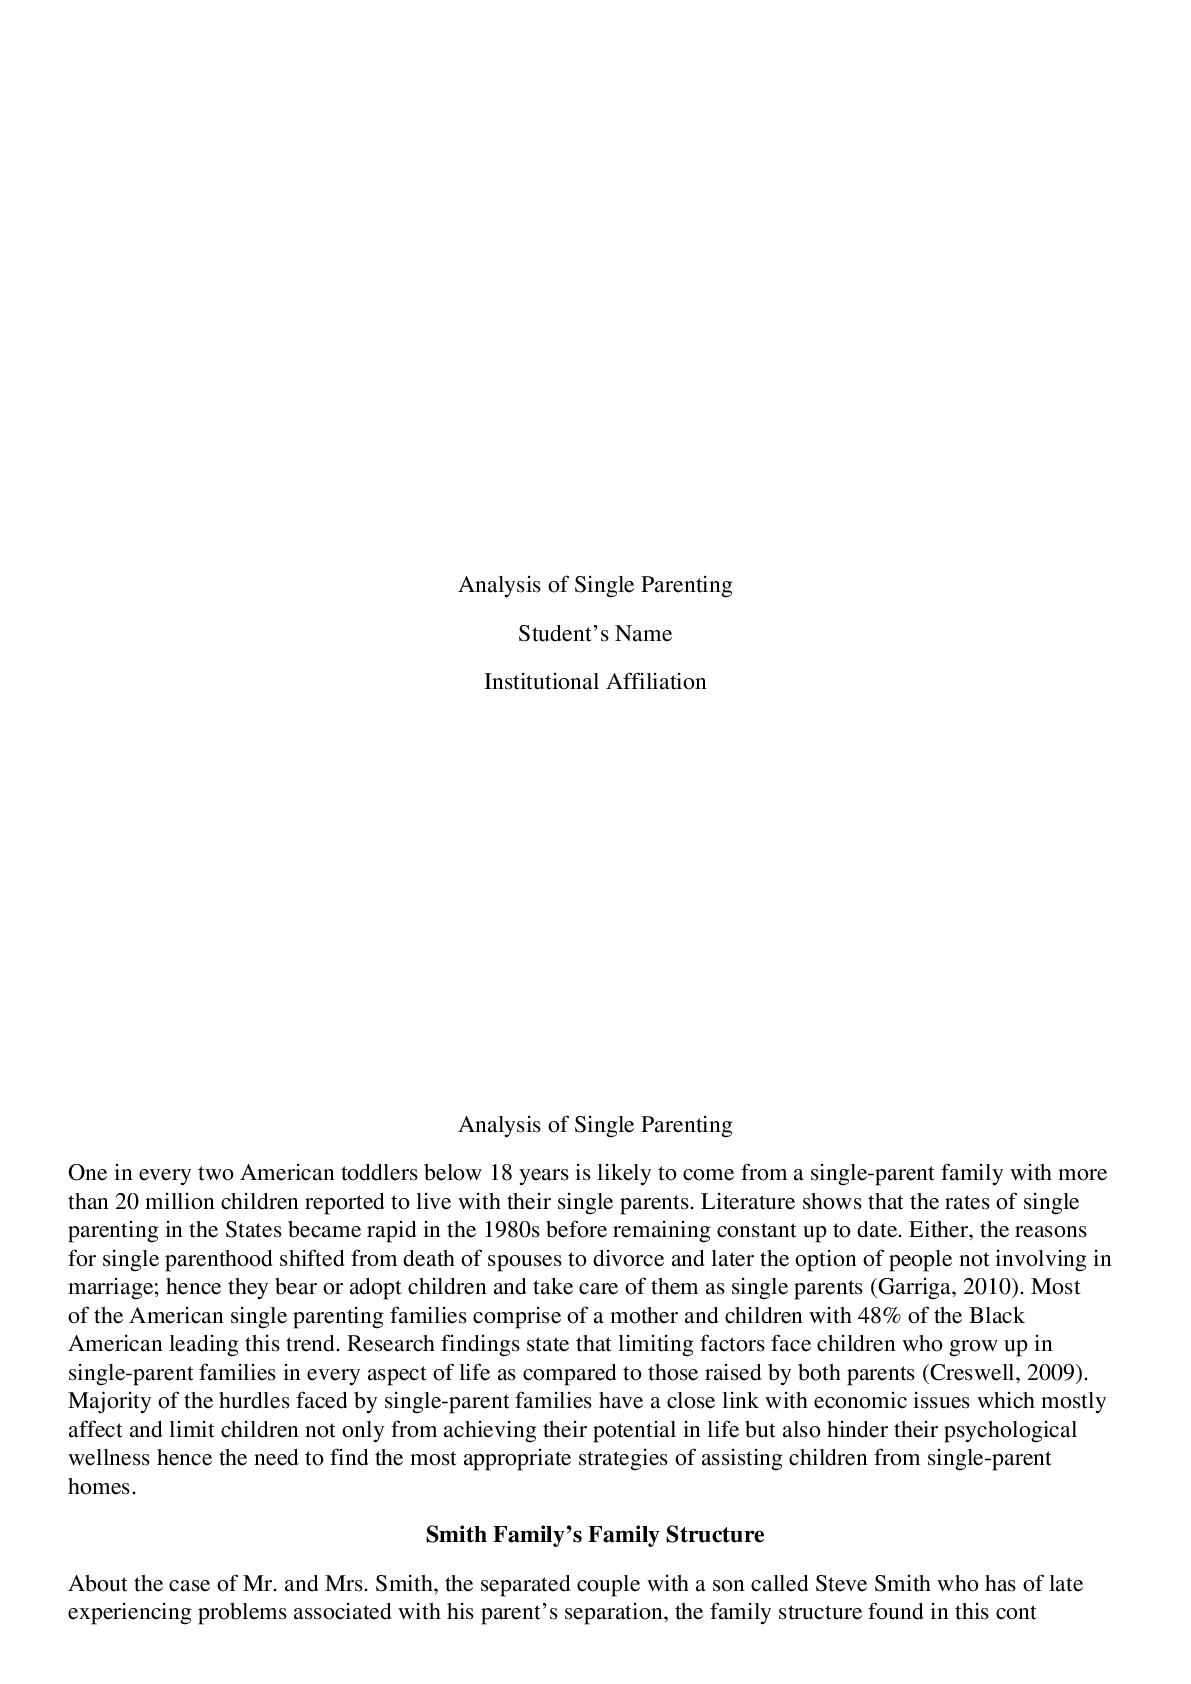
Single Parenting Approach
$ 9

FDNY Proby School Quiz 1 Review | 75 Questions with 100% Correct Answers | Updated & Verified
$ 7
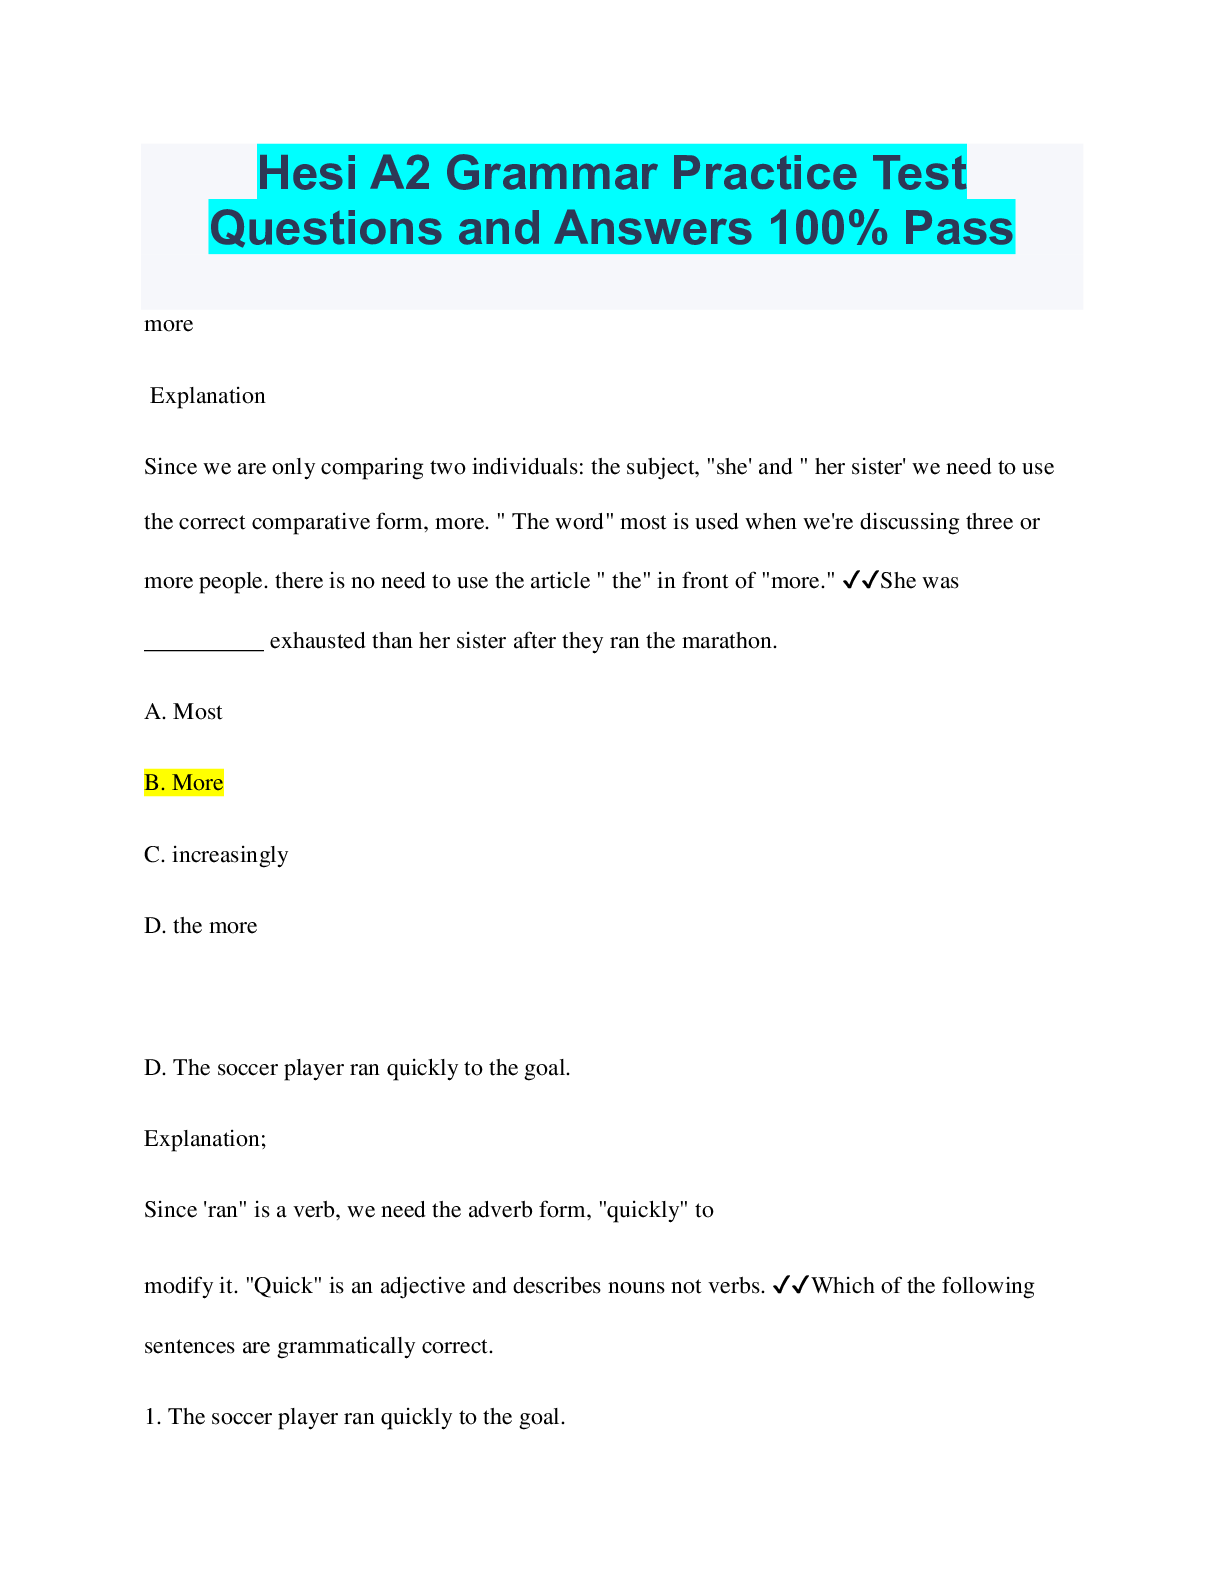
Hesi A2 Grammar Practice Test Questions and Answers 100% Pass
$ 10
.png)
WGU C720 Operations and Supply Chain Management – Questions and Answers Already Passed
$ 10
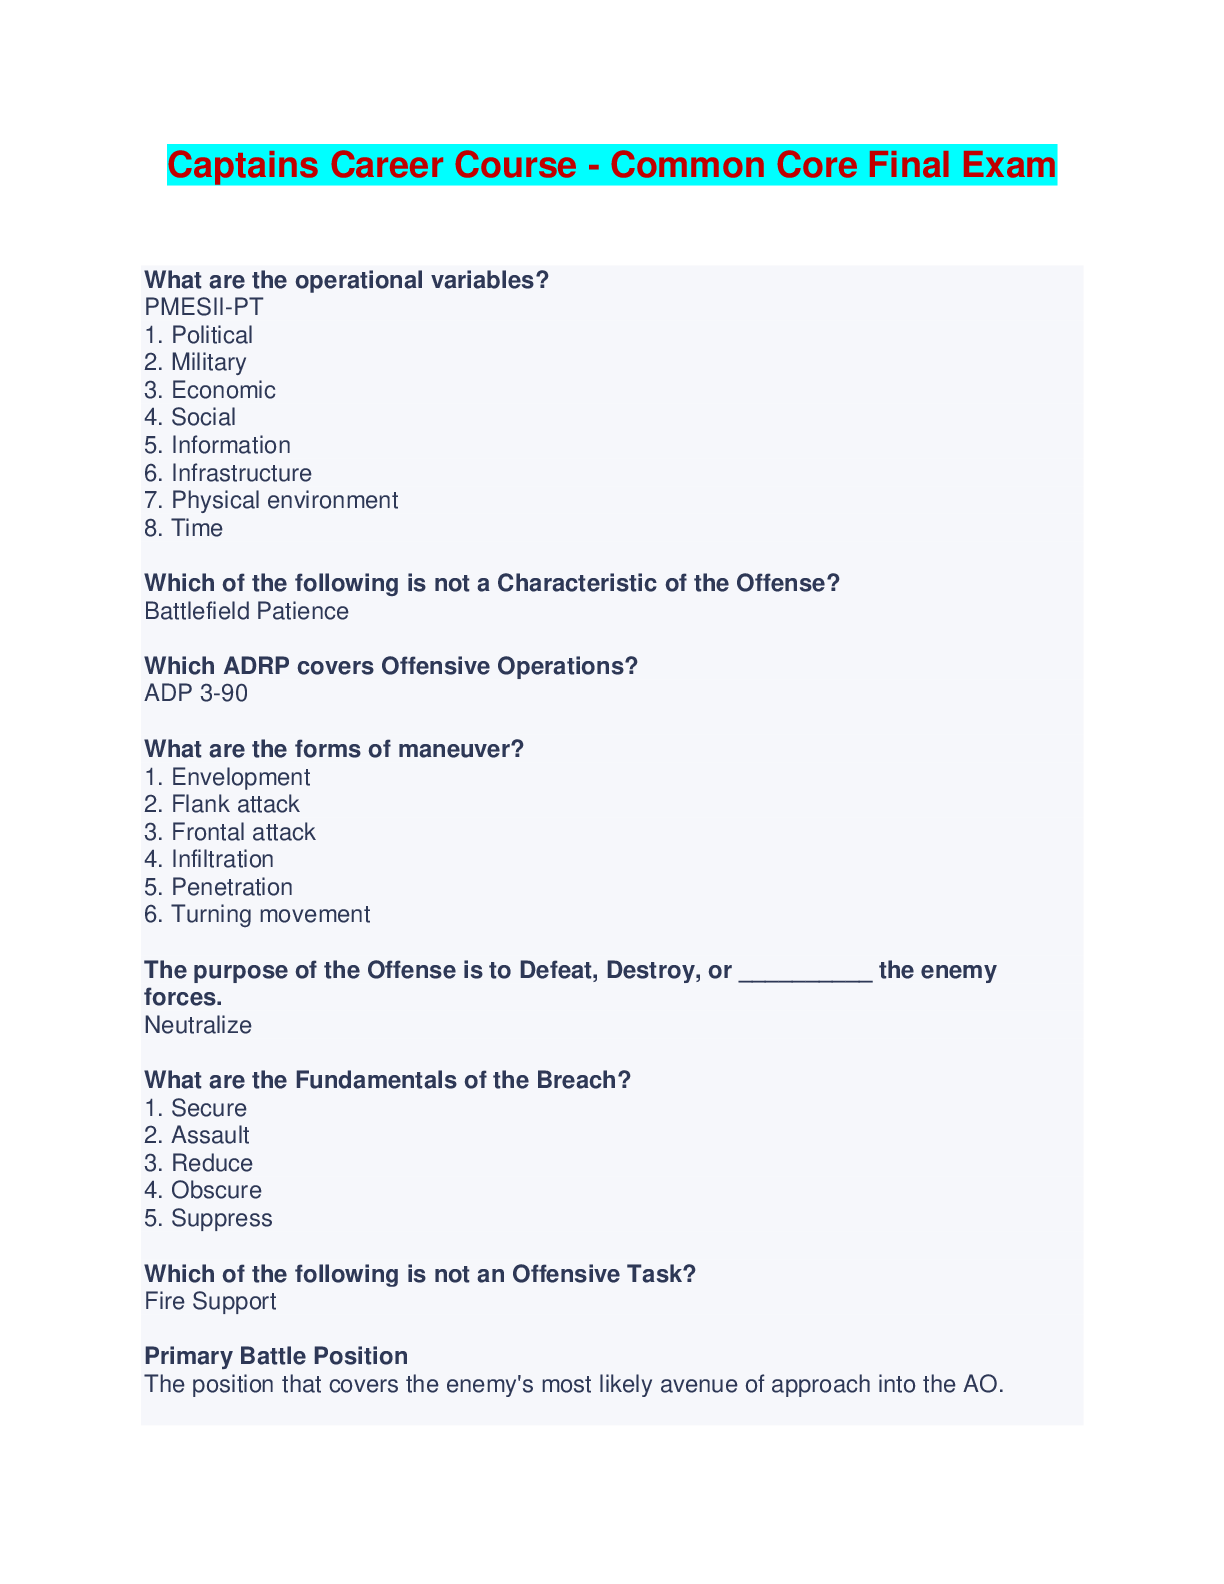
Captains Career Course - Common Core Final Exam Q & A
$ 12

COMP 230 Week 5 iLab VBScript Modular Lab Report
$ 14

TMN 3701 ASSIGNMENT 3 2023 QUESTIONS AND ANSWERS
$ 5

MN 502 Unit 4 Quiz - Question and Answers | LATEST ANSWERS
$ 13

SOLVED EXAM!!! ENG 201 Engineering and Manufacturing Development Exam.docx Test Prep
$ 13
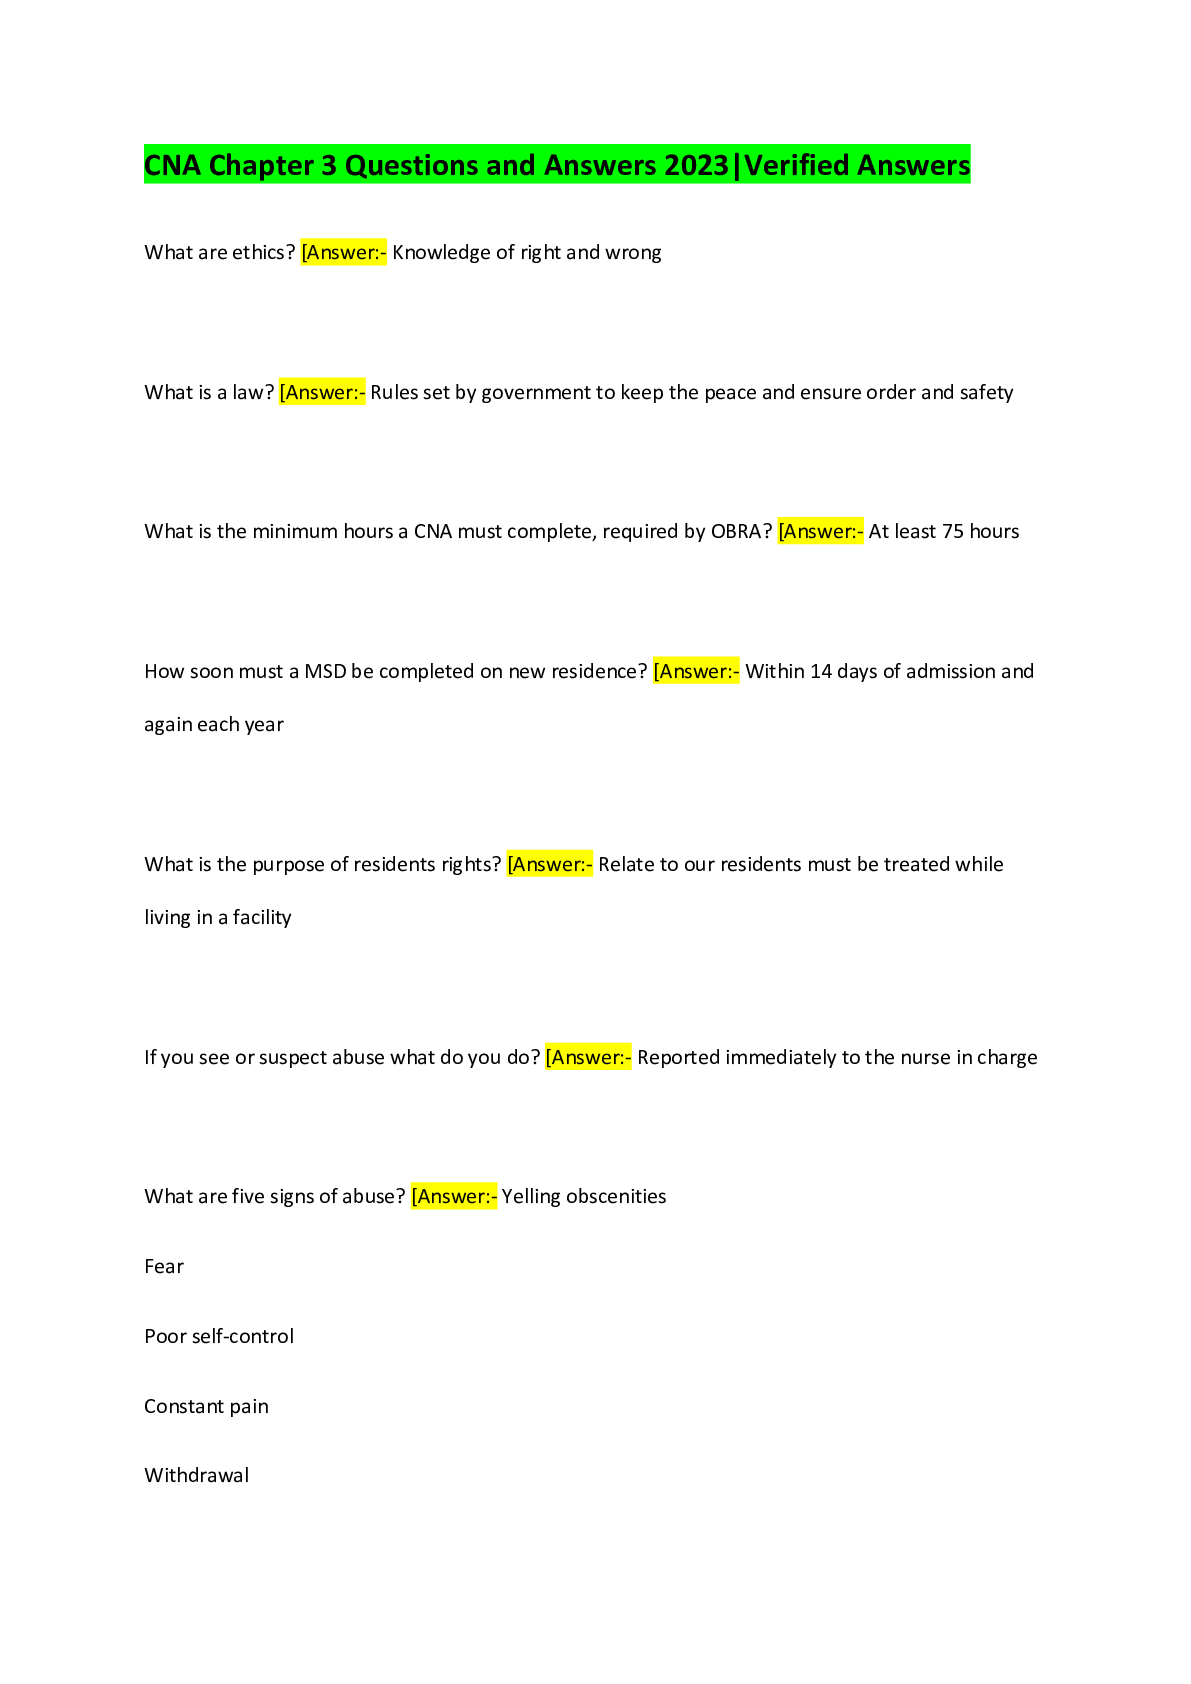
CNA Chapter 3 Questions and Answers 2023|Verified Answers
$ 6
Business Analytics Data Analysis and Decision Making, 7th Edition By Christian Albright, Wayne Winston [PDF] [eBook]
$ 25

CON 237 Test 1 (A) with complete solution(Although this is not the latest exam,it consists of frequently tested questions with the correct answers)
$ 10
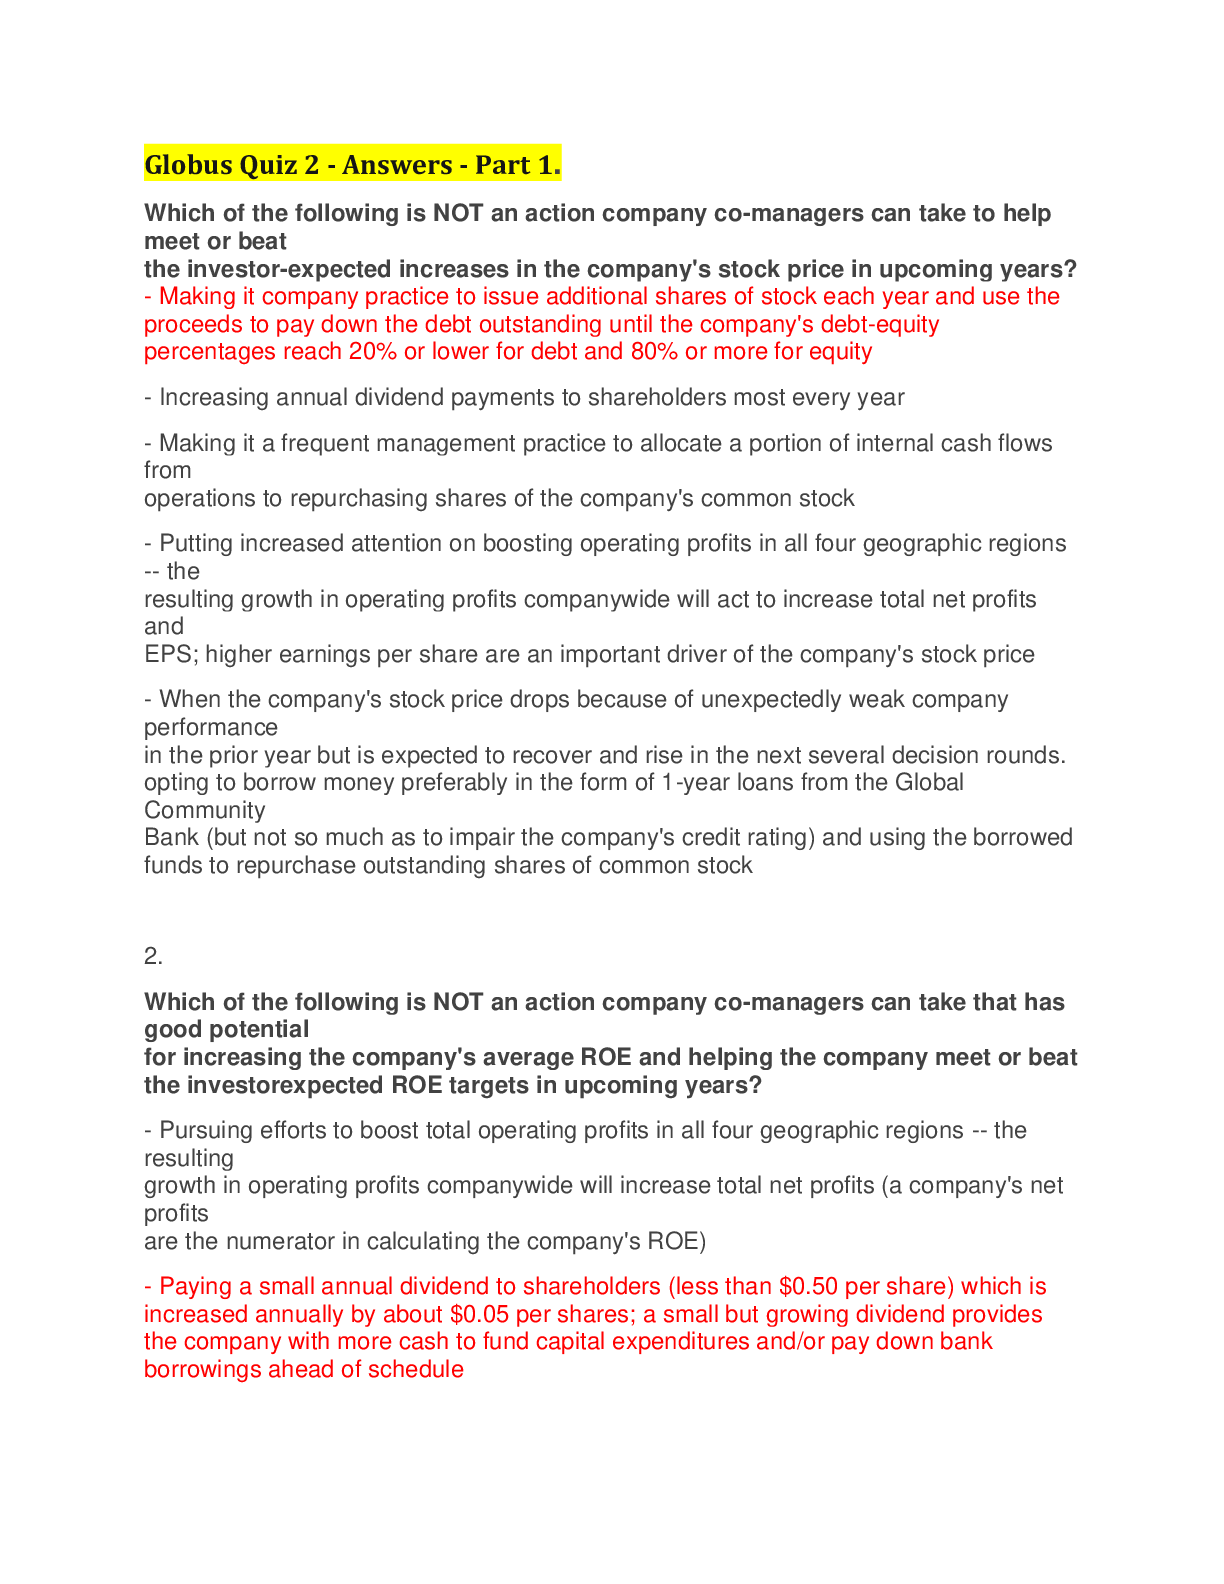
Globus Quiz 2 Questions and Answers Part 1,Spring 2023.
$ 10
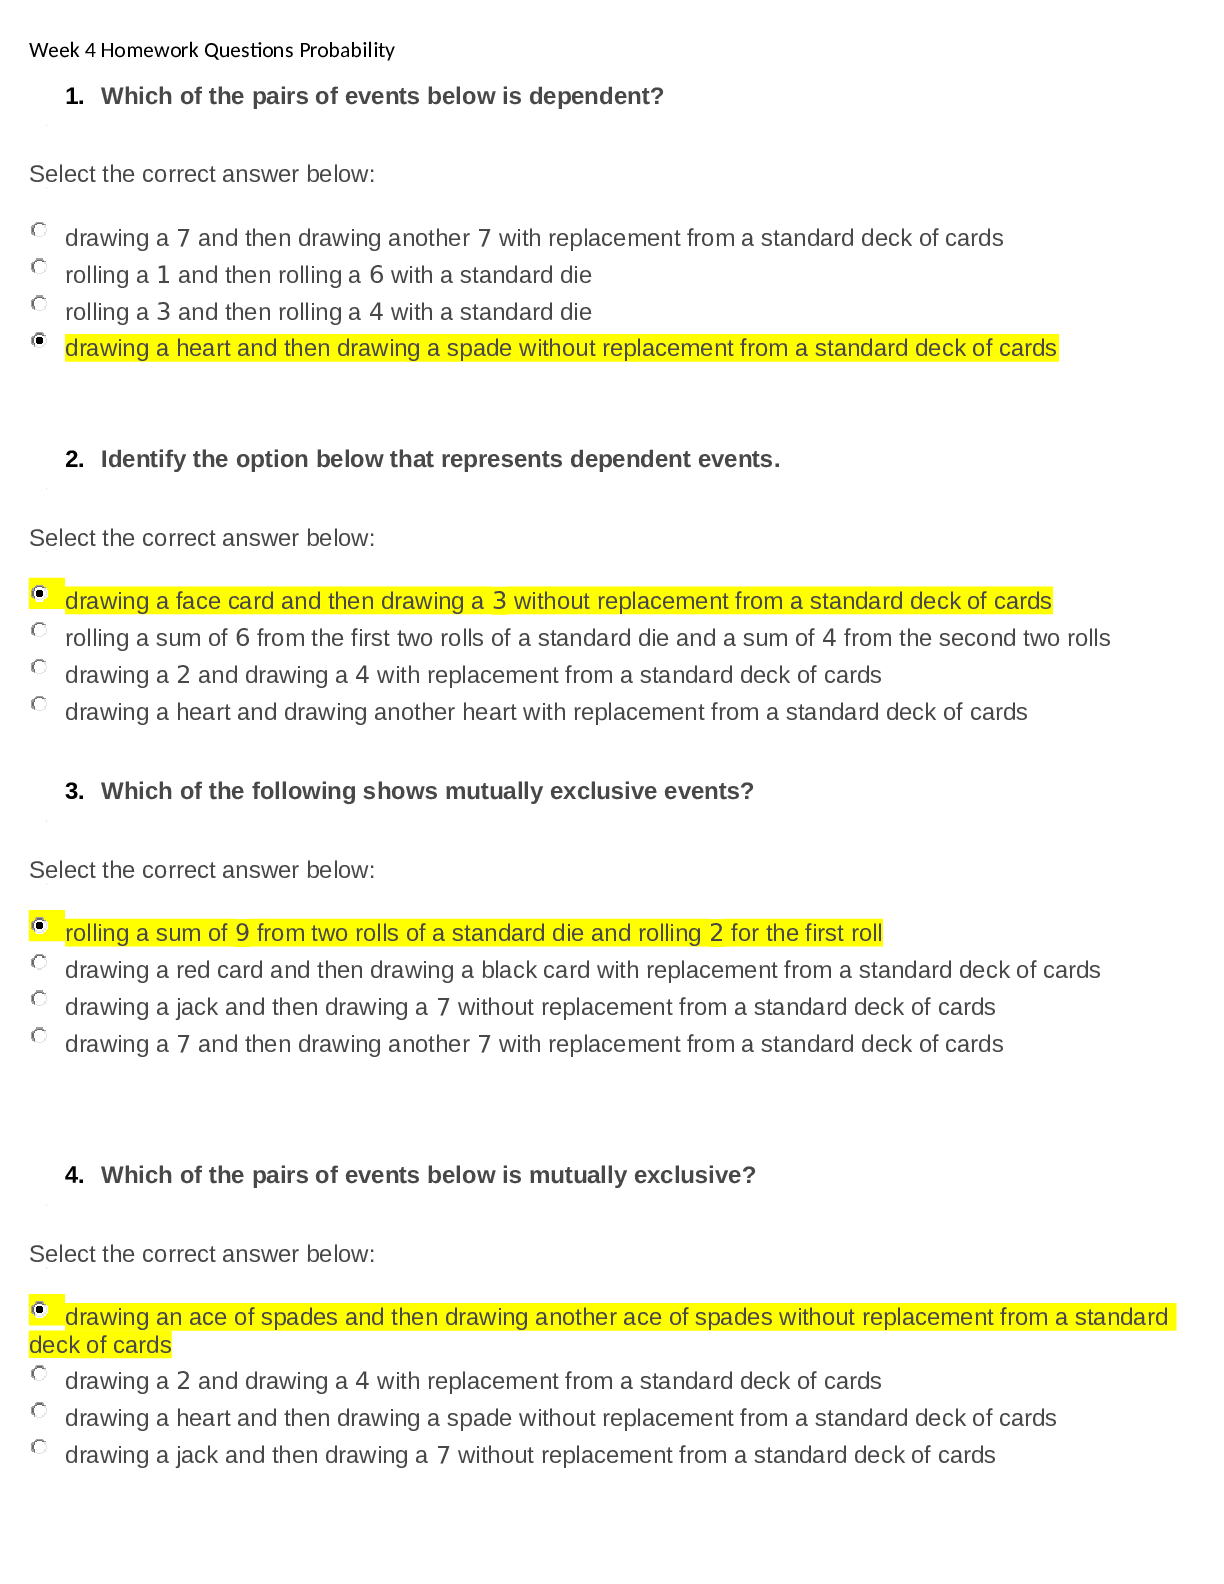
Probability Questions and answers Latest 2022 2023
$ 10
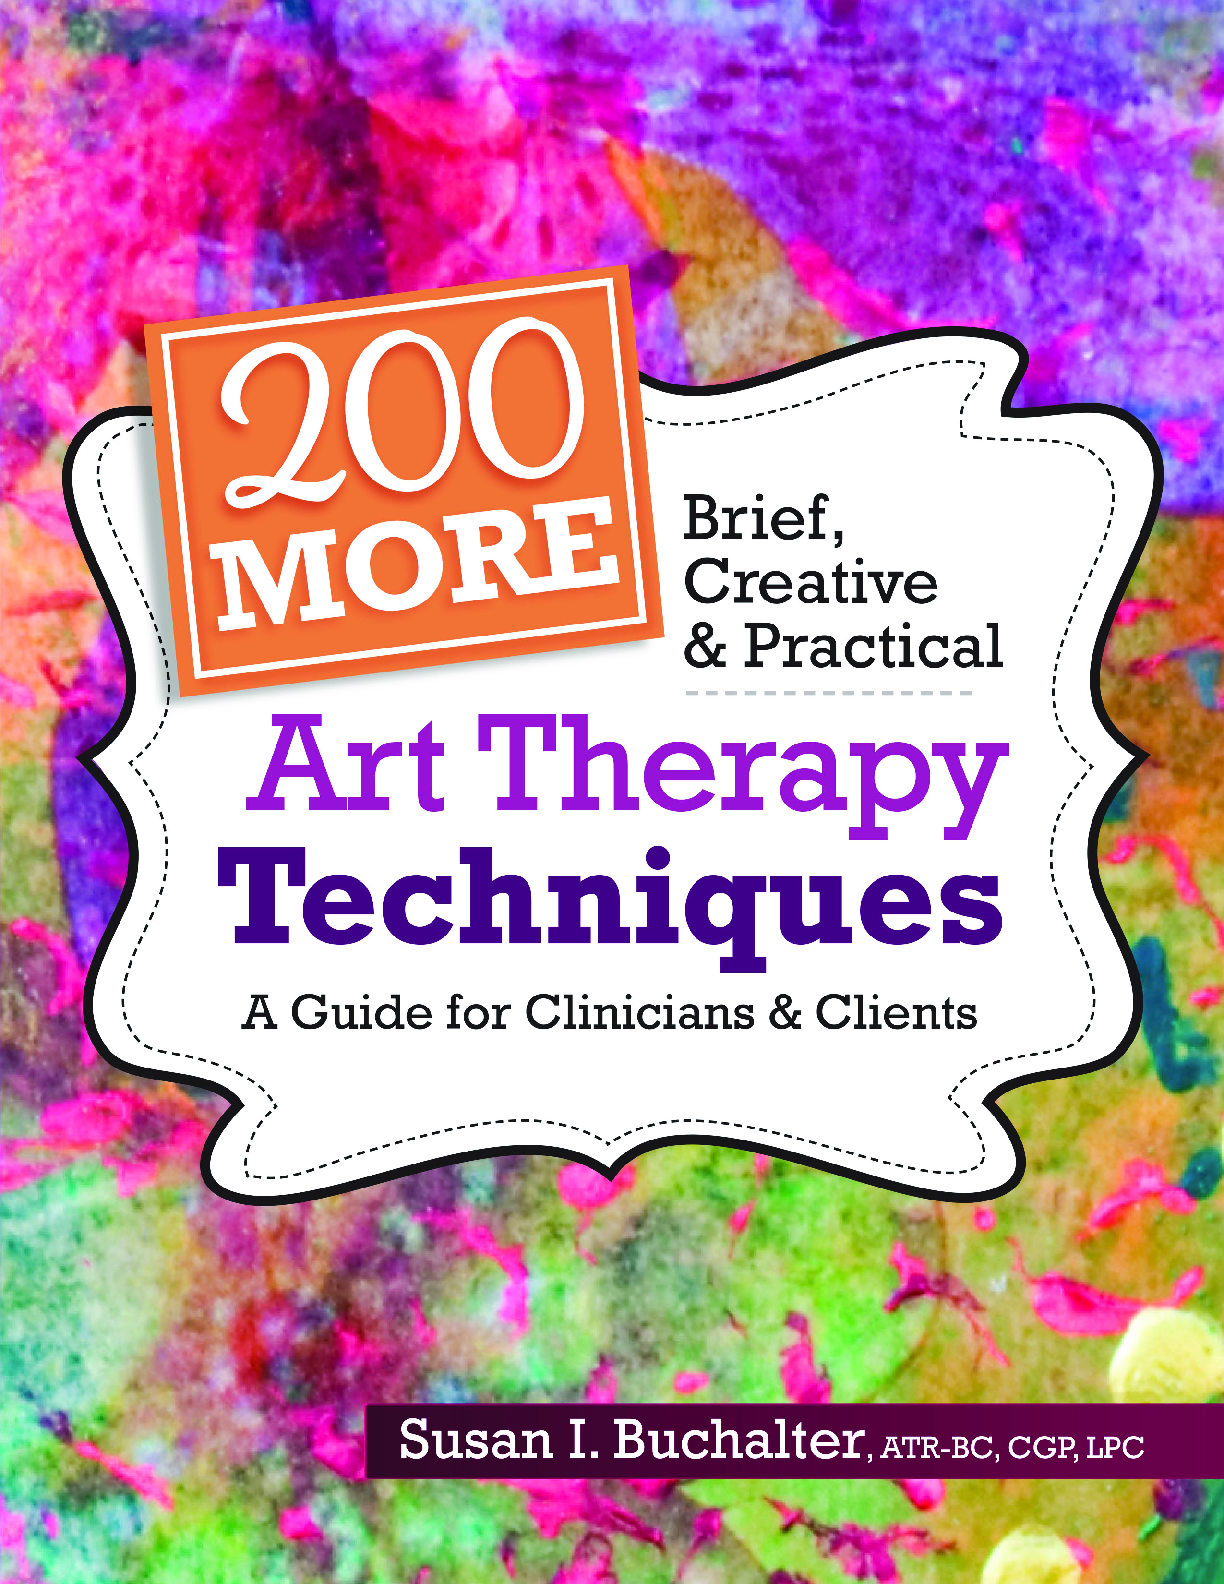
eBook 200 More Brief, Creative & Practical Art Therapy Techniques A Guide for Clinicians & Clients 1st Edition By Susan I Buchalter
$ 29
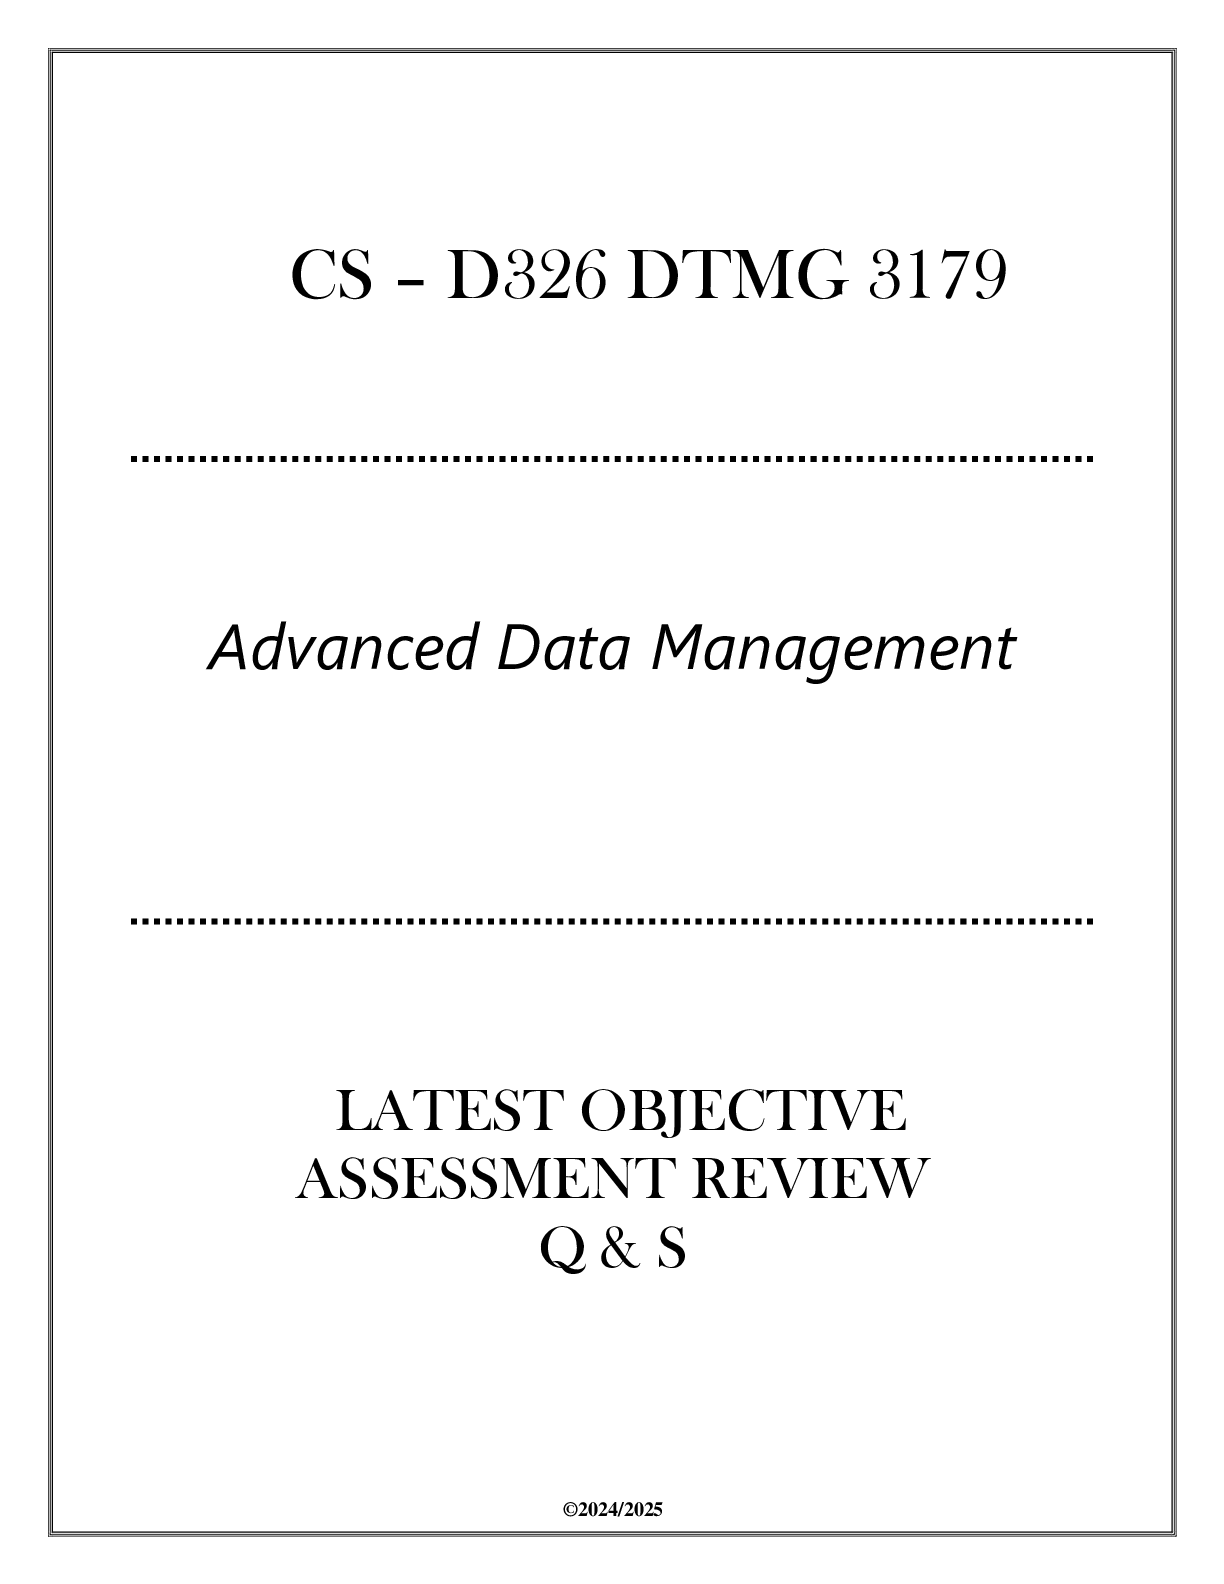
(CS-D326) DTMG 3179 Advacned Data Management - Latest OA Review Q & S 2024
$ 13
ATLS POST TEST LATEST 2025 GRADED A+
$ 11
IS 187 ( Computer Architecture & Troubleshooting I ) Latest Midterms Review Q & S 2024
$ 12
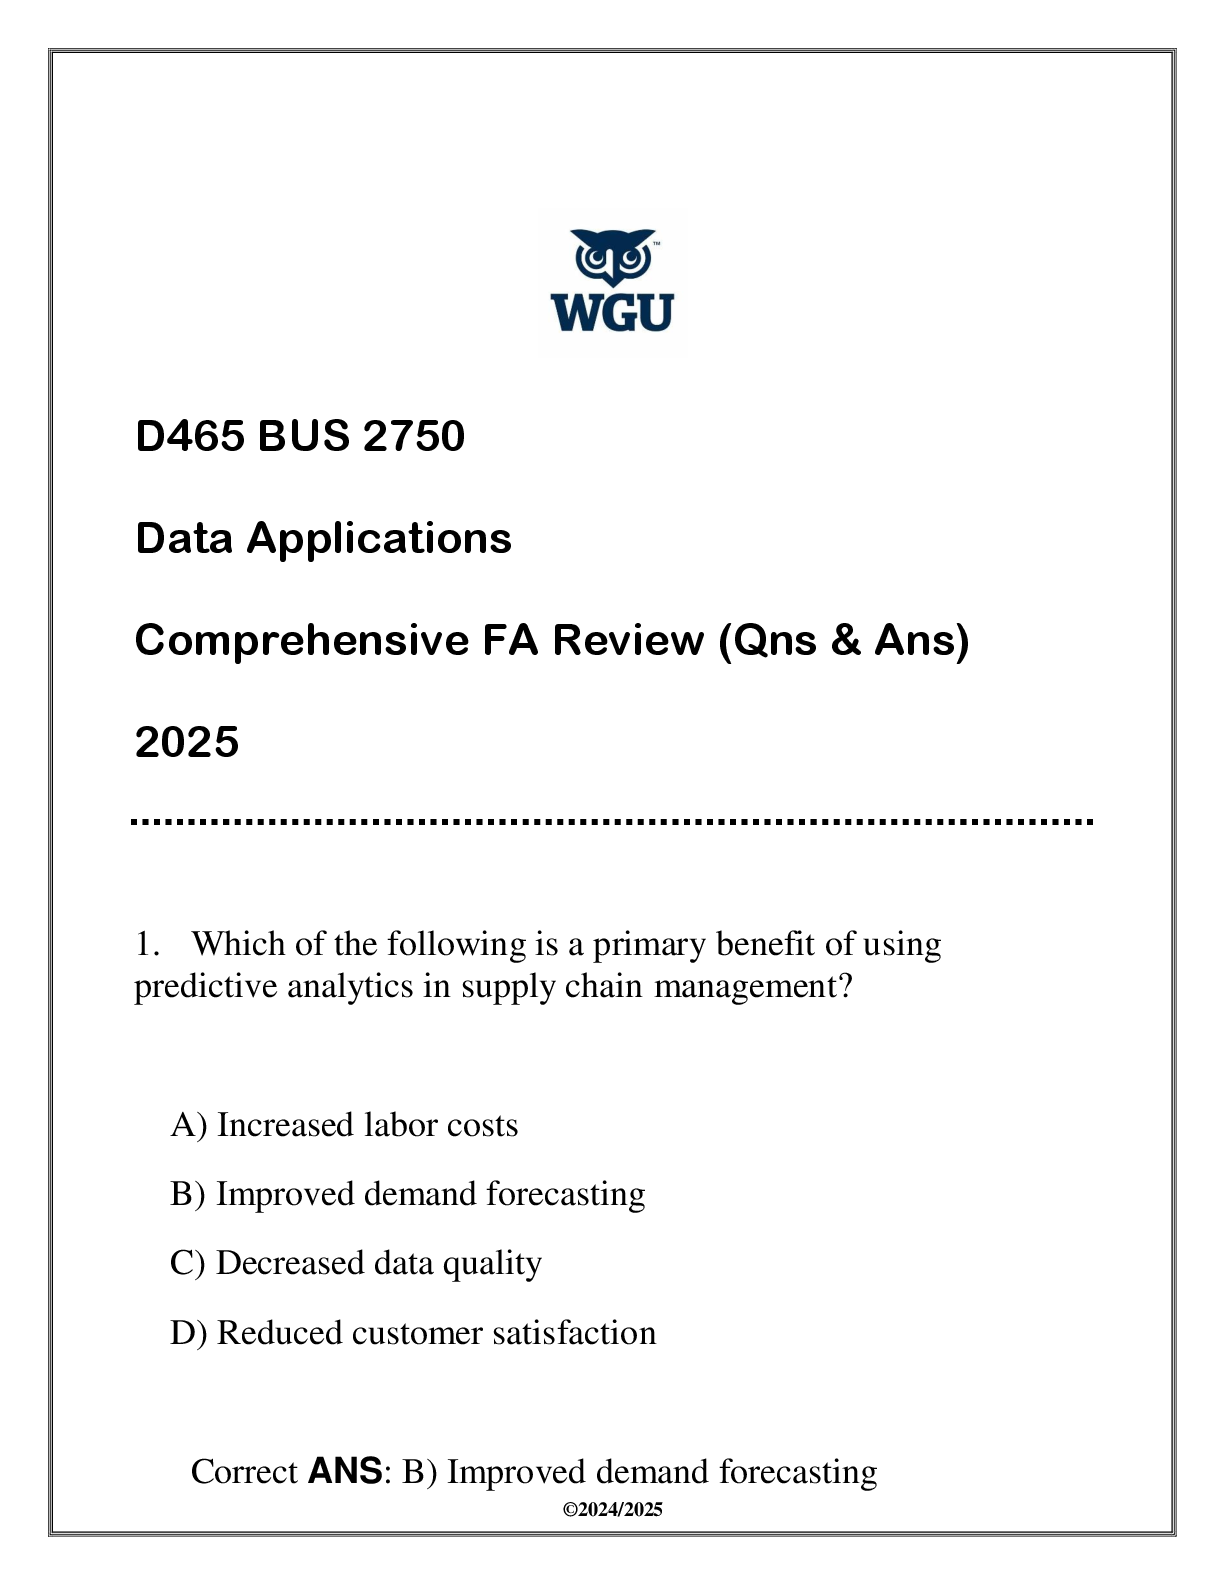
D465 BUS 2750 (Data Applications) Comprehensive FA Review Qns & Ans 2025
$ 11
(WGU D184) - EDUC 5064 Standards-Based Assessment - OA Review 20242025
$ 11
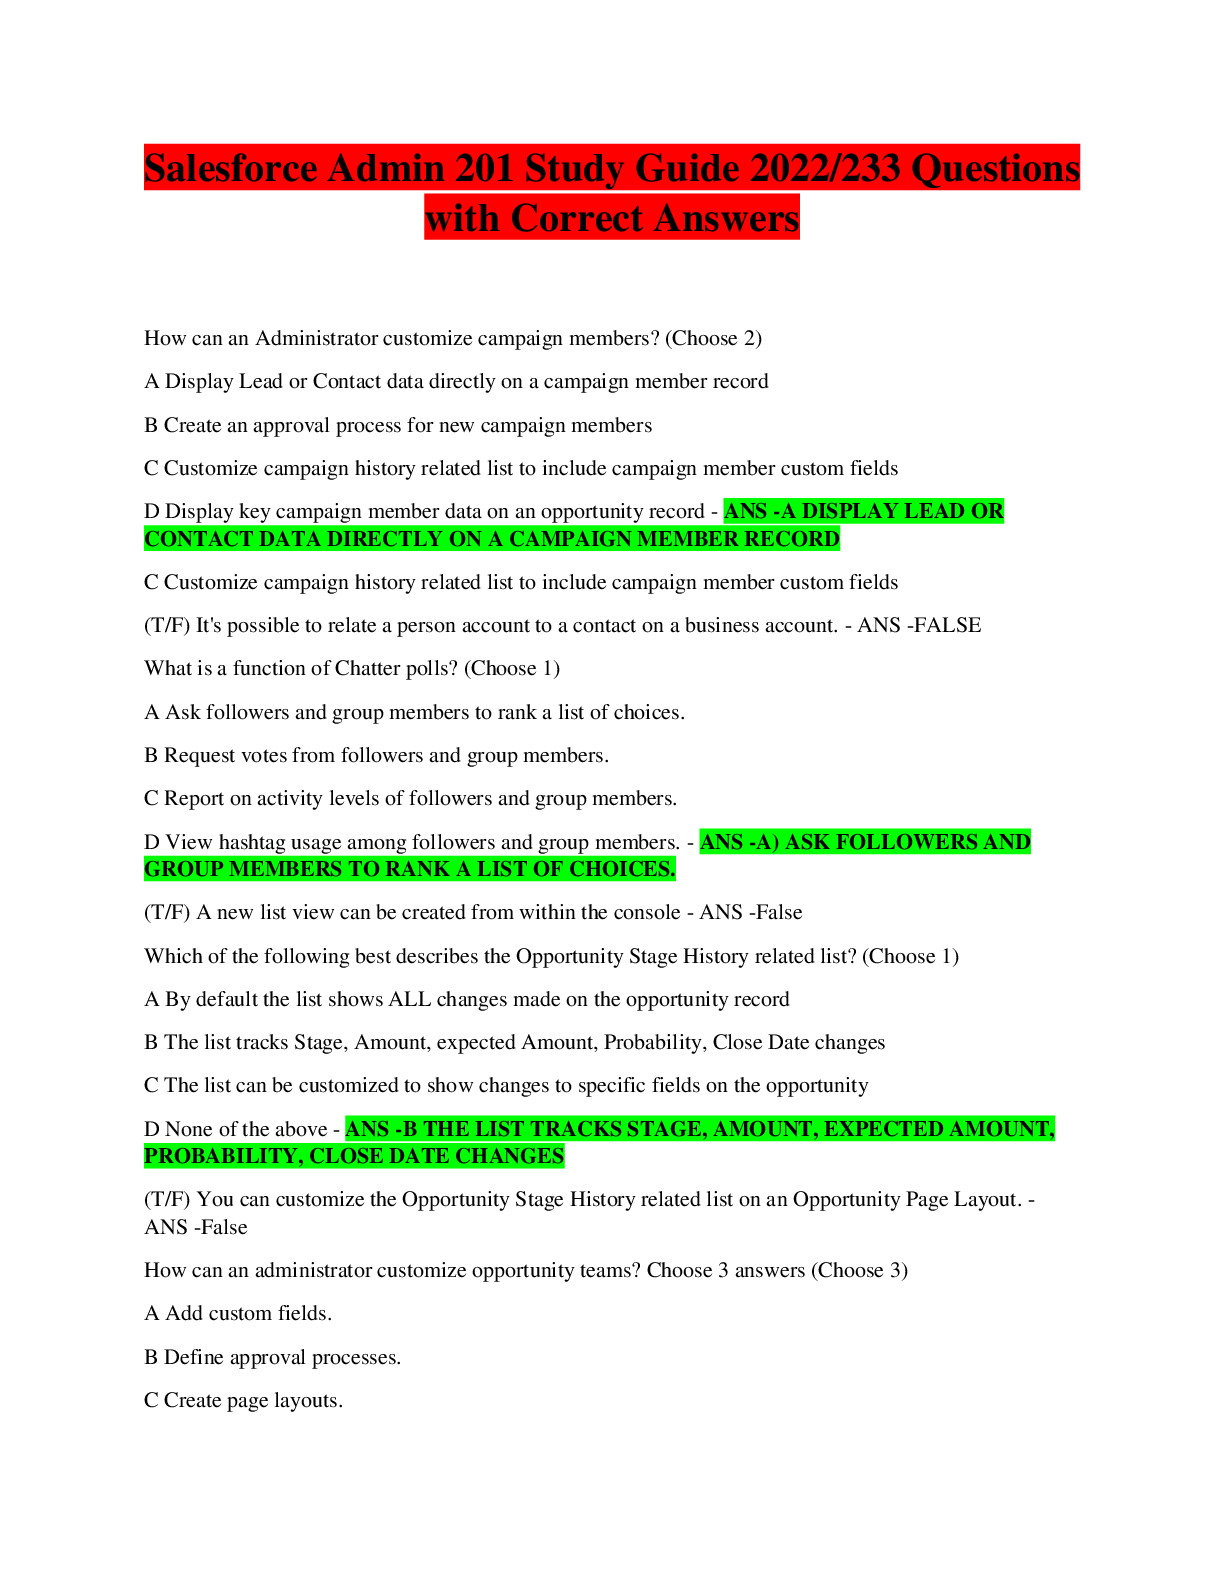
Salesforce Admin 201 Study Guide 2022/233 Questions with Correct Answers
$ 9
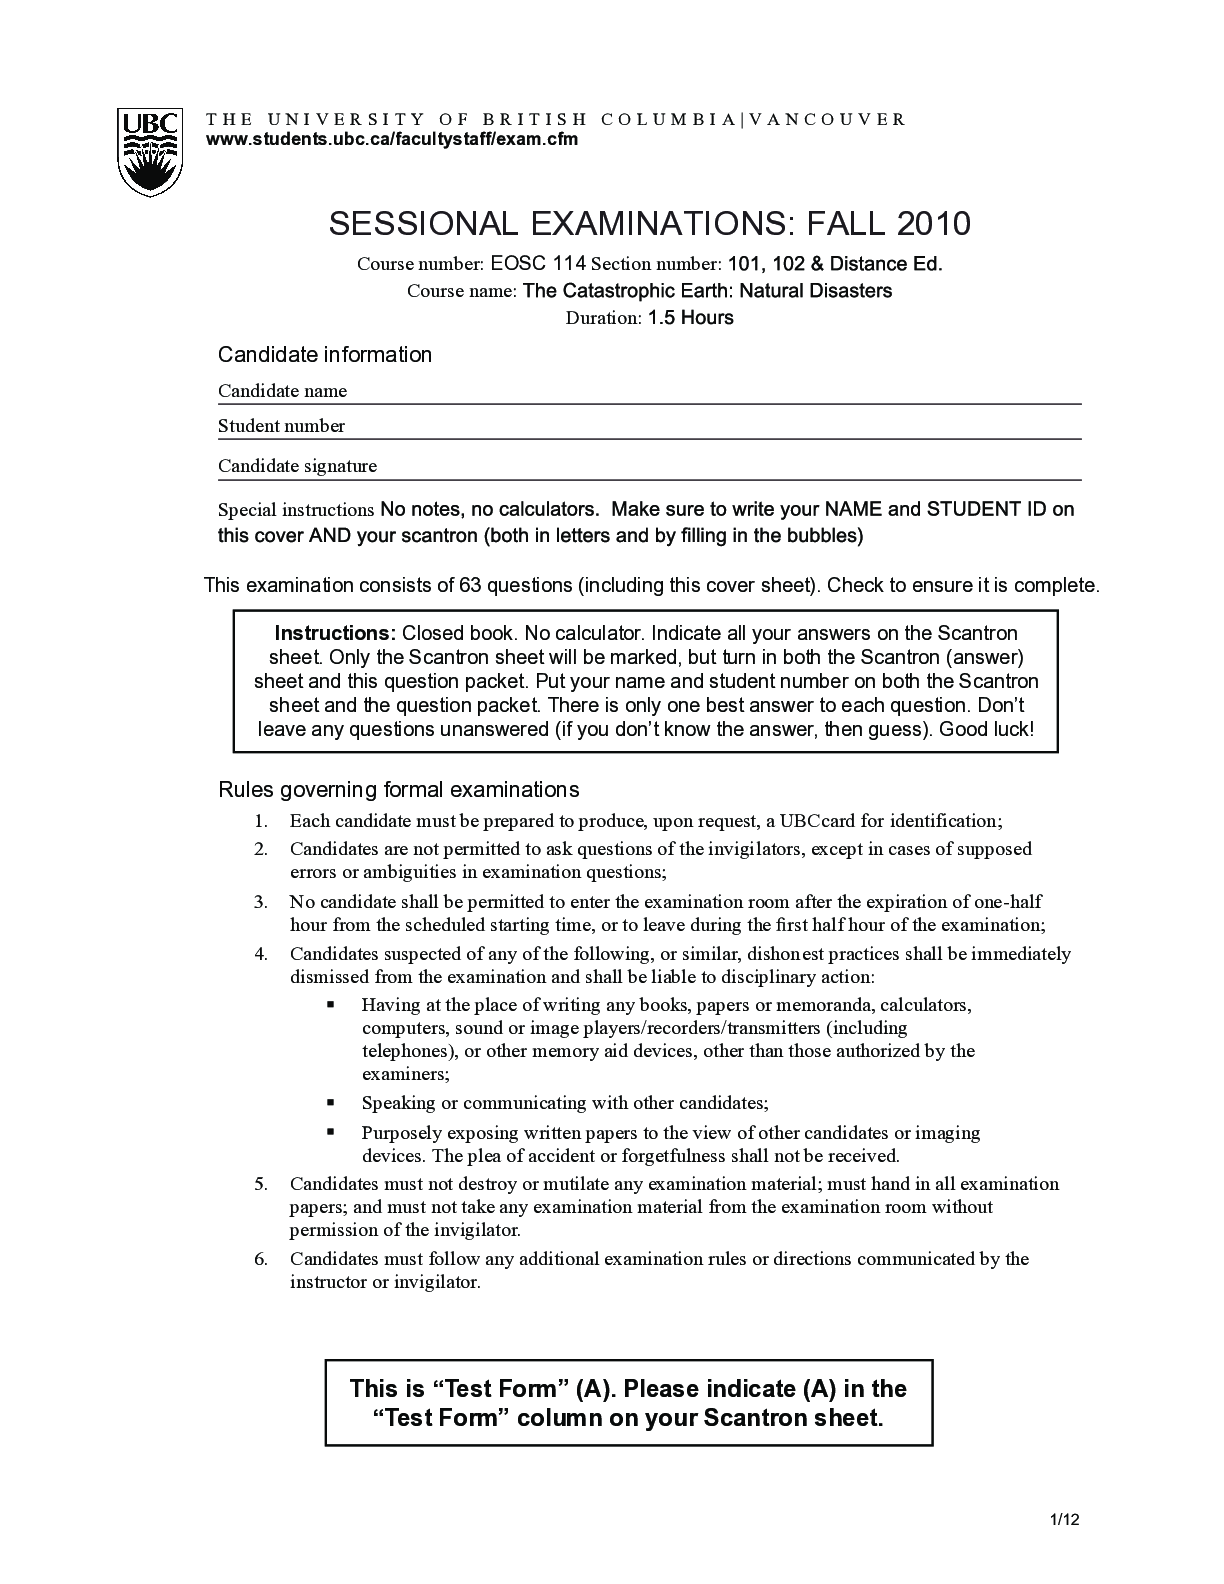
University of British ColumbiaEOSC 114EOSC114 Final Exam - Version A, VERY HELPFUL. DOWNLOAD TO GET A GOOD SCORE.
$ 7

OCR GCE Physical Education H55503 Socio-Cultural Issues in Physical Activity and Sport A Level Mark Scheme for June 2022


.png)