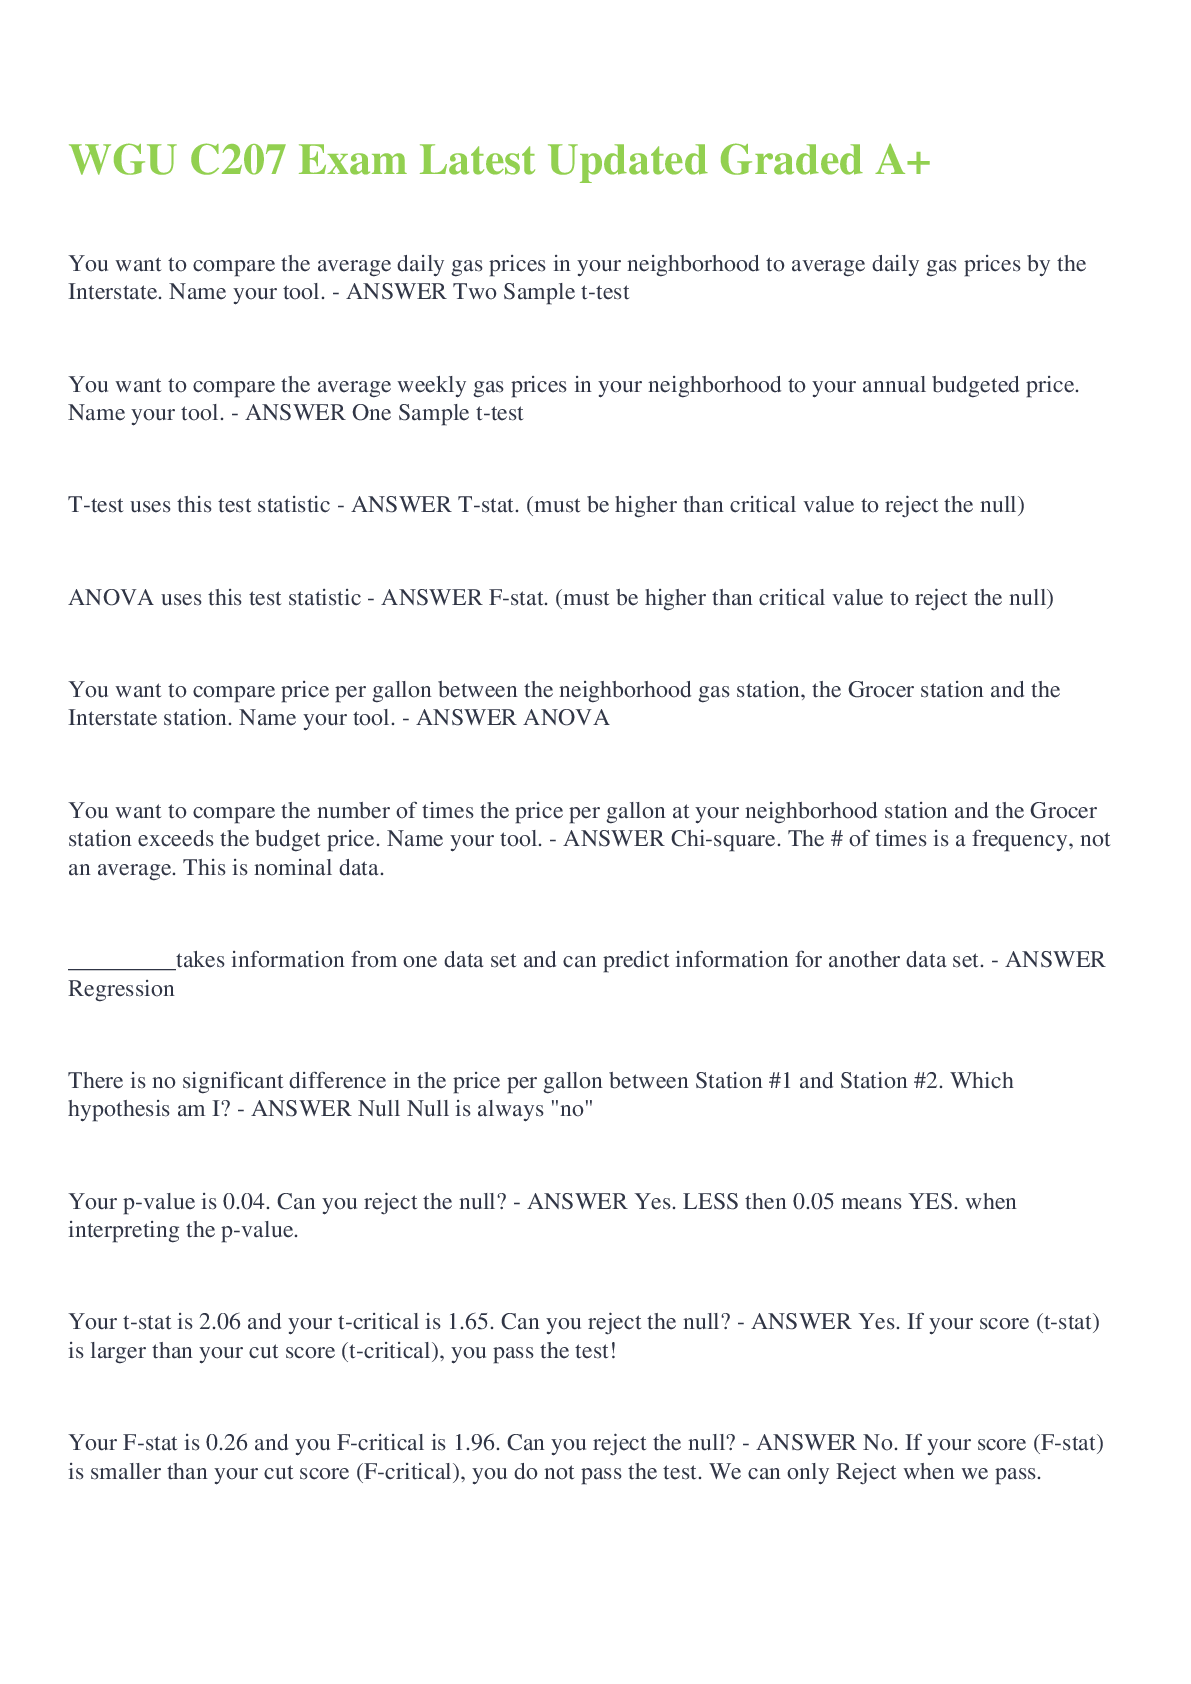
You want to compare the average daily gas prices in your neighborhood to average daily gas prices by the Interstate. Name your tool. - ANSWER Two Sample t-test
You want to compare the average weekly gas prices in your
...
You want to compare the average daily gas prices in your neighborhood to average daily gas prices by the Interstate. Name your tool. - ANSWER Two Sample t-test
You want to compare the average weekly gas prices in your neighborhood to your annual budgeted price. Name your tool. - ANSWER One Sample t-test
T-test uses this test statistic - ANSWER T-stat. (must be higher than critical value to reject the null)
ANOVA uses this test statistic - ANSWER F-stat. (must be higher than critical value to reject the null)
You want to compare price per gallon between the neighborhood gas station, the Grocer station and the Interstate station. Name your tool. - ANSWER ANOVA
You want to compare the number of times the price per gallon at your neighborhood station and the Grocer station exceeds the budget price. Name your tool. - ANSWER Chi-square. The # of times is a frequency, not an average. This is nominal data.
_________takes information from one data set and can predict information for another data set. - ANSWER Regression
There is no significant difference in the price per gallon between Station #1 and Station #2. Which hypothesis am I? - ANSWER Null Null is always "no"
Your p-value is 0.04. Can you reject the null? - ANSWER Yes. LESS then 0.05 means YES. when interpreting the p-value.
Your t-stat is 2.06 and your t-critical is 1.65. Can you reject the null? - ANSWER Yes. If your score (t-stat) is larger than your cut score (t-critical), you pass the test!
Your F-stat is 0.26 and you F-critical is 1.96. Can you reject the null? - ANSWER No. If your score (F-stat) is smaller than your cut score (F-critical), you do not pass the test. We can only Reject when we pass.
Your reject the null hypothesis. Did you find significance? - ANSWER Yes. Rejecting the null ("no") means we found something statistically significant. Yay!
The process of arranging terms or values based on different variables into "natural" groups - ANSWER Cluster Analysis
A local grocer datamines to target customers who use gas points so they can market other products. Which tool is this? - ANSWER Cluster Analysis
Best decision based on estimated value - ANSWER Decision Tree
Based on the limited storage tanks and pumps, a gas station determines the right "mix" of gasoline and diesel to carry each month. - ANSWER Linear Programming
A station decides to set up self-serve vending for beverages. Which tool helps determine when they will begin to profit? - ANSWER Break Even Analysis
A station has three vendors with various packages to offer. Which tool would assist in determining the optimal package at the correct "volume"? - ANSWER A station has three vendors with various packages to offer. Which tool would assist in determining the optimal package at the correct "volume"?
A disadvantage of cluster analysis is - ANSWER It is a long and expensive process.
Advantages of ____ Analysis: Determines the decision with the greatest value Produces a value under certainty, uncertainty, and risk - ANSWER Decision Analysis
Disadvantage of _____ Analysis: Assumes past data patterns will repeat in future, which may not be true - ANSWER Time Series
Advantage of ___ Analysis: Helps determine target markets - ANSWER Cluster Analysis
Advantage of ____ Analysis: Allows sophisticated analysis of cost behavior and sales forecasts - ANSWER Regression Analysis
Regression determines the - ANSWER relationship between two data sets
Goodness of fit is defined by - ANSWER R-squared How much of the dependent variable can be determined by the independent variable?
The p-value of your regression analysis comes out to be 0.62. Is the independent variable a significant predictor of the dependent variable? Can we reject the null? - ANSWER No. LESS than 0.05 means Yes. 0.62 is higher than 0.05. No significance.
The R-squared value is 0.71. Is this a strong goodness of fit? - ANSWER Yes. On a scale of 0% - 100%, 71% is a strong fit. 71% of the dependent is made up from the independent.
We wish to determine if the minutes student spend taking a test can predict their test score. In this scenario, which is the independent variable? - ANSWER Minutes spend taking the test.
As a new manager, you analyze the number of clicks into your website each subscriber makes in a month to determine how much they spend. In this scenario, spending is which variable? - ANSWER Dependent. The dependent is always what we are trying to predict.
Can correlation be a negative number? - ANSWER Yes.
True or False: -0.99 is a stronger relationship than 0.74 - ANSWER TRUE
Linear regression is often referred to as - ANSWER Ordinary Least Squares (OLS) Regression
y = 10x + 50. Solve for y if x = 10 - ANSWER y = 10(10) + 50 y = 150
Our regression module for number of clicks predicting spending on our website is y = 6 + 5x. If a subscriber has 4 clicks, how much will they spend? - ANSWER y = 6 + 5(4) y = 26
Multiple regression uses more than one _____ variable. - ANSWER Independent
Occurs when a given data point on a time series analysis is affected by a previous data point for that time series. - ANSWER Autocorrelation
Occurs when all of the random variables have the same general finite variance. - ANSWER Homoscedasticity
The random variables have an unequal spread of variances - ANSWER Heteroscedasticity
Can be applied when the dependent variable is a categorical, binary variable. - ANSWER Logistic Regression
We use the amount of snow fall in inches to predict if Suzie calls off work. Which regression is this? - ANSWER Logistic. Calling off work is binary. Yes or no.
We use the amount of snow fall in inches monthly to predict employee call-off rates. Which regression is this? - ANSWER Linear or Least Squares regression. Call-off rates are numbers.
We use the amount of snow fall in inches monthly and the employee's previous call off rates to predict call offs next month. Which regression is this? - ANSWER Multiple. We have more than one independent variable.
We use the amount of snow fall in inches monthly and the employee's previous call off rates to predict call offs next month. This analysis can be affected by ______. - ANSWER Autocorrelation. Whenever time is an independent variable, you can may this.
y = 50 + 20x1 - 10x2. If x1 = 2 and x2 = 6, solve for y. - ANSWER y = 50 + 20(2) - 10(6) y = 50 + 40 - 60 y = 30
Correlation is not _________ - ANSWER Causation
A good sample of the population being studied will be the right size and ___________ - ANSWER Random
If a sample is not random it creates ____________ - ANSWER Measurement Bias
If a sample is not the right size it creates ___________ - ANSWER Measurement Bias
Measuring the housing market in North Carolina when making an inference about the entire East coast is an example of __________ - ANSWER Non-representative Sample
Lemonade sales increase when it is warmer than 75 degrees. Weather and lemonade are __________ - ANSWER Correlated. "NOT CAUSE"
Pulling names from a hat is a tool to create a ______ sample - ANSWER Random
Asking participants to taste test a yellow candy and a blue candy and select one can create bias. How can we prevent bias? - ANSWER Blinding
You are taking a survey and the question is leading. It seams advantageous to answer a specific way. What type of bias is this? - ANSWER Conscious KEYWORD: Benefit
A question is not leading, but you feel your boss might want you to answer a specific way - ANSWER Response You feel there is an "expected" response and may not answer honestly (no leading )
spread of the data - ANSWER Standard Deviation A normally distributed sample spreads from -3 to +3 standard deviations from the mean
We should not use this measure of central tendency alone for decisions because it includes outliers - ANSWER Mean
The best measure of central tendency when making decisions - ANSWER Median
We use this measure of central tendency if we want to know what happens the most - ANSWER Mode (most can also be defined as typical or common)
If the mean is 50 and the standard deviation is 5, what is the probability of being between 45 and 55? - ANSWER 68.2% (of the sample will be within 1 standard deviation of the mean) 50 - 5 = 45 and 50 + 5 + =55
What are the three probabilities of the bell curve? - ANSWER 68.2% 95.4% 99.7%
68.2% of a sample will be within _______ standard deviation of the mean. - ANSWER 1
95.4% of a sample will be within ______ standard deviations of the mean. - ANSWER 2
99.7% of a sample will be within _____ standard deviations of the mean. - ANSWER 3
The mean is 20 and the standard deviation is 2, what is the probability of being between 14 and 26 - ANSWER 99.7% (of the sample will be within 3 standard deviations of the mean) 20 + 2 + 2 + 2 = 26 and 20 - 2 - 2 - 2 = 14
_______ can be used to differentiate between two samples with the same mean. - ANSWER Variation
Which measurement can tell us where a single data point is on the bell curve? - ANSWER z-score. (Tip: Remember z for me. Where are you in the curve of your peers)
You want to know how your height compares to all of your family tree. How do you calculate a z score? - ANSWER (Your height - the mean of the family tree height) divided by the standard deviation of the family tree height (me-mean)/standard deviaiton
You are 63" tall and the family tree averages 67" with a standard deviation of 2". What is your z-score? - ANSWER (63-67)/2 = -2 You are 2 standard deviations shorter than the family tree.
Which measure lets you measure your height compared to your maternal family tree and your height compared to your paternal family tree? - ANSWER z-scores let us measure two samples by putting them to the same scale.
There are four shopping carts available and one has a broken wheel. What is your probability of selecting the cart with the broken wheel? - ANSWER 25% (1/4 = 0.25)
There is a 20% of parking close to the door and a 30% chance of getting the shopping cart with a squeaky wheel. How do we calculated the probability of both events occurring? - ANSWER Multiply Key Words: AND, ALL, BOTH
There is a 20% of parking close to the door and a 30% chance of getting the shopping cart with a squeaky wheel. How do we calculated the probability of either event occurring? - ANSWER Addition Key Words: OR, EITHER
Multiplying two events calculates an ____________ - ANSWER Intersection
Adding two events calculates a _______________ - ANSWER Union
The grocer is running a 10 for $10 special on cans of soup. You can mix and match the 5 different flavors of soup. You decide to purchase 10 cans. What can we use to count all the possible outcomes of flavors picked? - ANSWER Combination
There is a 90% chance you will have to wait in line for more than 6 minutes to check out at the grocer. What is the complement? - ANSWER 10%. If there is a 90% chance of yes, then there is a 10% chance of no. 90% + 10% = 100%
50% chance it will rain. There is a 20% chance you park in the garage in the rain and a 60% chance you park there if it is not raining. Given you are parked in the garage, what is the probability it is raining? Which probability technique applies? - ANSWER Bayes
You conduct a quick survey asking friends to rate your new website on a scale of 1 - 10. Which graph will show how the responses are distributed? - ANSWER Histogram. Keyword: Distribution (How many people answered 1, 2, 3...... NOTE: The histogram is a bar chart
You have the number of customers that visit your website by clicking on a promotion email. Which graph can show you if sales are correlated to the number of promotional emails each week? - ANSWER Scatter Diagram Keyword: Correlation or Relationship
A relationship is stronger when r is closer to what number? - ANSWER 1 (100%)
A relationship is weakest when r is closer to what number? - ANSWER 0
As sales increase, estimated delivery times decrease. This relationship is _______ - ANSWER Negative
As the age of the customer increases, the credit score increases. This relationship is_______ - ANSWER Positive
Which tool helps us collect and organize the data for a histogram? - ANSWER Check sheet
Frame the Problem, Solving the Problem and Communicating Results are part of which decision making model? - ANSWER Davenport-Kim three-stage model
In which stage of the Davenport-Kim model is problem recognition? - ANSWER Framing the problem
In which stage of the Davenport-Kim model is data collection? - ANSWER Solving the problem
What is a key reason we study statistics? - ANSWER To make informed decisions
Visually presenting the data assists in which stage of the Davenport-Kim model? - ANSWER Communicating the results
When does research fail to produce reliable results? - ANSWER Poor research validity
What are the two major issues surrounding research standards? - ANSWER Best practices and ethics
In order to be a statistically valid sample, the sample must be: - ANSWER The appropriate size and random
Not selecting a random sample is what type of bias? - ANSWER Measurement
Not selecting a right sized sample is what type of bias? - ANSWER Measurement
Research best practices eliminate... - ANSWER Bias
Outliers create this type of error - ANSWER Out-of Range
Unpredictable error - ANSWER Random Error - No correlation
Error may occur from missing data. (Example: Space not filled in) - ANSWER Omission Error - Distorted results
This error repeats itself - ANSWER Systematic Error - Skewed results
Observation points that are distant from other observations. - ANSWER Outliers Note: Can be included or excluded in analysis (causes skewness)
Types of Bias: Bias that occurs from not selecting a random sample - ANSWER Measurement bias
Types of Bias: Bias introduced because respondents believe it will be beneficial if selected. - ANSWER Conscious bias (key word: benefit)
Consistent and repeatable data - ANSWER Reliable
Resulting from accurate measurements - ANSWER Valid data
If a responder lies on their survey, this creates what type of bias? - ANSWER Information
Sorting your spreadsheet can expose these errors by moving them to the very top or the very bottom of the column - ANSWER Omission or Out-of-Range
An error that will fix itself over time - ANSWER Random
[Show More]