*NURSING > EXAM > NUR503 Midterm Exam : Population Health, Epidemiology & Statistical Principles (All)
NUR503 Midterm Exam : Population Health, Epidemiology & Statistical Principles
Document Content and Description Below
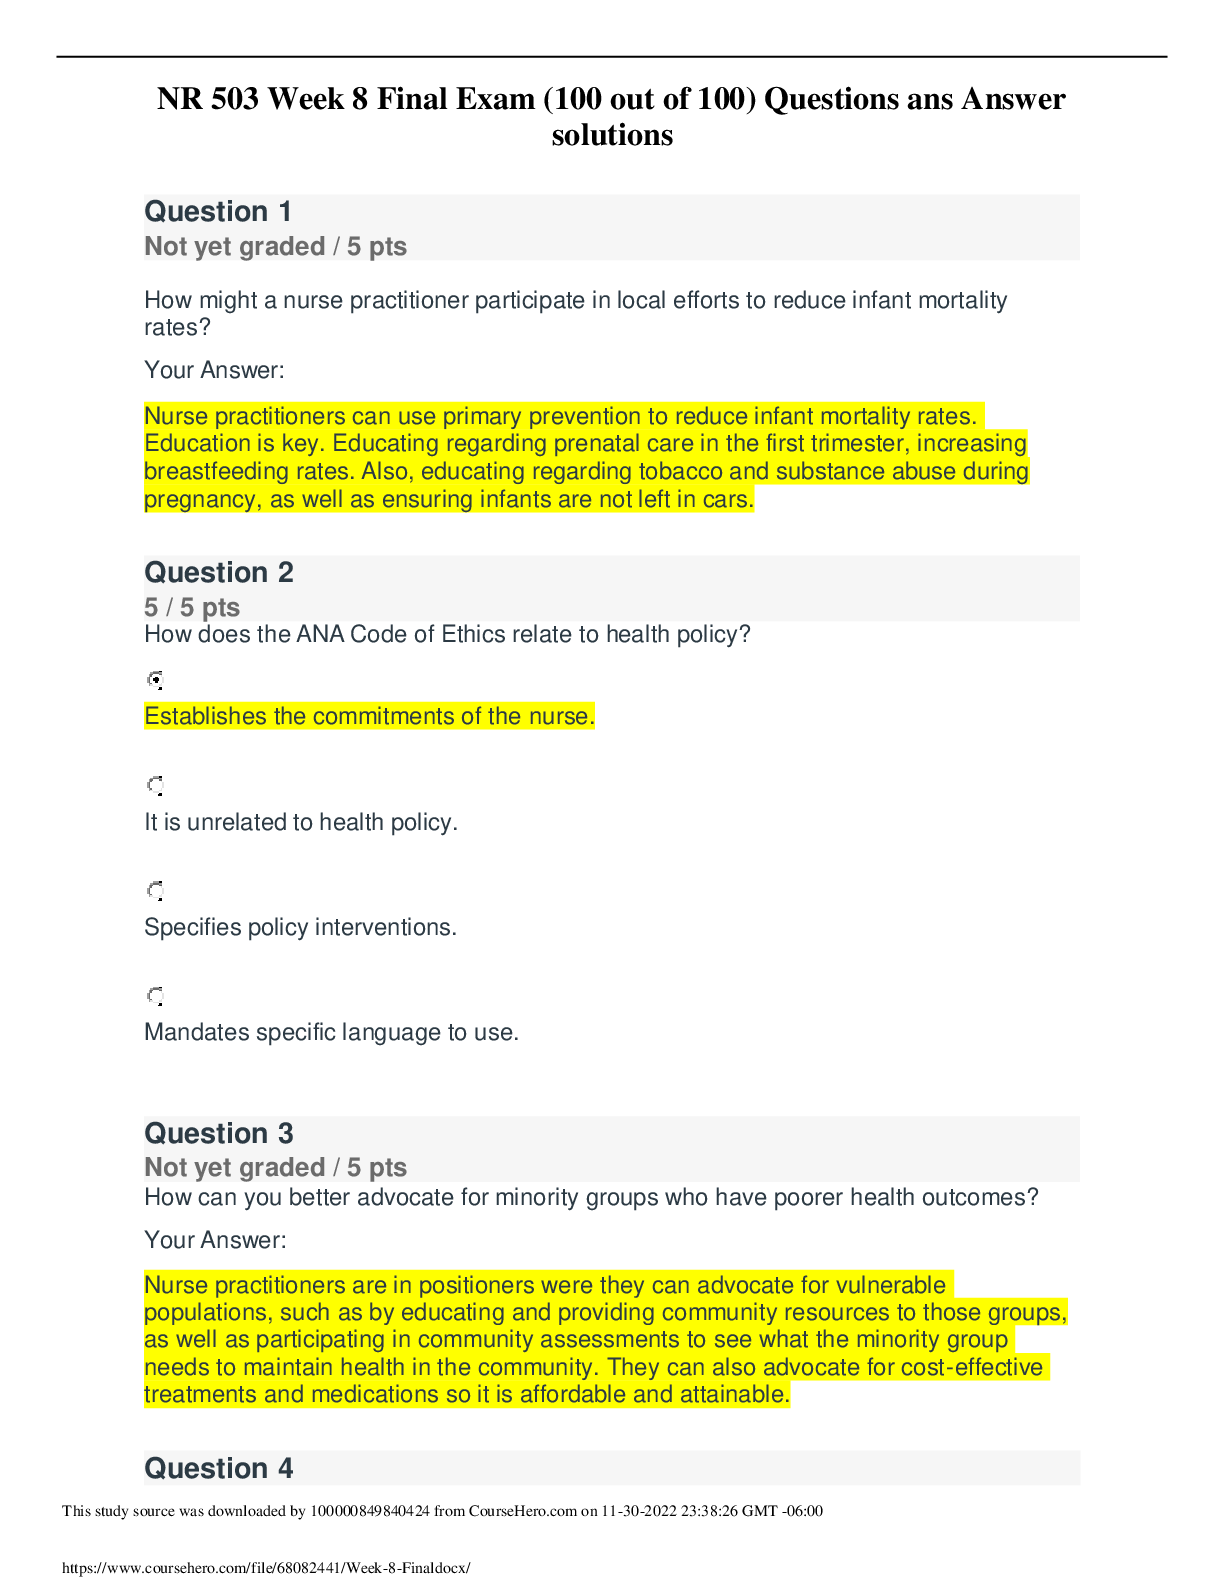
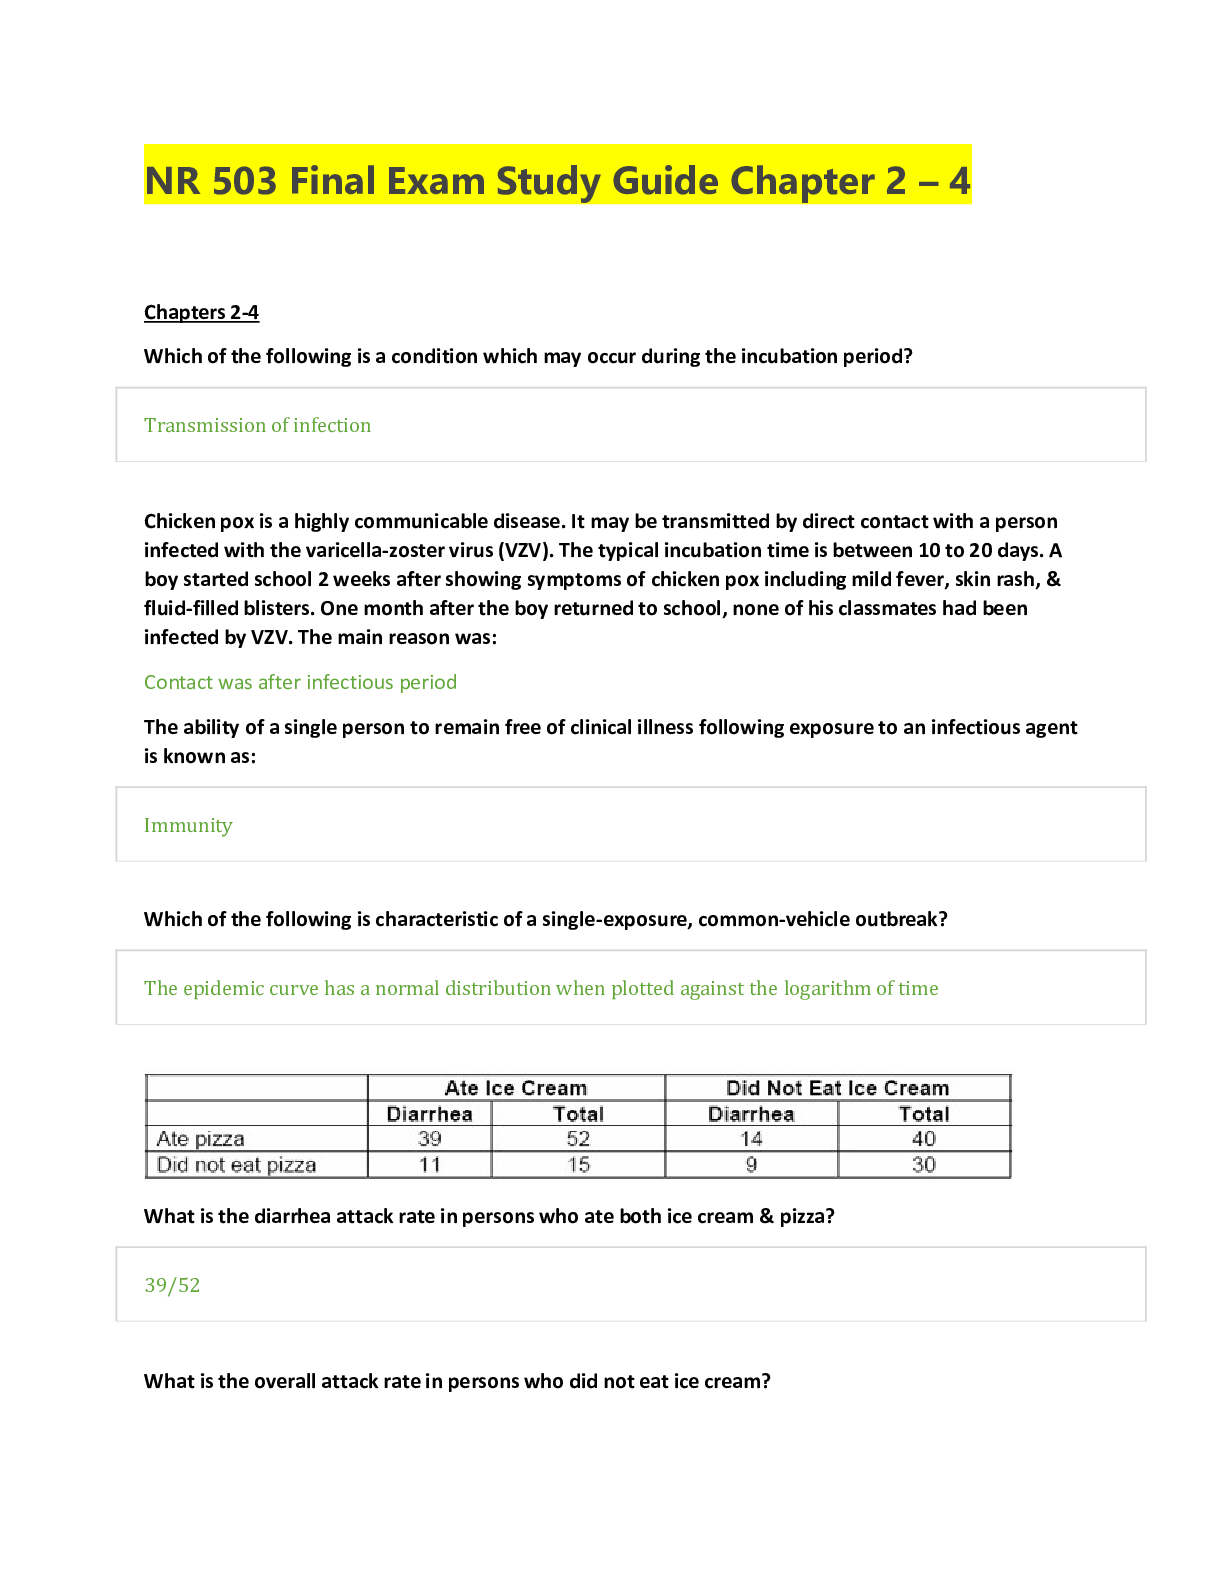
Question 1 The population of a city on February 15, 2005, was 36,600. The city has a passive surveillance system that collects hospital and private physician reports of influenza cases every month... . During the period between January 1 and April 1, 2005, 2,200 new cases of influenza occurred in the city. Of these cases, 775 persons were ill with influenza according to surveillance reports on April 1, 2005. The monthly incidence rate of active cases of influenza for the 3-month period was: 4 per 1,000 population 17 per 1,000 population 20 per 1,000 population 39 per 1,000 population 130 per 1,000 population Question 2 What would be the effect on age-specific incidence rates of uterine cancer if women with hysterectomies were excluded from the denominator of incidence calculations assuming that most women who have had hysterectomies are older than 50 years of age. The rates in all age groups would remain the same. Only rates in women older than 50 years of age would tend to decrease. Rates in women younger than 50 years would increase compared to women older than 50 years of age. Rates would increase in women older than 50 years of age but may decrease in younger women as they get older. It cannot be determined whether the rates would increase or decrease. Question 3 The ability of a single person to remain free of clinical illness following exposure to an infectious agent is known as: Hygiene Vaccination Herd immunity Immunity Latency Question 4 Which of the following reasons can explain why a person who did not consume the infective food item got sick? They were directly exposed to persons who did eat the infective food item Diarrhea is a general symptom consistent with a number of illnesses There may have been an inaccurate recall of which foods were eaten All of the above None of the above Question 5 Which of the food items (or combination of items) is most likely to be the infective item(s)? Pizza only Ice cream only Neither pizza nor ice cream Both pizza and ice cream Cannot be assumed from the data shown Question 6 The table below describes the number of illnesses and deaths caused by plague in four communities. The case-fatality rate associated with plague is lowest in which community? Community A Community B Community C Community D Question 7 The incidence and prevalence rates of a chronic childhood illness for a specific community are given below. Based on the data, which of the following interpretations best describes disease X? The duration of disease is becoming shorter. The duration of disease is becoming longer. The case-fatality rate of this disease is decreasing. Efforts to prevent new cases of this disease are becoming more successful. The risk of the disease has decreased over the past 20 years. Question 8 The following table gives the mean annual age-specific mortality rates from measles during the first 25 years of life in successive 5-year periods. You may assume that the population is in a steady state (i.e., migrations out are equal to migrations in). Based on the information above, one may conclude: Age-specific mortality rates for measles decreased for the period 1910–1914 to 1925–1929 Age-specific mortality rates for measles increased for the period 1910–1914 to 1925–1929 The case-fatality rate decreased for the period 1910–1914 to 1935–1939 Children born in 1910–1914 had the highest rate of death in all periods Children ages 5 to 9 had the highest rate of death in all periods Question 10 In 2001, a state enacted a law that required the use of safety seats for all children under 7 years of age and mandatory seatbelt use for all persons. The table below lists the number of deaths due to motor vehicle accidents (MVAs) and the total population by age in 2000 (before the law) and in 2005 (4 years after the law was enacted). Based on the information in the table, it was reported that there was an increased risk of death due to MVAs in the state after the law was passed. These conclusions are: Correct, because there were 1.8 times as many MVA deaths in 2005 as in 2000 Correct, because for each age group, the mortality rates were higher in 2005 than they were in 2000 Correct, because both the total and the age-adjusted mortality rates are higher in 2005 than in 2000 Incorrect, because the age-adjusted mortality rate due to MVA is actually lower in 2005 than in 2000 Incorrect, because the overall mortality rate is the same in both years Question 11 Which of the following is an advantage of active surveillance? Requires less project staff Is relatively inexpensive to employ More accurate due to reduced reporting burden for health care providers Relies on different disease definitions to account for all cases Reporting systems can be developed quickly [Show More]
Last updated: 2 years ago
Preview 1 out of 13 pages

Buy this document to get the full access instantly
Instant Download Access after purchase
Buy NowInstant download
We Accept:

Reviews( 0 )
$20.00
Can't find what you want? Try our AI powered Search
Document information
Connected school, study & course
About the document
Uploaded On
Jan 13, 2023
Number of pages
13
Written in
Additional information
This document has been written for:
Uploaded
Jan 13, 2023
Downloads
0
Views
68











.png)
.png)

