Mathematics > EXAM > MATH 225N| WEEK 8| LATEST FINAL EXAM Questions with Answers & Explanations (All)
MATH 225N| WEEK 8| LATEST FINAL EXAM Questions with Answers & Explanations
Document Content and Description Below
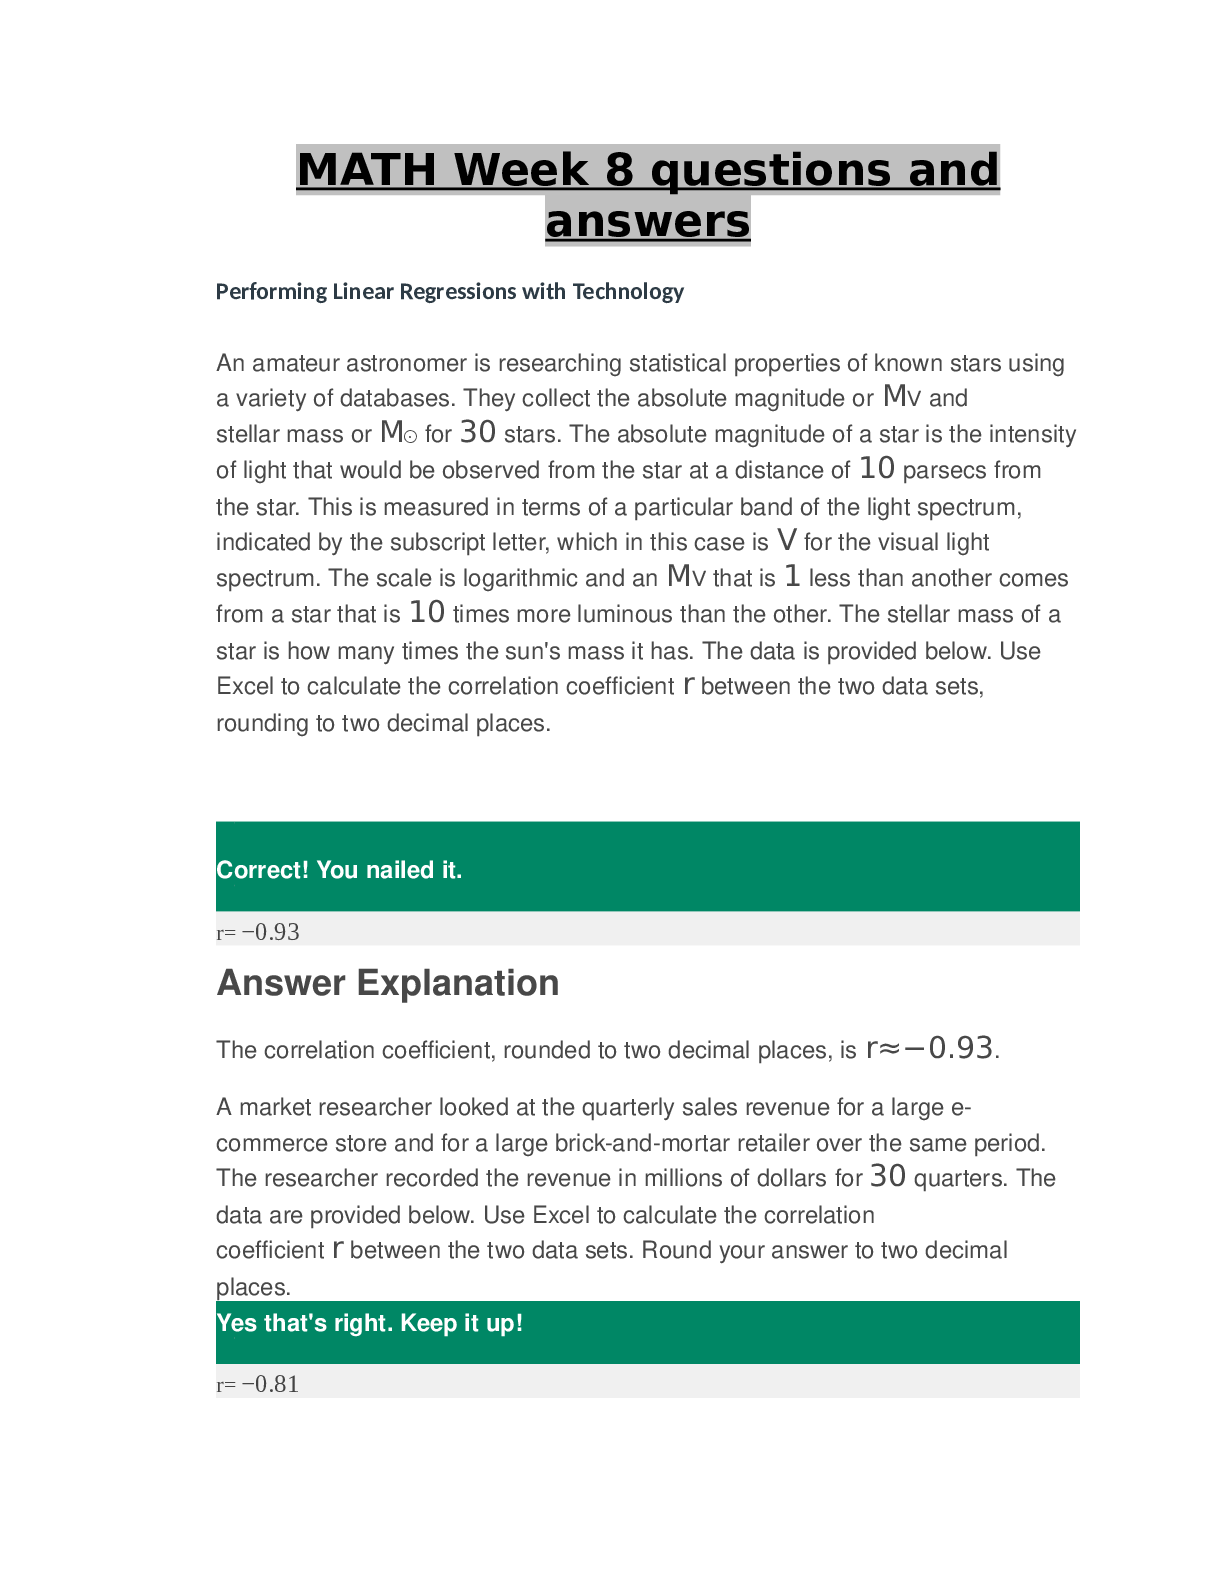
The slope of the line is −43.5, which tells us that the dependent variable (y) increases 43.5 for every one unit increase in the independent (x) variable, on average. The slope of the line is − ... 43.5, which tells us that the dependent variable (y) decreases 43.5 for every one unit increase in the independent (x) variable, on average. Answer Explanation Correct answer: The slope of the line is 2.87, which tells us that the dependent variable (y) increases 2.87 for every one unit increase in the independent (x) variable, on average. Question Researchers want to find the relationship between age and average weight in female children. Using a calculator or statistical software, find the linear regression line for the 2012 CDC data below for average [Show More]
Last updated: 2 years ago
Preview 1 out of 58 pages
Buy this document to get the full access instantly
Instant Download Access after purchase
Buy NowInstant download
We Accept:

Reviews( 0 )
$19.50
Can't find what you want? Try our AI powered Search
Document information
Connected school, study & course
About the document
Uploaded On
Jan 29, 2023
Number of pages
58
Written in
All
Additional information
This document has been written for:
Uploaded
Jan 29, 2023
Downloads
0
Views
146

