Statistics > STUDY GUIDE > STAT200 - Assignment 1: Descriptive Statistics Data Analysis Plan (All)
STAT200 - Assignment 1: Descriptive Statistics Data Analysis Plan
Document Content and Description Below
Last updated: 3 years ago
Preview 1 out of 4 pages
Instant download

Buy this Document to get the Full Access Instantly
Provided by Students Who Aced it
We Verify Document Content to Gurantee Accuracy
Reviews( 0 )
Document information
Connected school, study & course
About the document
Uploaded On
Feb 03, 2021
Number of pages
4
Written in
All

Additional information
This document has been written for:
Uploaded
Feb 03, 2021
Downloads
0
Views
98
Document Keyword Tags
Recommended For You
Get more on STUDY GUIDE »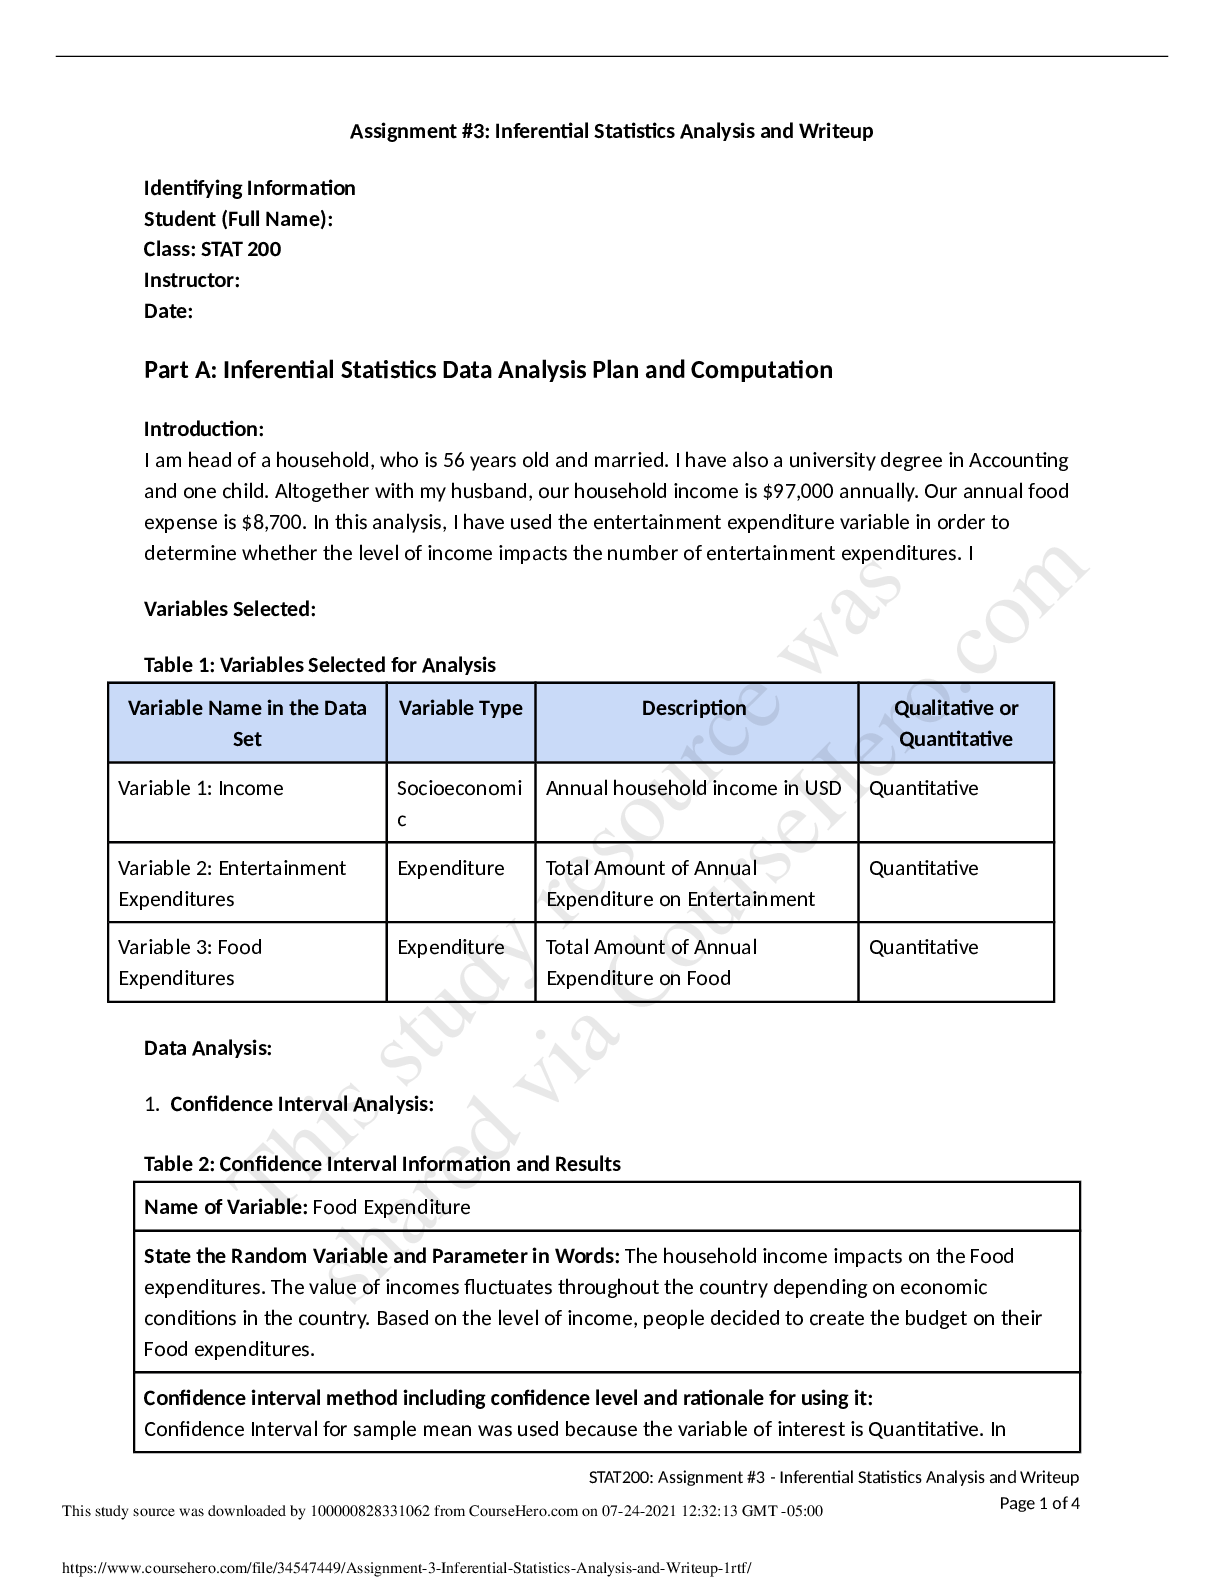
STAT 200 Assignment #3_ Inferential Statistics Analysis and Wr...


Quiz Submissions - Week 1: Quiz 1 - STAT 200 6372 Introduction...

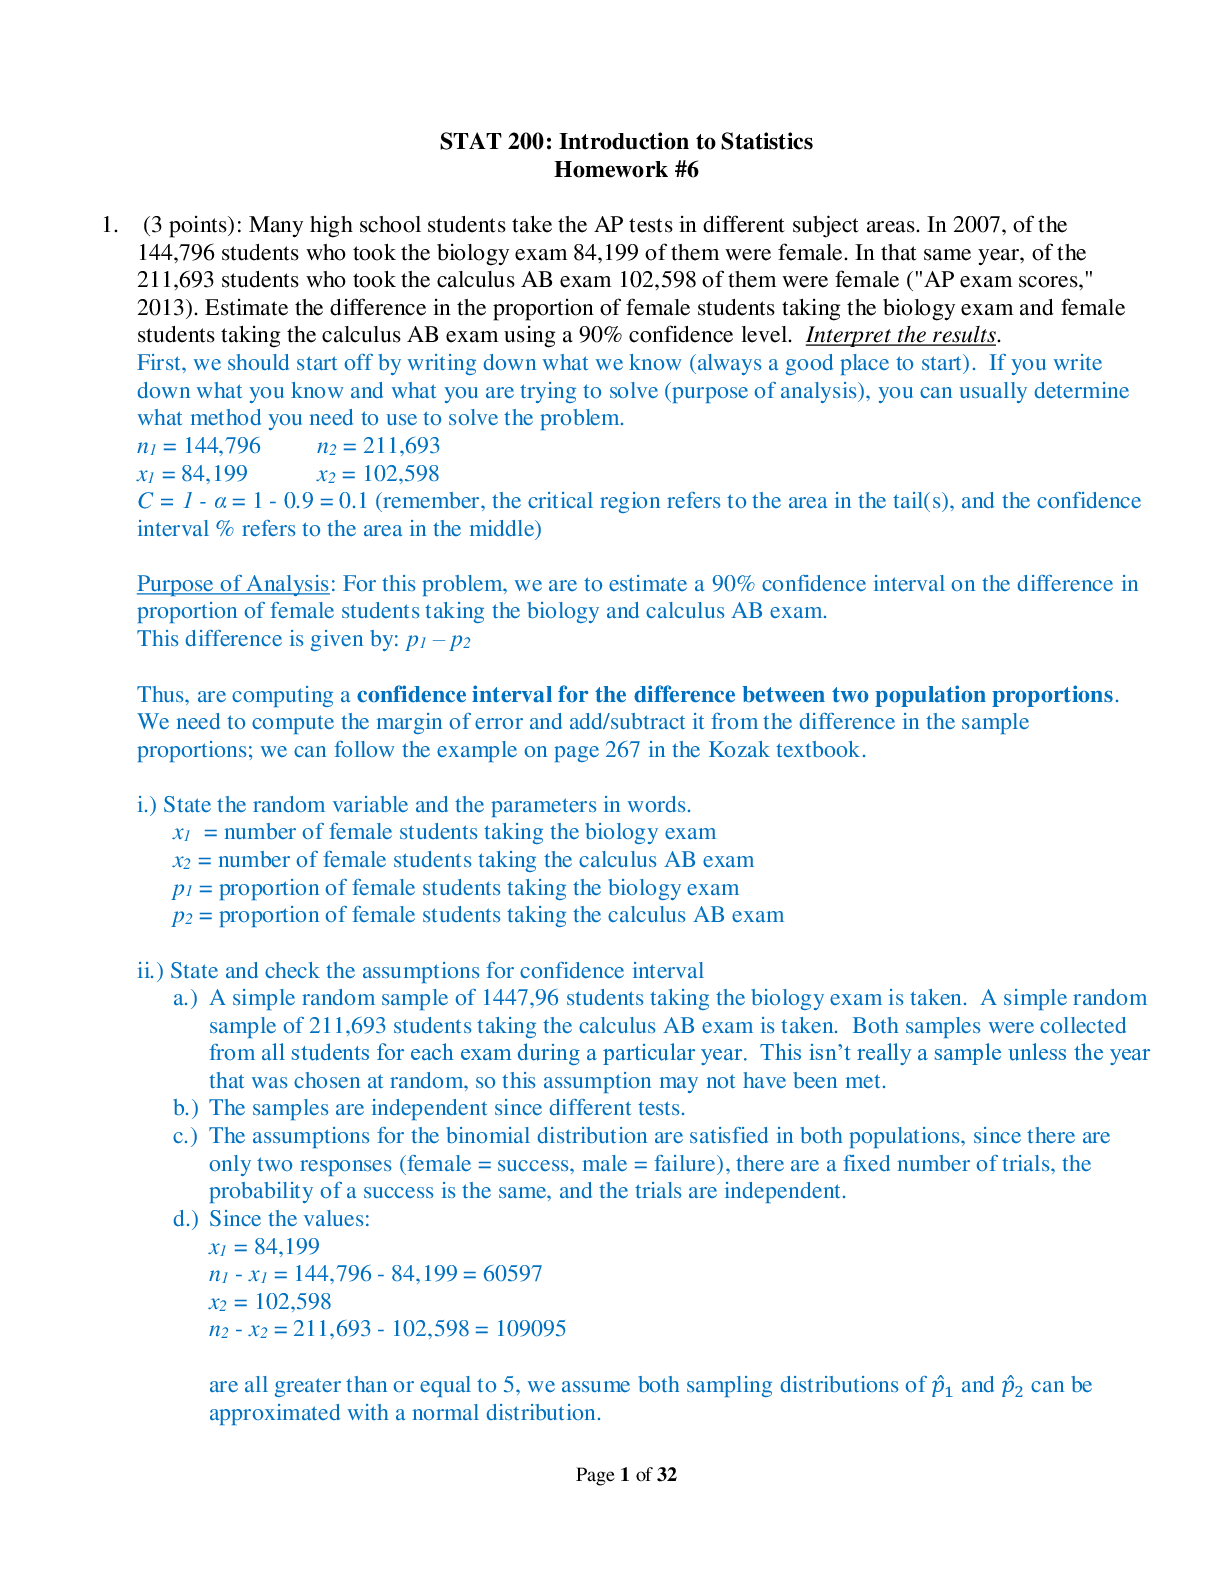
STAT 200 Week 6 Homework Problems, full solution guide, 100% c...
STAT 200 6372 Introduction to Statistics (2202) / STAT 200 wee...
STAT 200 6372 Introduction to Statistics (2202) / STAT 200 wee...
 UMGC Learning Management System.png)
Quiz Submissions - Week 1: Quiz 1 - STAT 200 6372 Introduction...
STAT 200 6372 Introduction to Statistics (2202) / STAT 200 wee...

STAT 200 FINAL EXAM 1 ; Latest Complete Solutions with shown w...

STAT 200 Sophia learning Introduction to Statistics Unit 3 Mil...

University of Maryland - STAT 200; Week 7 Homework Problems, A...

Data Analysis and Statistics for Geography, Environmental Scie...
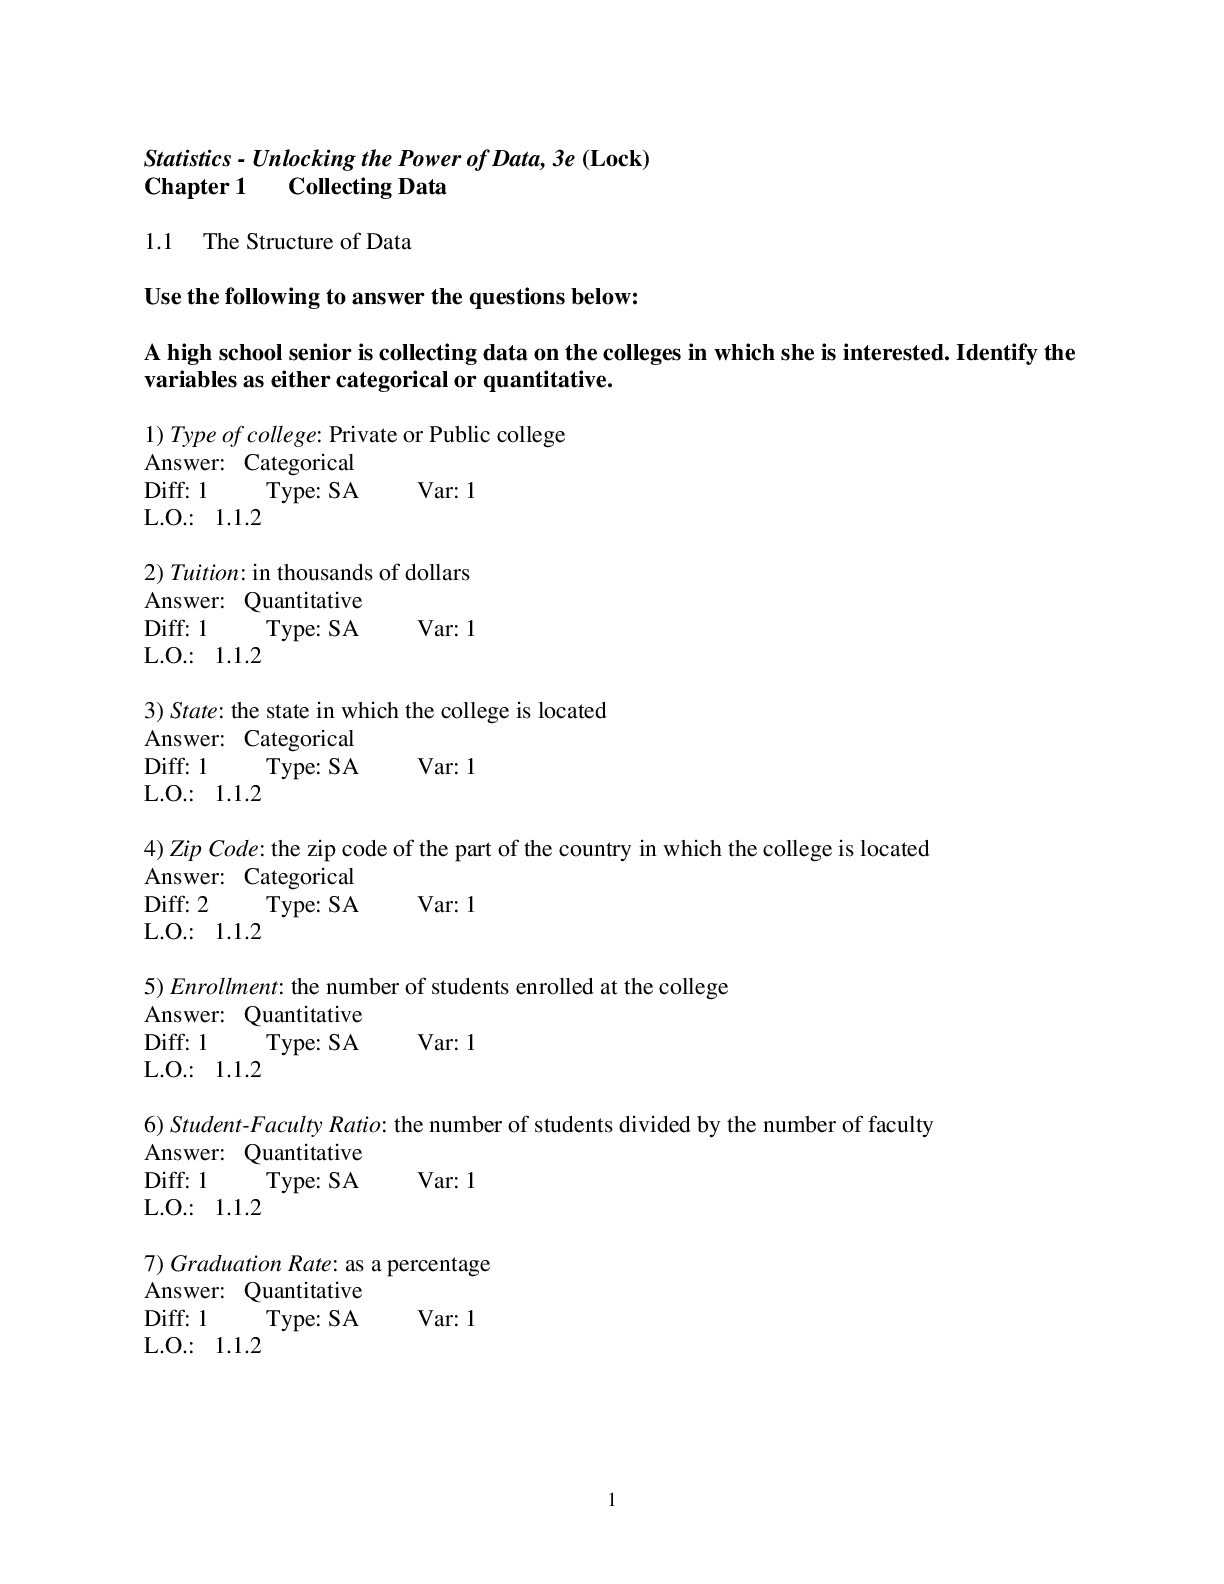
Statistics Unlocking the Power of Data, 3e Robin Lock, Patti F...