Business Analytics > Presentation > Web Analytics: Presentation. All Content on TRACKING INTERACTION AND MEASURING (81 Pages) (All)
Web Analytics: Presentation. All Content on TRACKING INTERACTION AND MEASURING (81 Pages)
Document Content and Description Below
Last updated: 3 years ago
Preview 1 out of 81 pages
Instant download

Buy this Document to get the Full Access Instantly
Provided by Students Who Aced it
We Verify Document Content to Gurantee Accuracy
Reviews( 0 )
Document information
Connected school, study & course
About the document
Uploaded On
Mar 10, 2020
Number of pages
81
Written in
All

Additional information
This document has been written for:
Uploaded
Mar 10, 2020
Downloads
0
Views
177
Document Keyword Tags
Recommended For You
Get more on Presentation »
Web Analytics Presentation: Measuring Social Media, Facebook a...

Solutions Manual for Business Analytics 3rd Edition By James E...
.png)
.png)

TEST BANK for BUSINESS RESEARCH METHODS 5th Edition by Emma Be...

Solution Manual for Introduction to Business Analytics, 1st Ed...
Solution Manual for Introduction to Business Analytics, 1st Ed...
Test Bank for Business Analytics, 3rd Edition by James Evans (...

Solution Manual for Introduction to Business Analytics, 1st E...
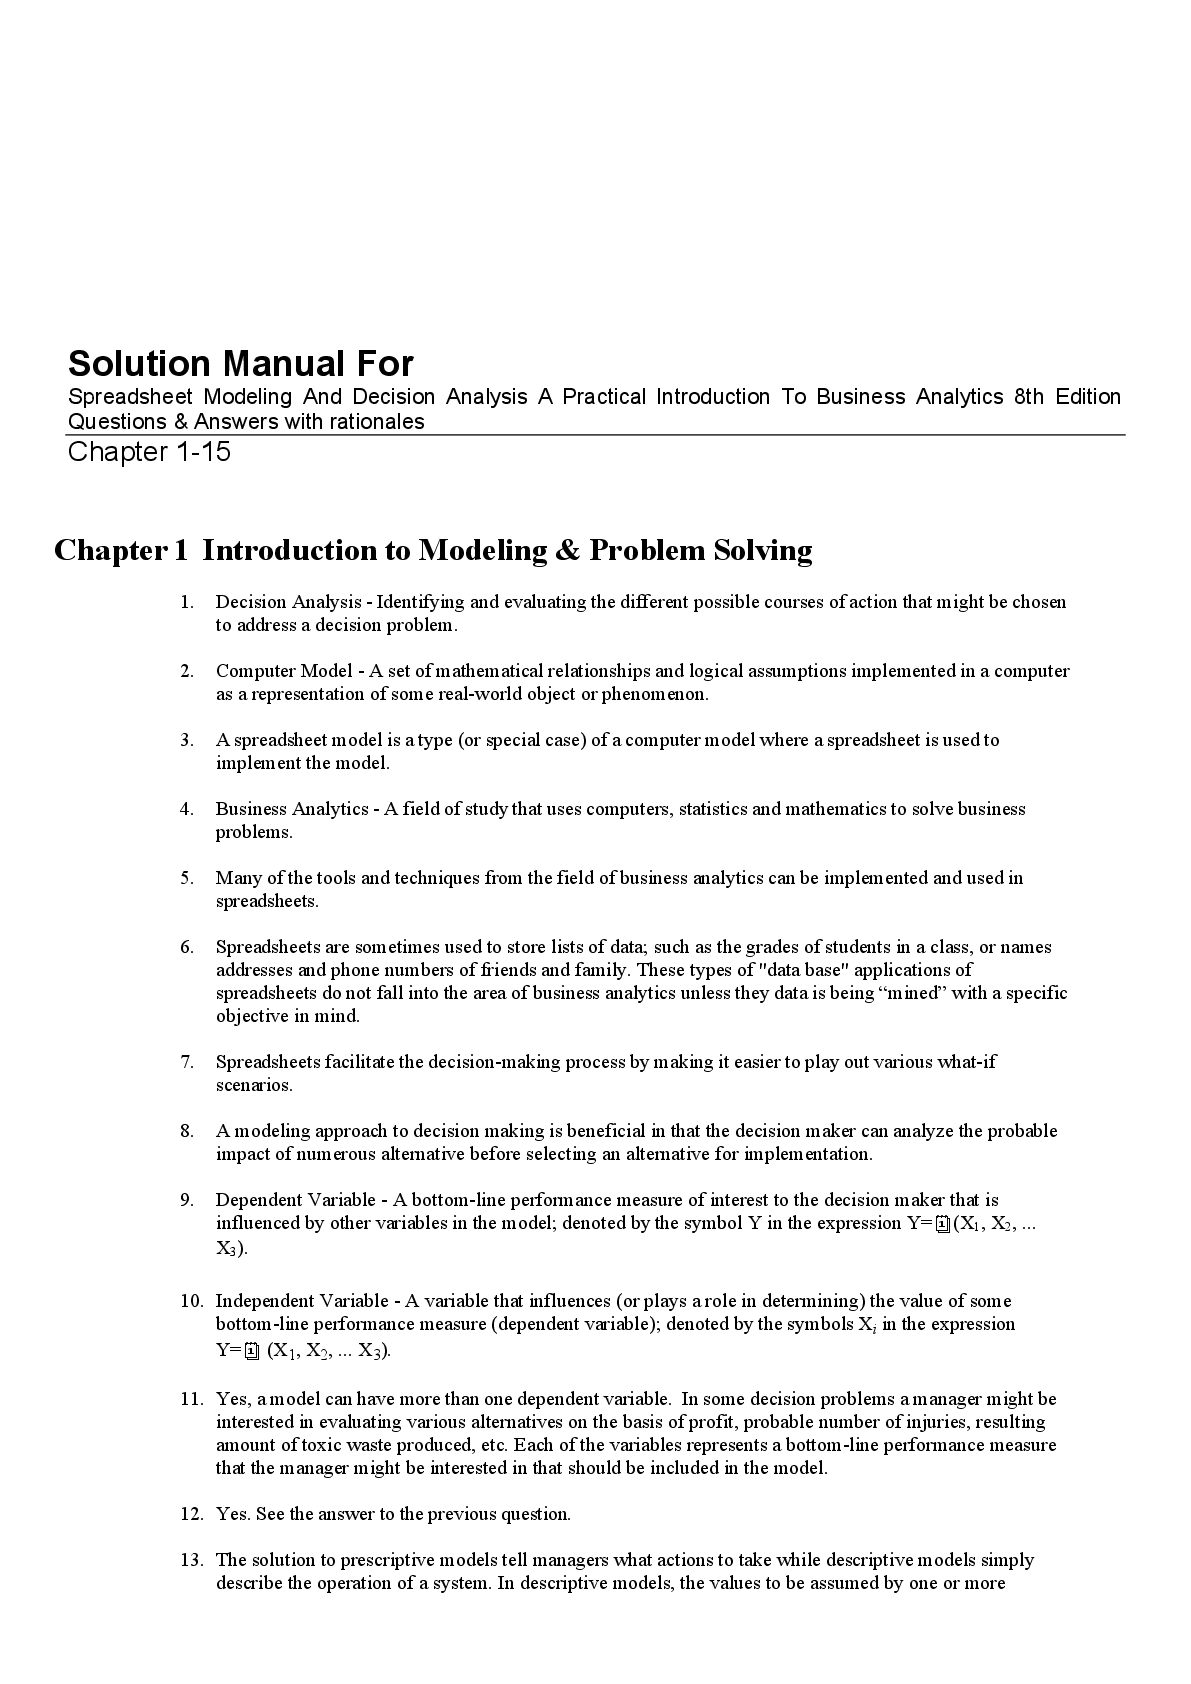
“Solution Manual for Spreadsheet Modeling and Decision Analysi...

Civil Litigation Process and Procedures, 4th edition By Thomas...
.png)
Management Information Systems; Achieving Operational Excellen...

ISYE 6501 Midterm 2: Intro Analytics Modeling - ISYE-6501-OAN/...

Business Administration and Accountancy Integrated CPA Review...
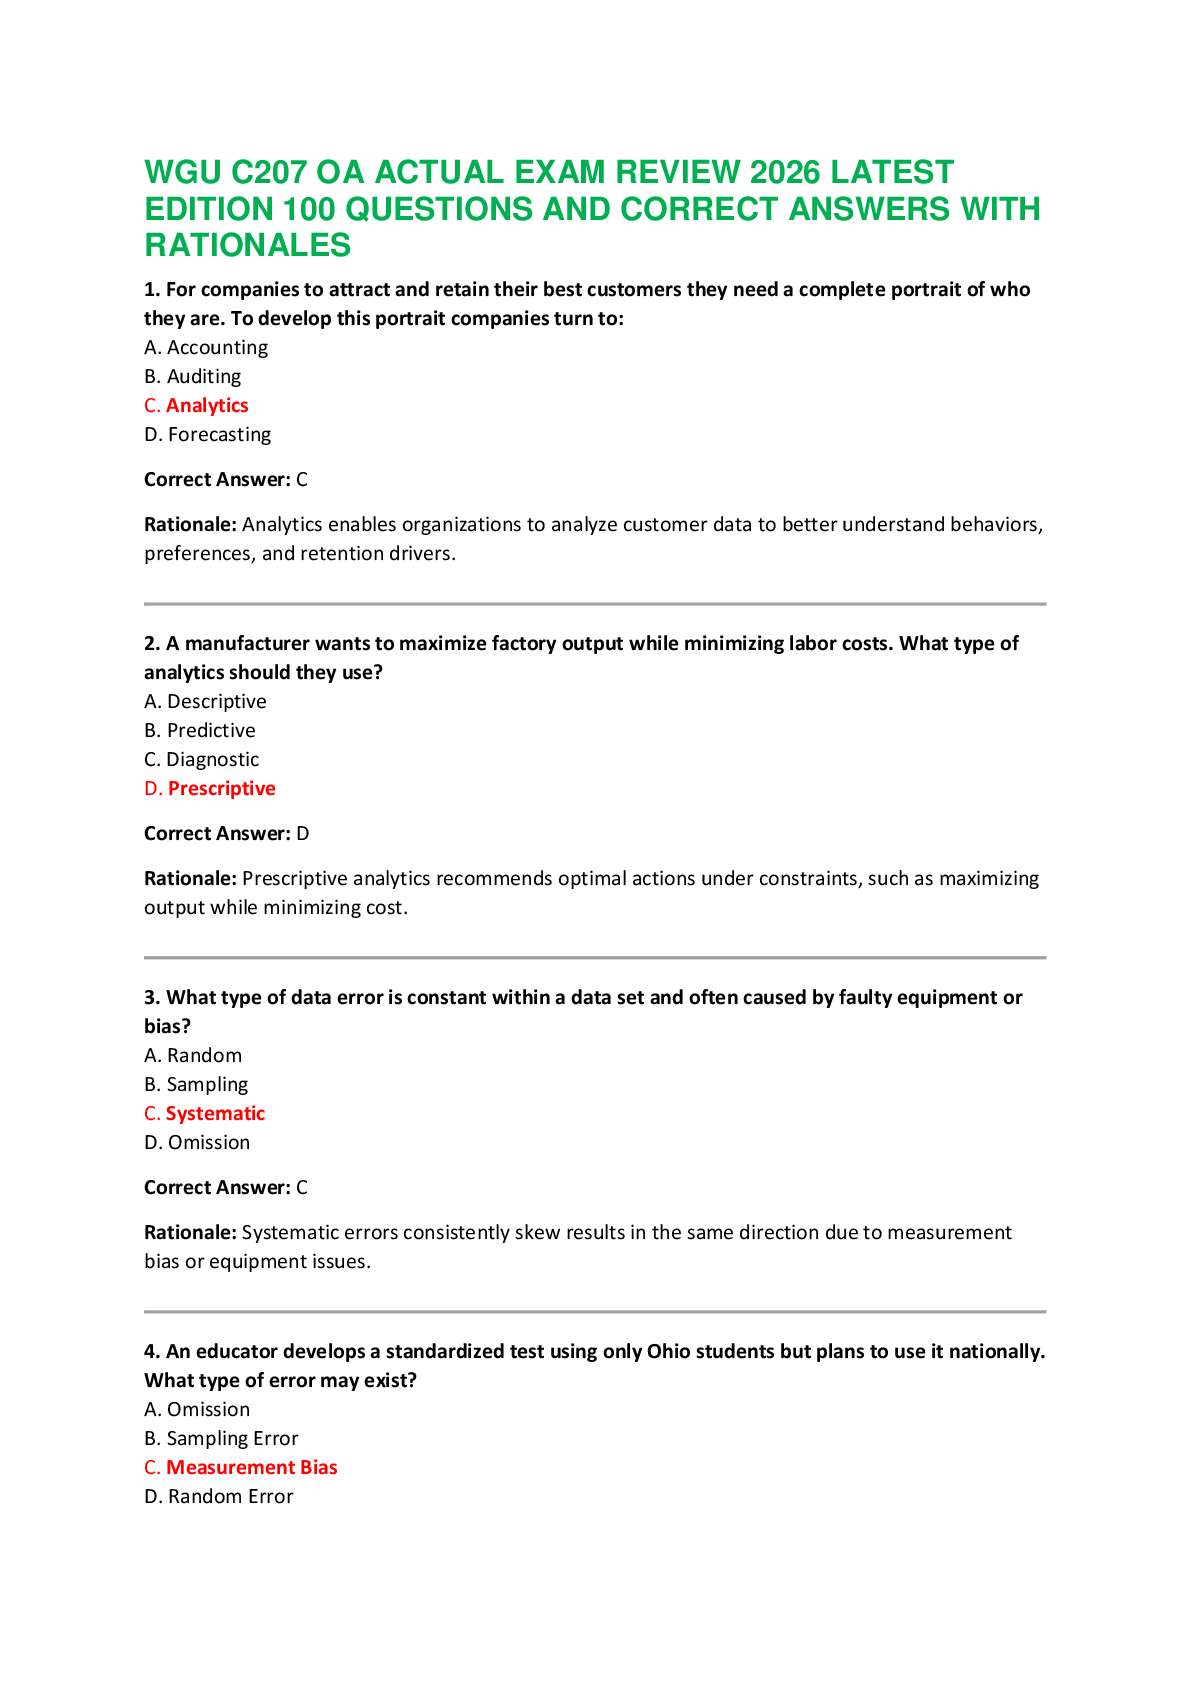
WGU C207 OA ACTUAL EXAM REVIEW 2026 LATEST EDITION 100 QUESTIO...