SCIENCE 101 > QUESTIONS & ANSWERS > SCIENCE 101 Quadrat Sampling Lab (All)
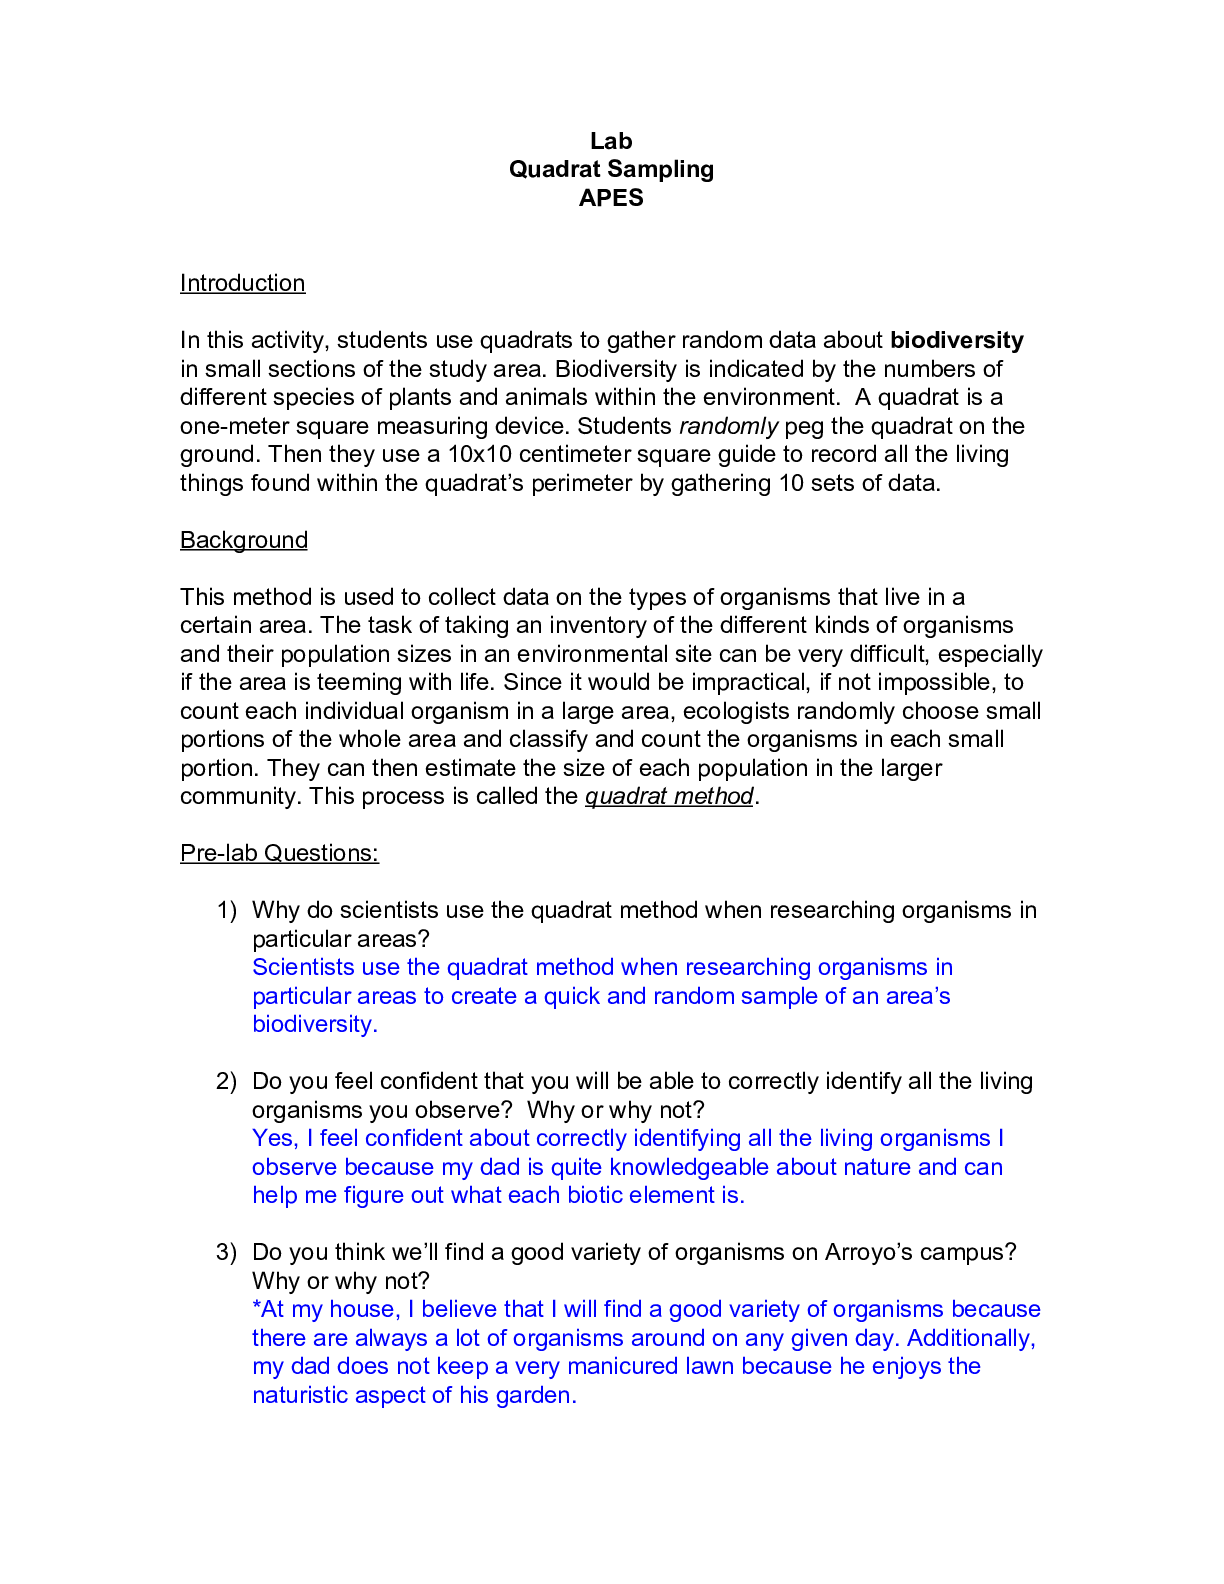
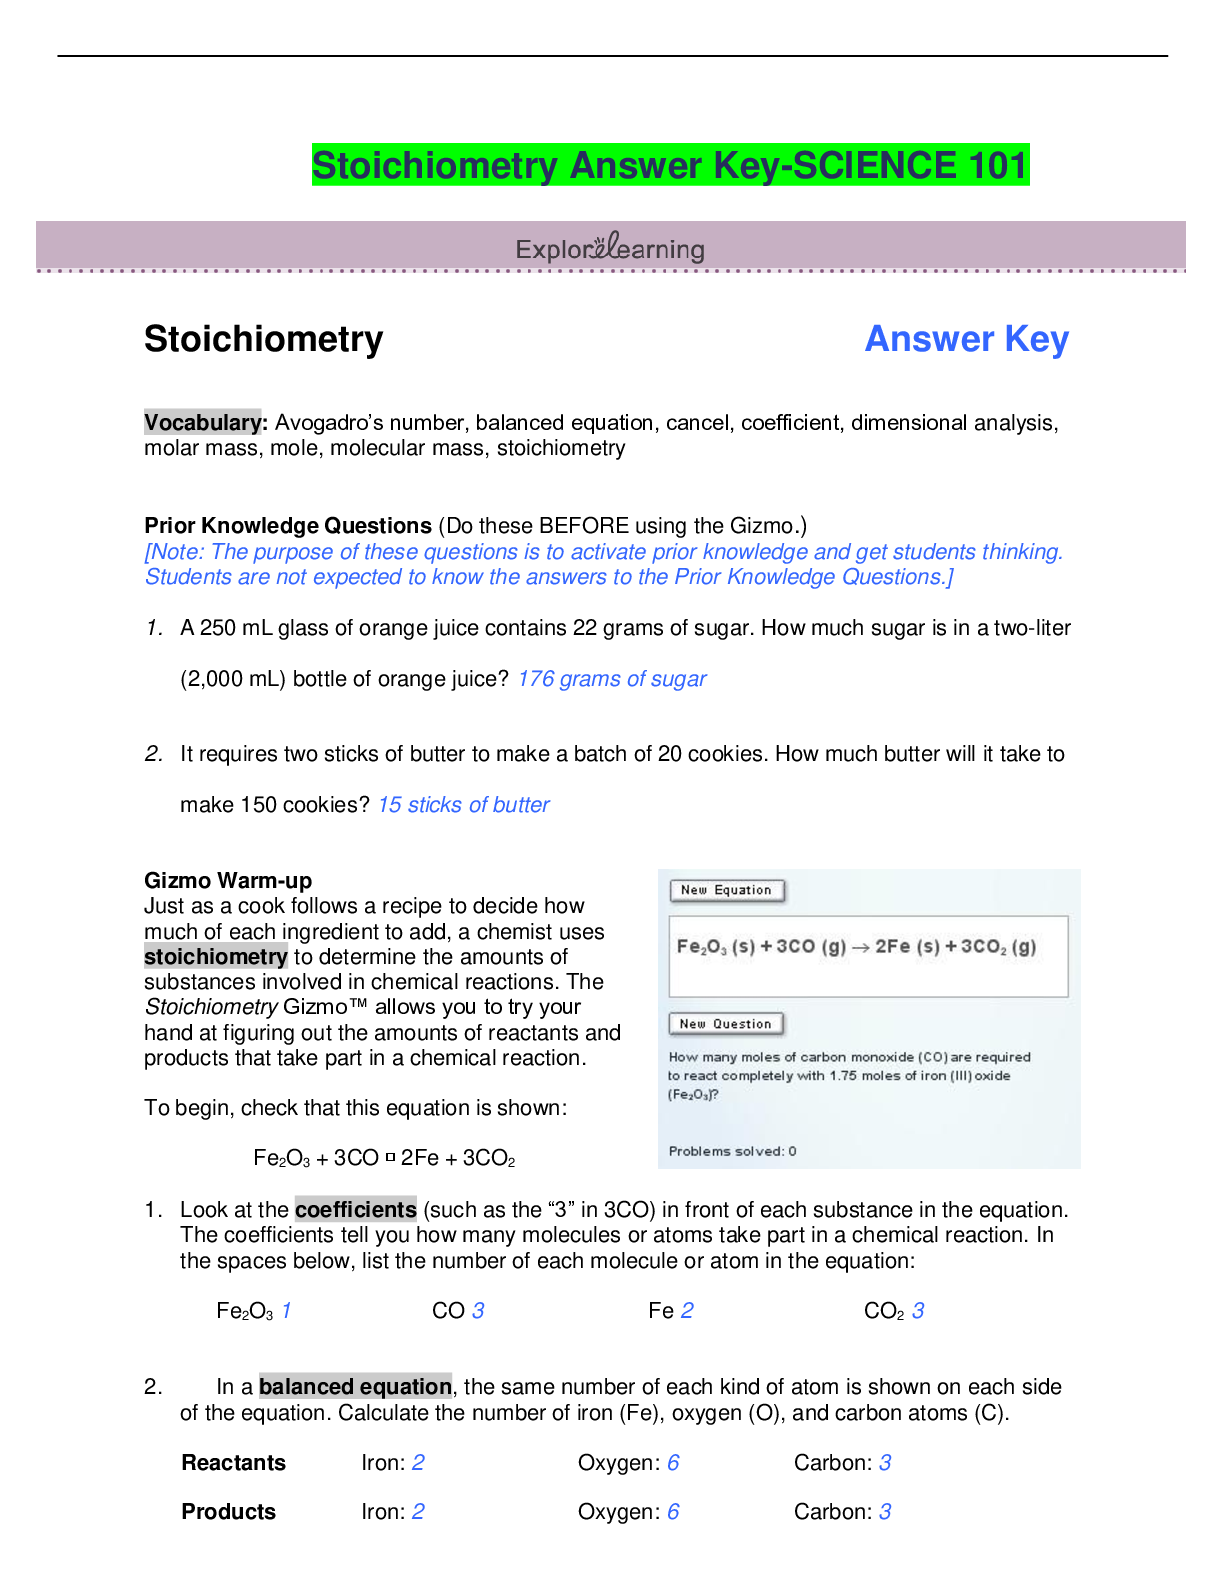
SCIENCE 101 Quadrat Sampling Lab
Document Content and Description Below
Last updated: 3 years ago
Preview 1 out of 7 pages
Instant download
Buy this Document to get the Full Access Instantly
Provided by Students Who Aced it
We Verify Document Content to Gurantee Accuracy
Reviews( 0 )
Document information
Connected school, study & course
About the document
Uploaded On
Feb 10, 2021
Number of pages
7
Written in
All

Additional information
This document has been written for:
Uploaded
Feb 10, 2021
Downloads
0
Views
97
Document Keyword Tags
Recommended For You
Get more on QUESTIONS & ANSWERS »
Science 101. 2.3.5 Practice: Equilibrium and Kinetics Practice...
.png)
NATIONAL CENTER FOR CASE STUDY TEACHING IN SCIENCE A Trip to t...

Kennesaw Mountain High SchoolSCIENCE 101Graphing Practice
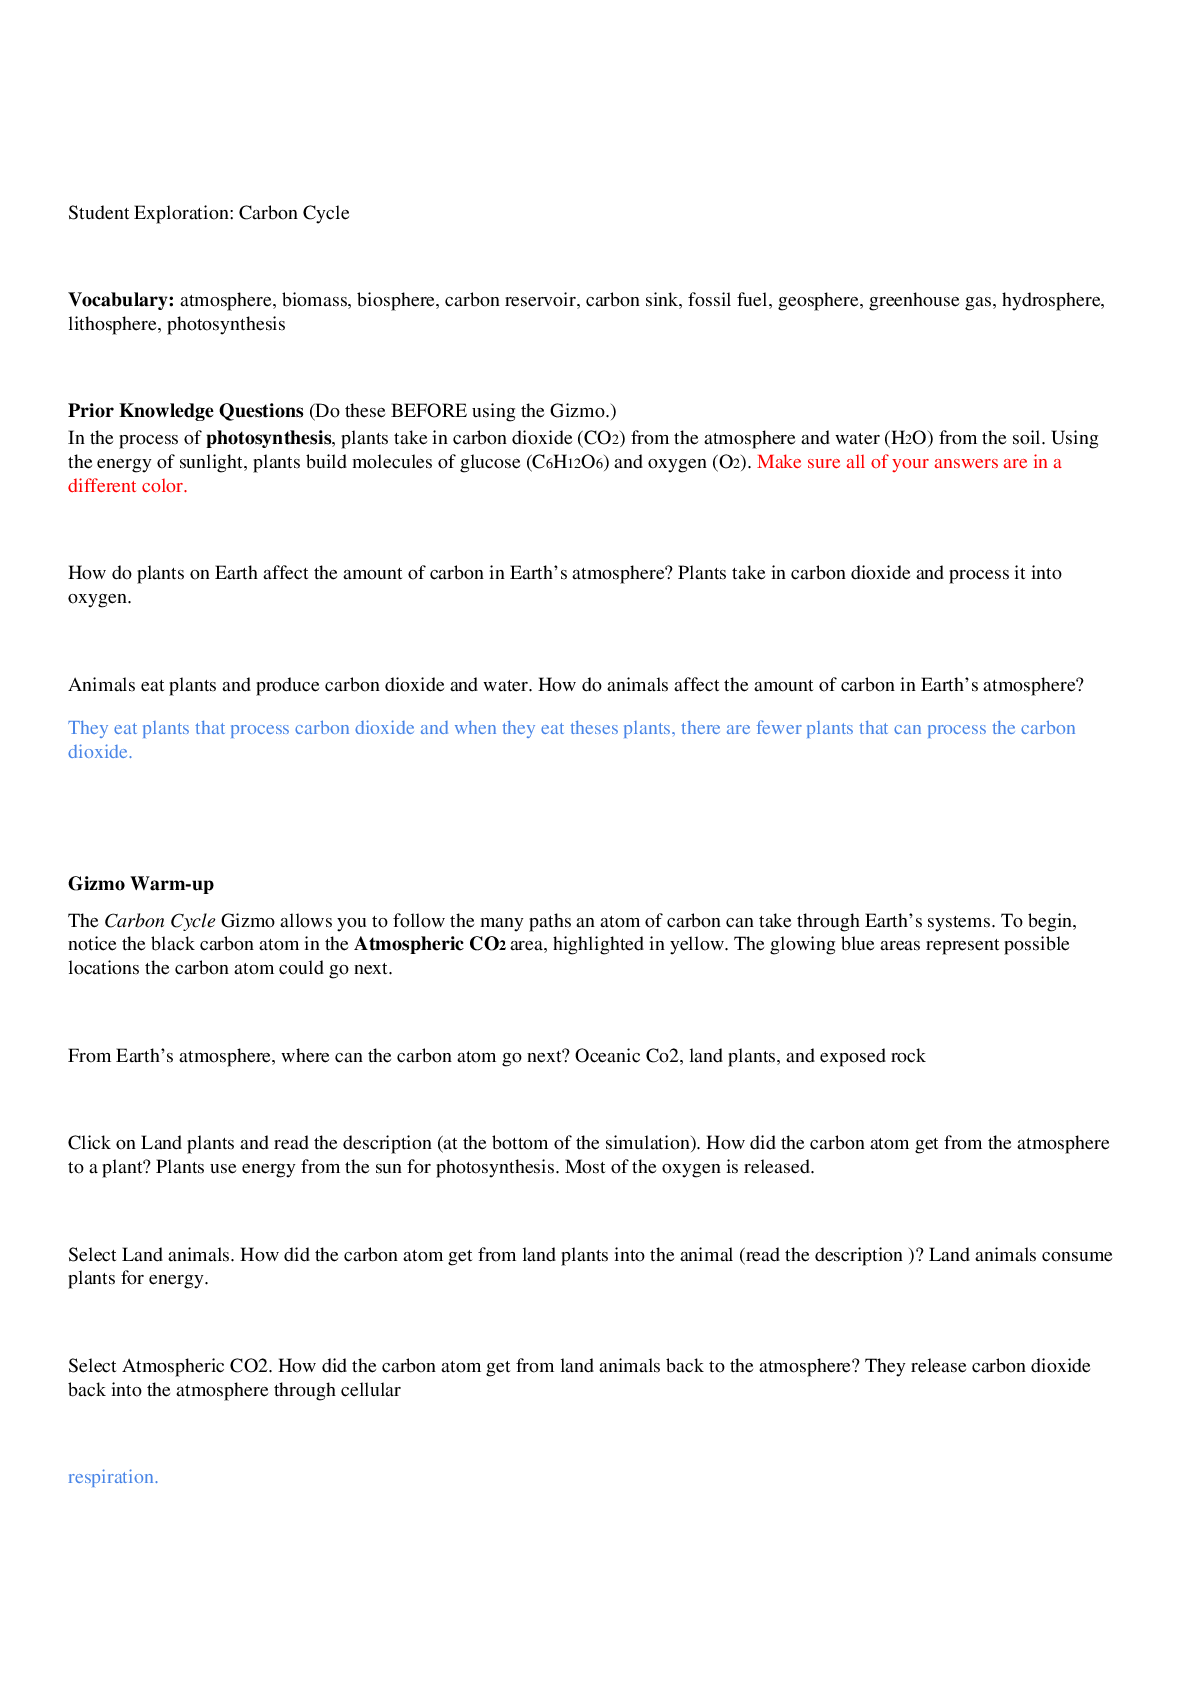
Questions and Answers > SCIENCE 101Stephani DeBise - Carbon Cy...
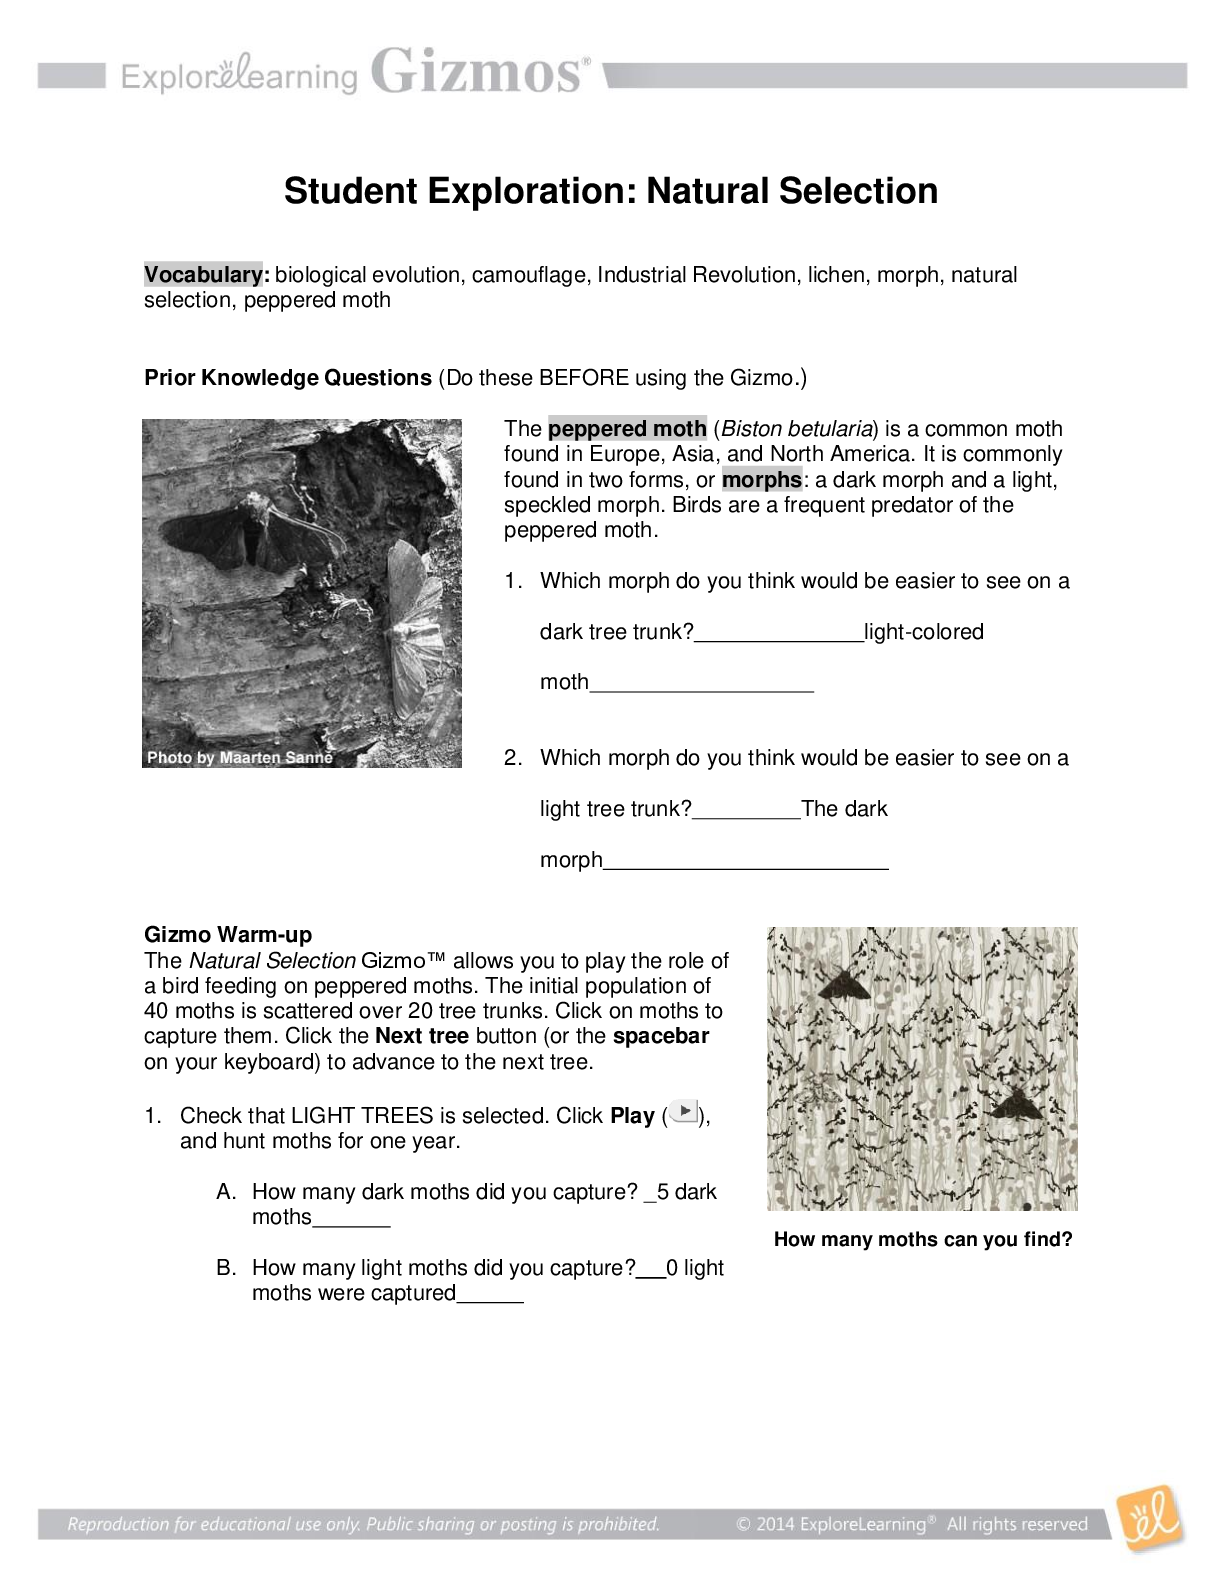
SCIENCE 101: natural selection gizmo (QUESTIONS AND CORRECT AN...
SCIENCE 101: Stephani DeBise - Carbon Cycling GIZMO (QUESTION...
 Graded A.png)
SCIENCE 101_ CARBON CYCLE GIZMO (Complete Questions and Full A...


SCIENCE 101806DNAProfilingSE COMPLETED.Student Exploration: DN...

SCIENCE 101_ CARBON CYCLE GIZMO (Complete and Full Answers to...
Test Bank for The Cell A Molecular Approach 8th Edition By Geo...

Test Bank for Neuroscience 6th Edition Dale Purves, George Aug...
Exploring Psychology, 12th Edition by David Myers, Nathan DeWa...

Test Bank (Downloadable Product) for The Sciences: An Integrat...