Mathematics > A-Level Question Paper > C957 Unit 3 Module 3 Questions and Answers Latest 2023 (All)
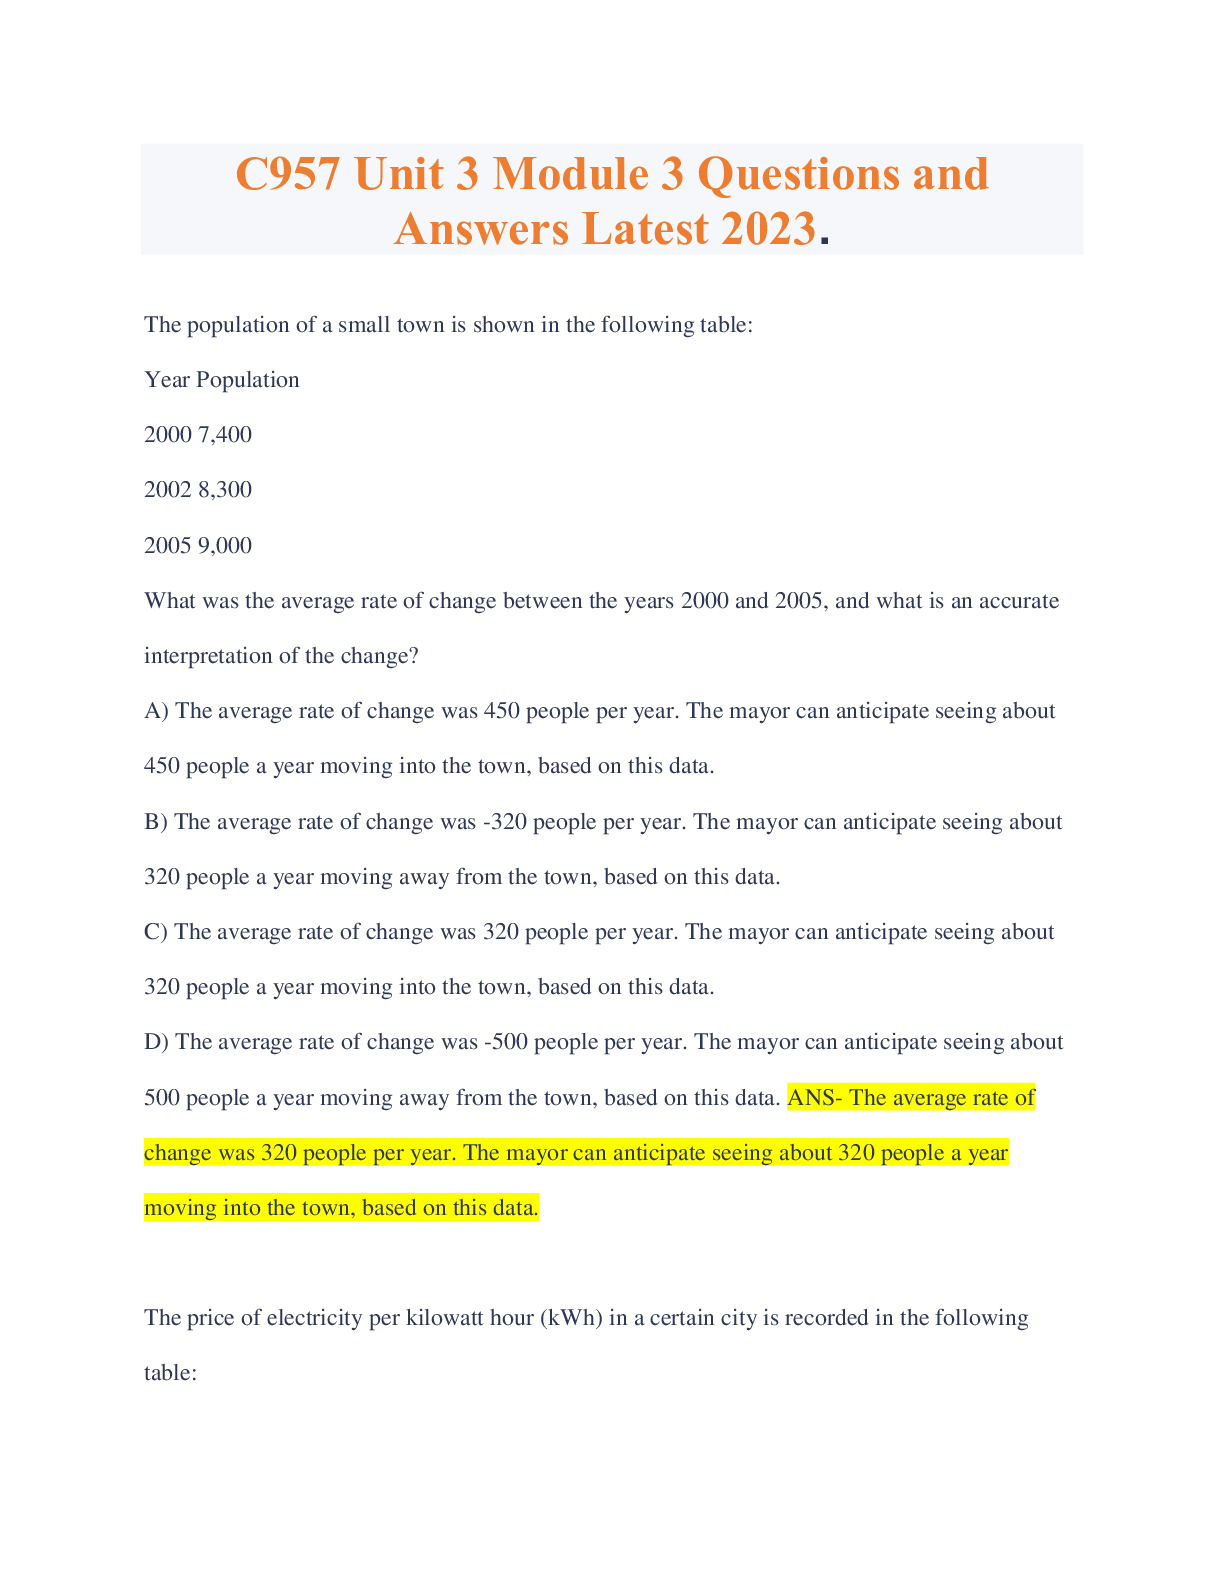
C957 Unit 3 Module 3 Questions and Answers Latest 2023
Document Content and Description Below
The population of a small town is shown in the following table: Year Population 2000 7,400 2002 8,300 2005 9,000 What was the average rate of change between the years 2000 and 2005, and what is a... n accurate interpretation of the change? A) The average rate of change was 450 people per year. The mayor can anticipate seeing about 450 people a year moving into the town, based on this data. B) The average rate of change was -320 people per year. The mayor can anticipate seeing about 320 people a year moving away from the town, based on this data. C) The average rate of change was 320 people per year. The mayor can anticipate seeing about 320 people a year moving into the town, based on this data. D) The average rate of change was -500 people per year. The mayor can anticipate seeing about 500 people a year moving away from the town, based on this data. ANS- The average rate of change was 320 people per year. The mayor can anticipate seeing about 320 people a year moving into the town, based on this data. [Show More]
Last updated: 1 year ago
Preview 1 out of 10 pages
Buy this document to get the full access instantly
Instant Download Access after purchase
Buy NowInstant download
We Accept:

Reviews( 0 )
$10.00
Can't find what you want? Try our AI powered Search
Document information
Connected school, study & course
About the document
Uploaded On
Jul 18, 2023
Number of pages
10
Written in

Additional information
This document has been written for:
Uploaded
Jul 18, 2023
Downloads
0
Views
170