Mathematics > QUESTIONS & ANSWERS > C957 Unit 3 Module 3 Questions and Answers Latest 2023 (All)
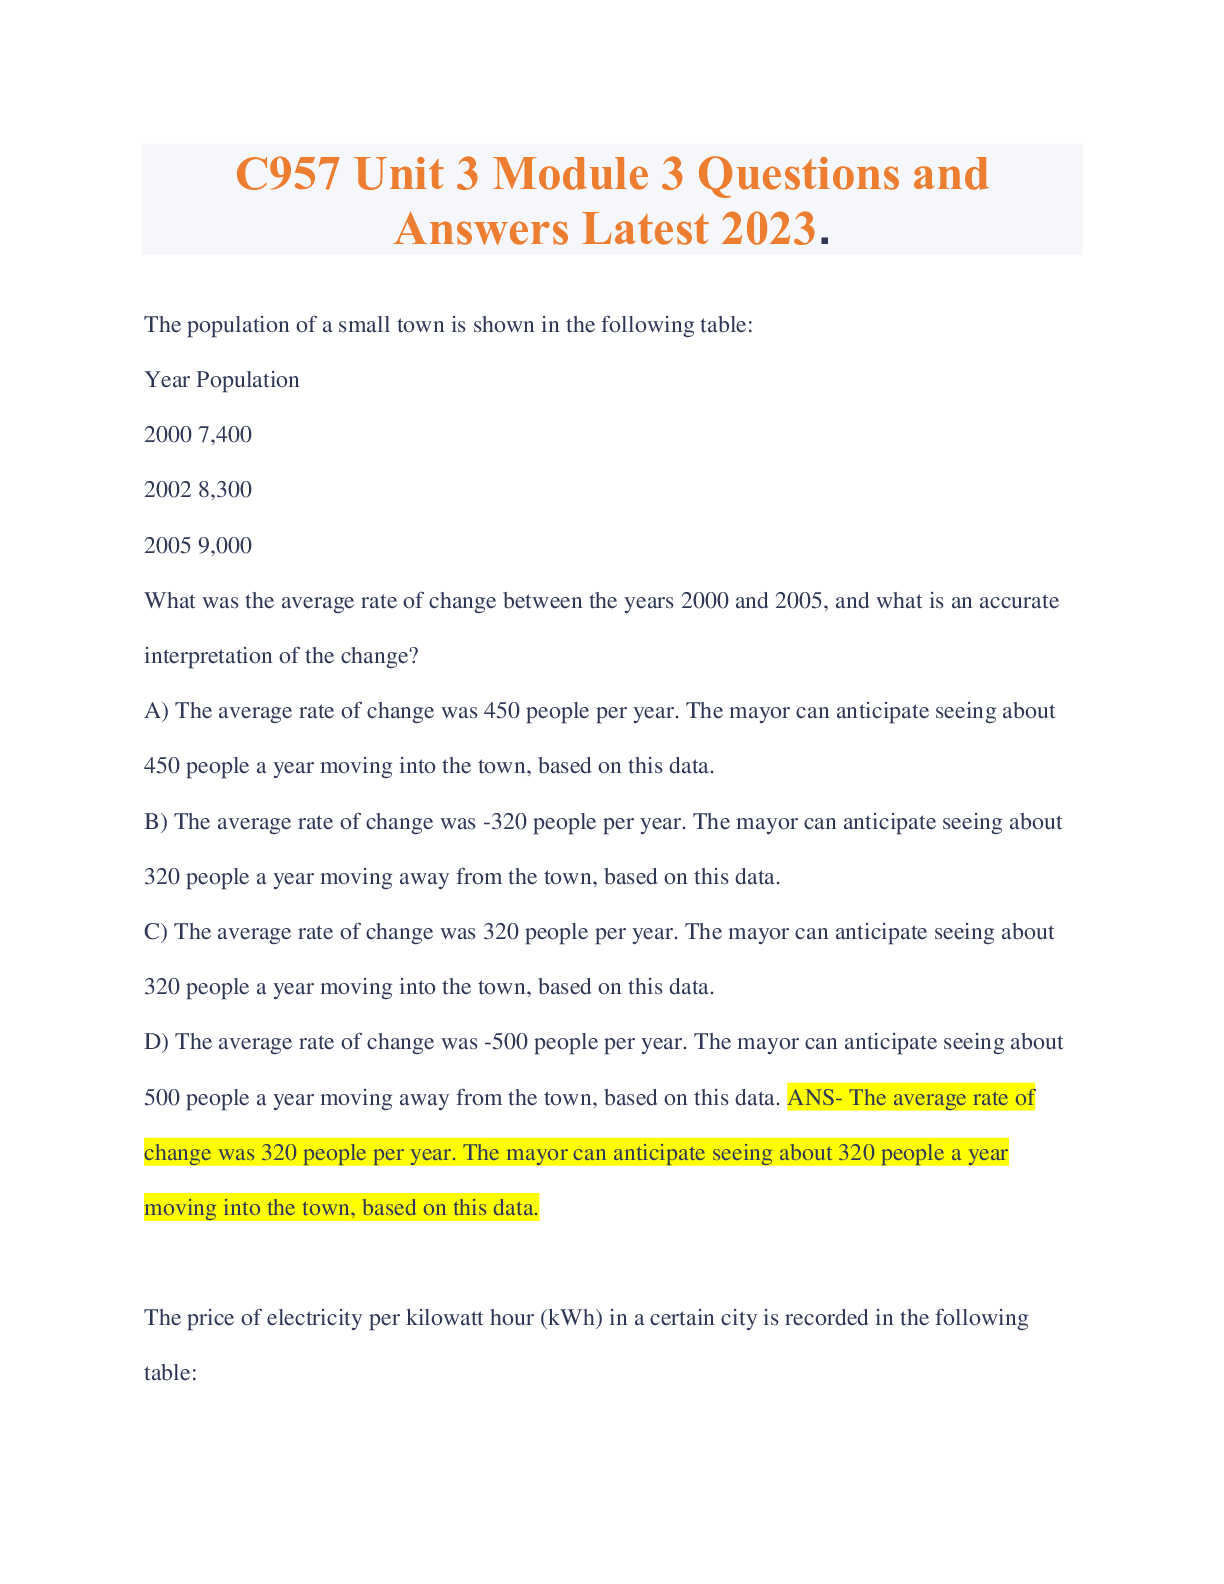
C957 Unit 3 Module 3 Questions and Answers Latest 2023
Document Content and Description Below
Last updated: 2 years ago
Preview 1 out of 10 pages
Instant download
Buy this Document to get the Full Access Instantly
Provided by Students Who Aced it
We Verify Document Content to Gurantee Accuracy
Reviews( 0 )
Document information
Connected school, study & course
About the document
Uploaded On
Jul 25, 2023
Number of pages
10
Written in
All

Additional information
This document has been written for:
Uploaded
Jul 25, 2023
Downloads
0
Views
250
Document Keyword Tags
Recommended For You
Get more on QUESTIONS & ANSWERS »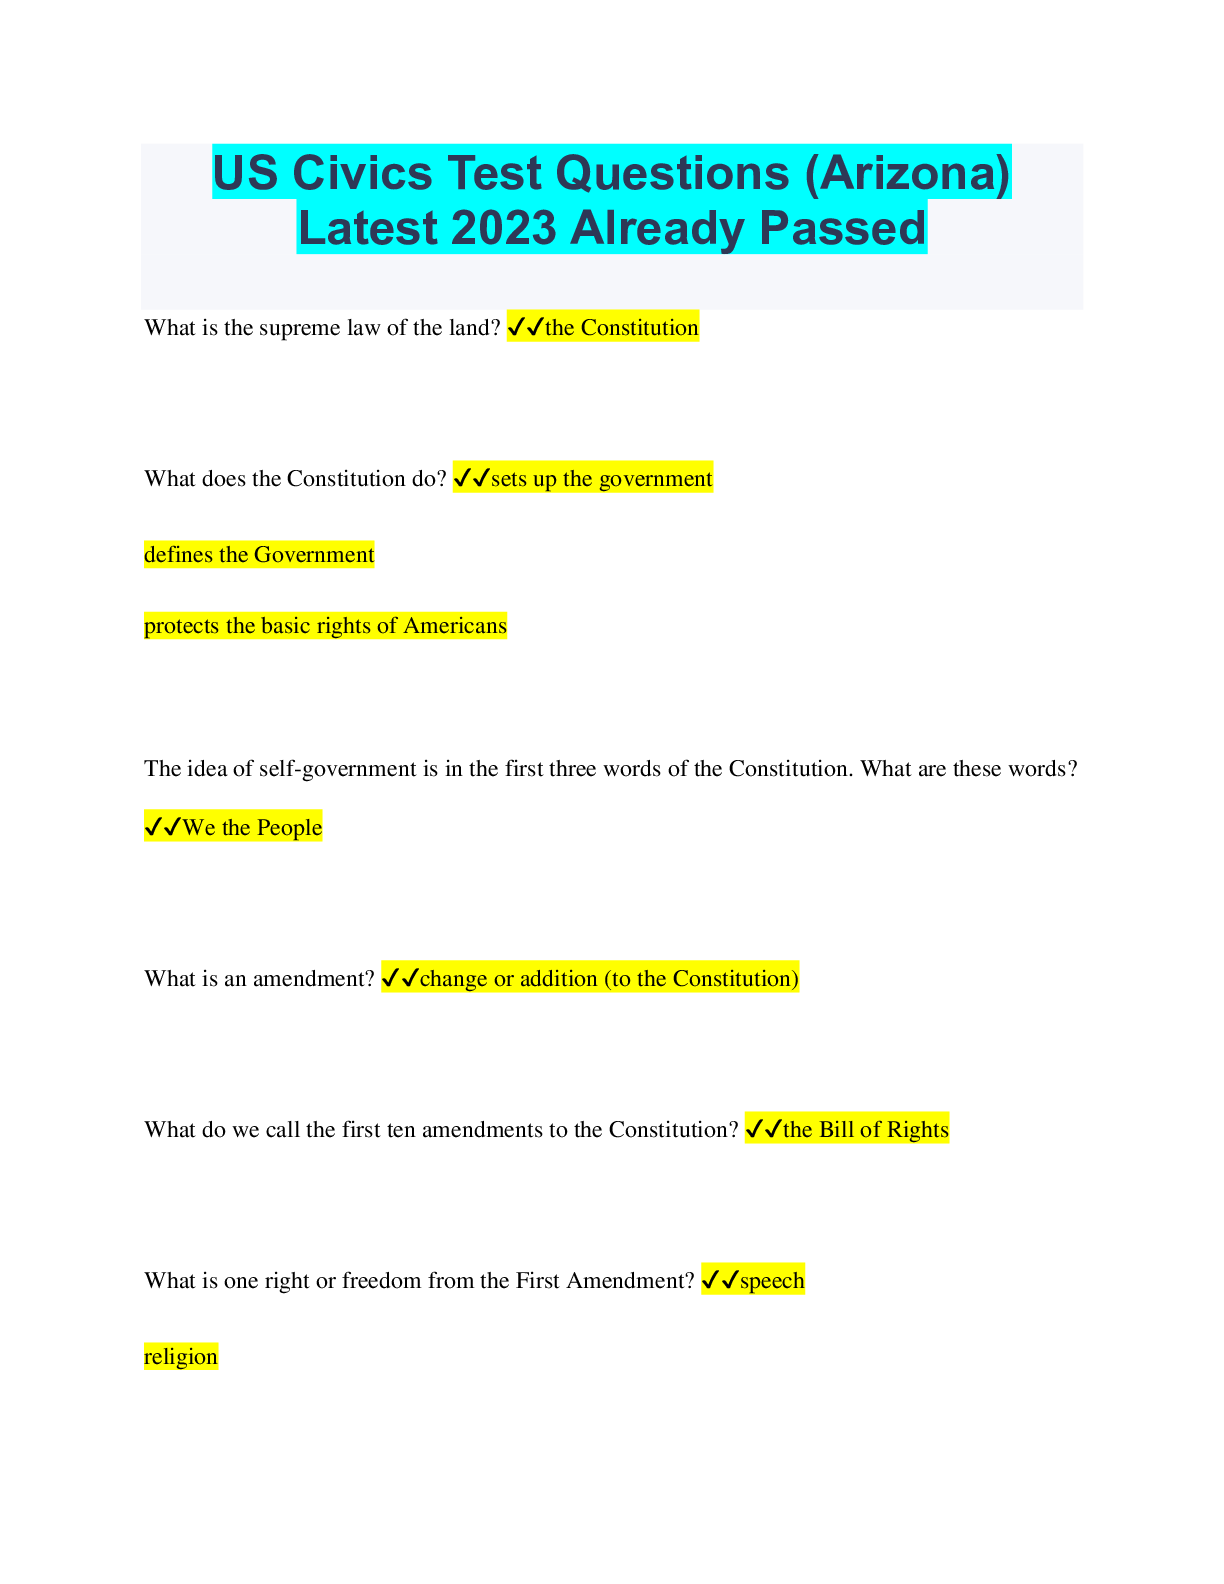
US Civics Test Questions (Arizona) Latest 2023 Already Passed
.png)
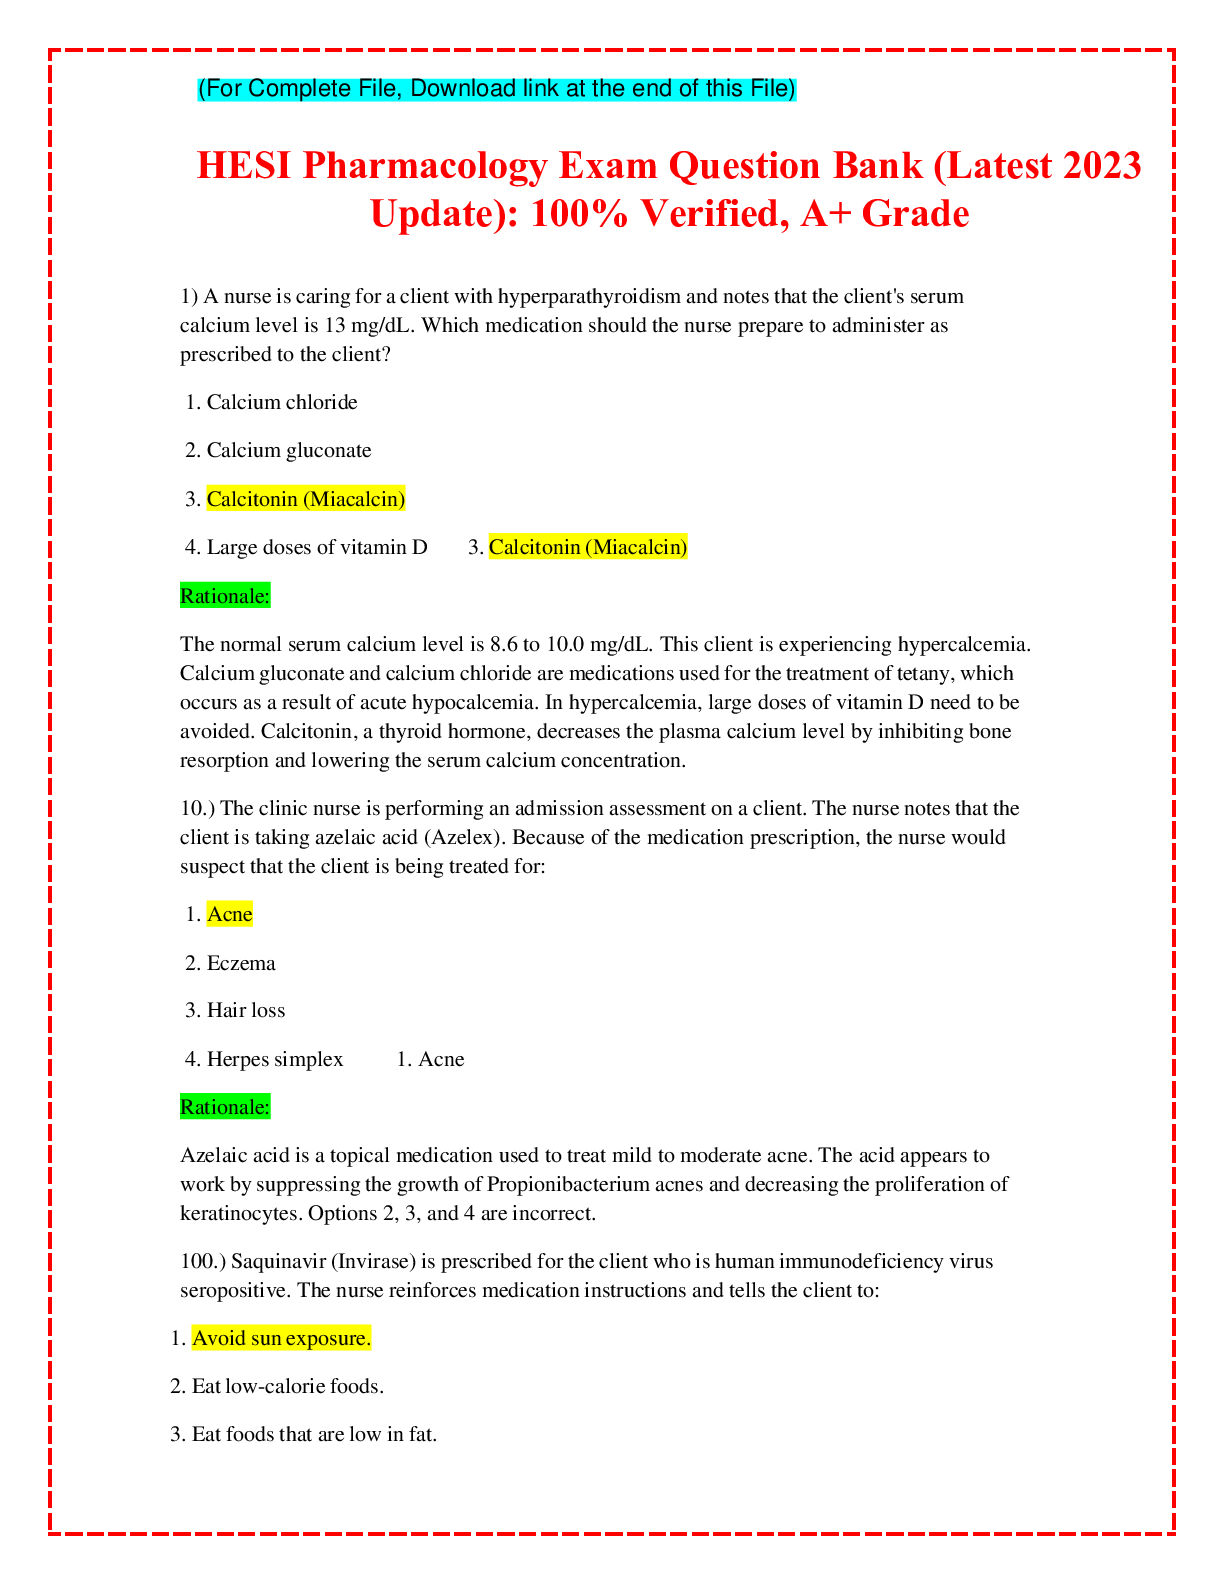
HESI Pharmacology Exam Question Bank (Latest 2023 Update)


Pharmacology Exam Study Guide Test Bank_Complete Latest 2023 |...
Discrete Mathematics and Its Applications 8th Edition by Kenne...
Finite Mathematics & Its Applications, 13e Larry Goldstein, Da...
.png)