Name: ______________________________________ Date: ________________________
Student Exploration: Earthquakes 2 – Determination of Epicenter
[NOTE TO TEACHERS AND STUDENTS: This exercise assumes that you have a data tab
...
Name: ______________________________________ Date: ________________________
Student Exploration: Earthquakes 2 – Determination of Epicenter
[NOTE TO TEACHERS AND STUDENTS: This exercise assumes that you have a data table
and graph made while using the Earthquakes 1 – Recording Center Gizmo™. If you do not
have those, or have never used that Gizmo before, do that first.]
Vocabulary: body wave, earthquake, epicenter, fault, focus, P wave, S wave, seismic wave,
seismogram, seismograph
Prior Knowledge Questions (Do these BEFORE using the Gizmo.)
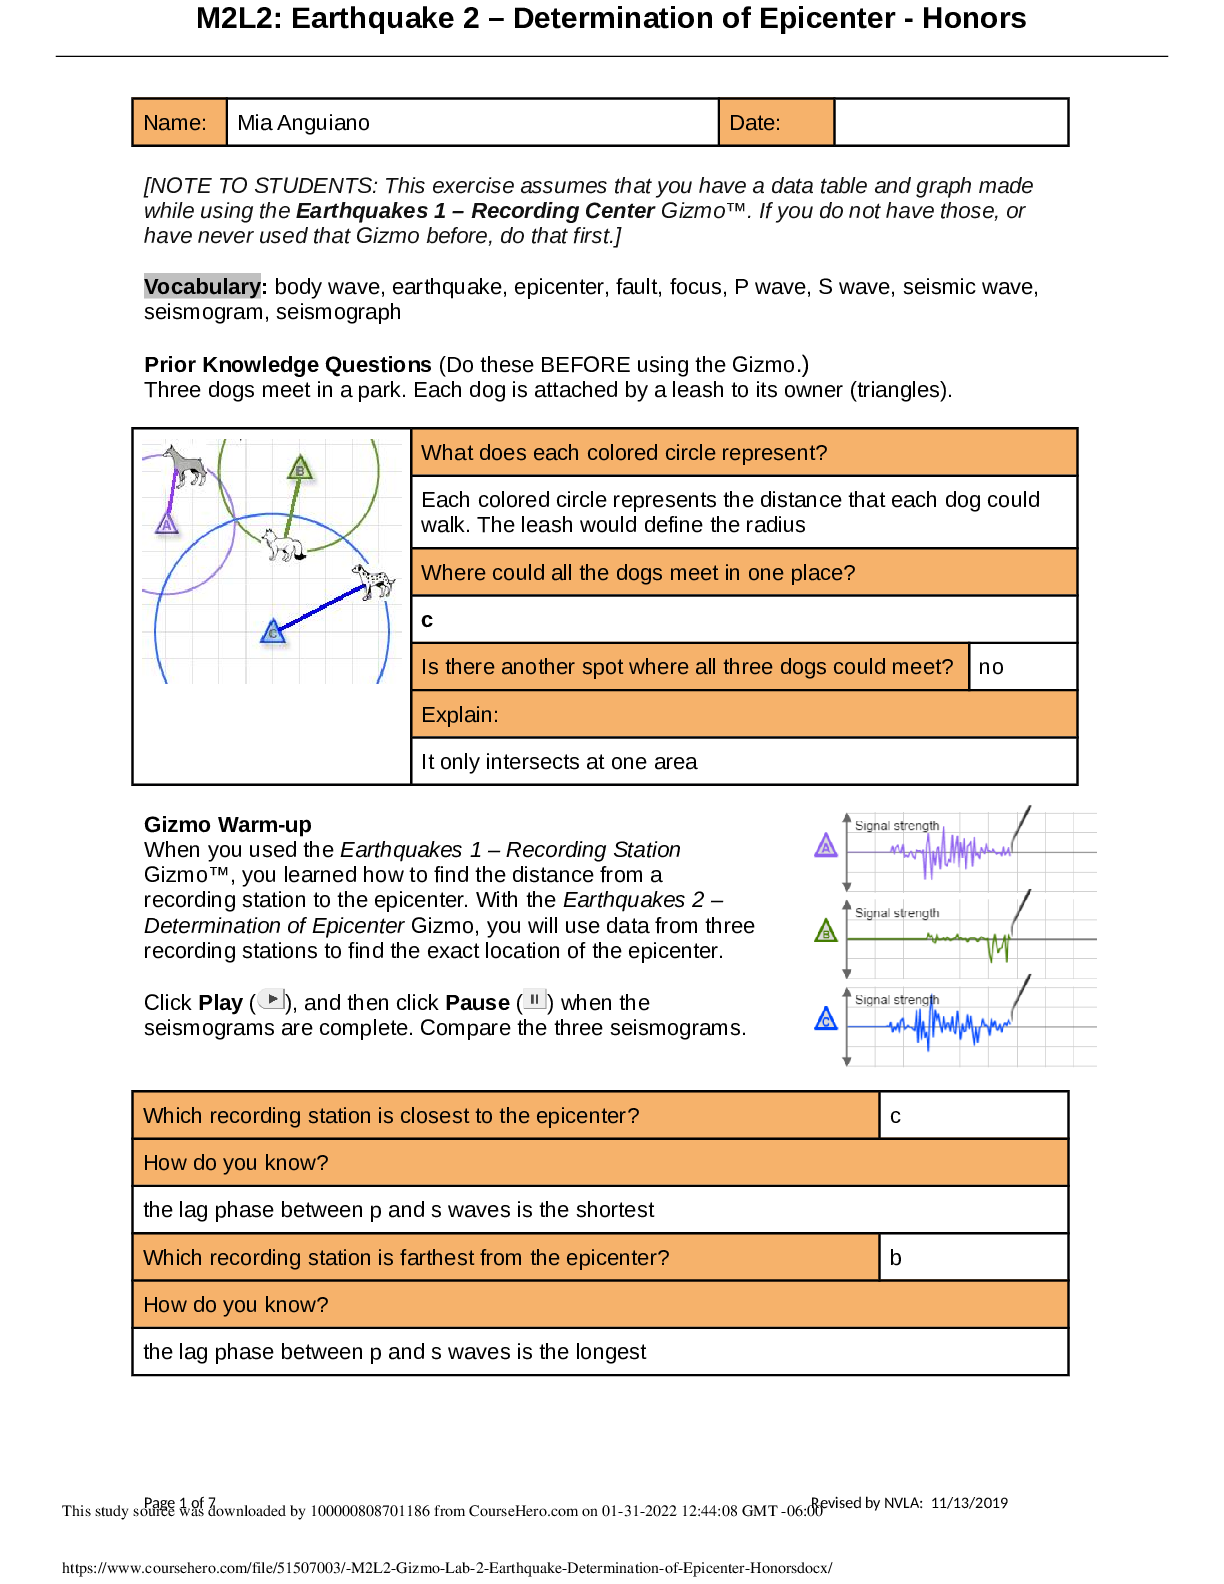
Three dogs meet in a park. Each dog is attached by a leash to its owner (triangles).
1. What does each colored circle represent? ________________
__________________________________________________
2. Where could all the dogs meet in one place? Draw this point
on the diagram.
3. Is there another spot where all three dogs could meet? ______
Explain: ___________________________________________
Gizmo Warm-up
When you used the Earthquakes 1 – Recording Station
Gizmo™, you learned how to find the distance from a
recording station to the epicenter. With the Earthquakes 2 –
Determination of Epicenter Gizmo, you will use data from three
recording stations to find the exact location of the epicenter.
Click Play ( ), and then click Pause ( ) when the
seismograms are complete. Compare the three seismograms.
1. Which recording station is closest to the epicenter? ______
How do you know? _________________________________________________________
2. Which recording station is farthest from the epicenter? ______
How do you know? _________________________________________________________
https://www.coursehero.com/file/35698540/Earthquakes2EpicenterSEpdf/
This study resource was
shared via CourseHero.comActivity:
Locating the
epicenter
Get the Gizmo ready:
x Click Reset ( ).
x Click Play, and then click Pause when the
seismograms are complete.
Goal: Based on three seismograms, locate the epicenter of an earthquake.
1. Prepare: To complete this activity, you will need the table and graph you made in the
Earthquakes 1 – Recording Station Student Exploration. Take this out now.
2. Measure: Turn on Show time probe. On each seismogram, locate the first P-wave and the
first S-wave. Measure the time interval (∆t) for each seismogram, and then use your graph
to find the distance of each station to the epicenter.
Station Time interval (∆t) Distance to epicenter (km)
ABC
3. Locate: Turn on the Show station A checkbox. Set the Radius to the distance of station A
from the epicenter, based on your table above. Look on the circle on the map.
Where could the epicenter be located? __________________________________________
4. Locate: Turn on the Show station B checkbox. Set the Radius to the distance of station B
from the epicenter. Look on the two circles on the map.
Which two places could the epicenter be located now? _____________________________
_________________________________________________________________________
5. Locate: Turn on the Show station C checkbox. Set the Radius to the distance of station C
from the epicenter. If you did everything right, you should see the epicenter symbol ( ). If
you do not, recheck all of your distances. (You may need to adjust each radius slightly.)
Relative to the three circles, where is the epicenter located? _________________________
_________________________________________________________________________
6. Practice: Click Reset. Try to locate at least five more epicenters. Each time you locate an
epicenter, click the Tools palette and click Screen shot. Right-click the image, choose
“Copy Image,” and paste the image into a blank document to turn in with this sheet.
https://www.coursehero.com/file/35698540/Earthquakes2EpicenterSEpdf/
This study resource was
shared via CourseHero.com
Powered by TCPDF (www.tcpdf.org)
[Show More]