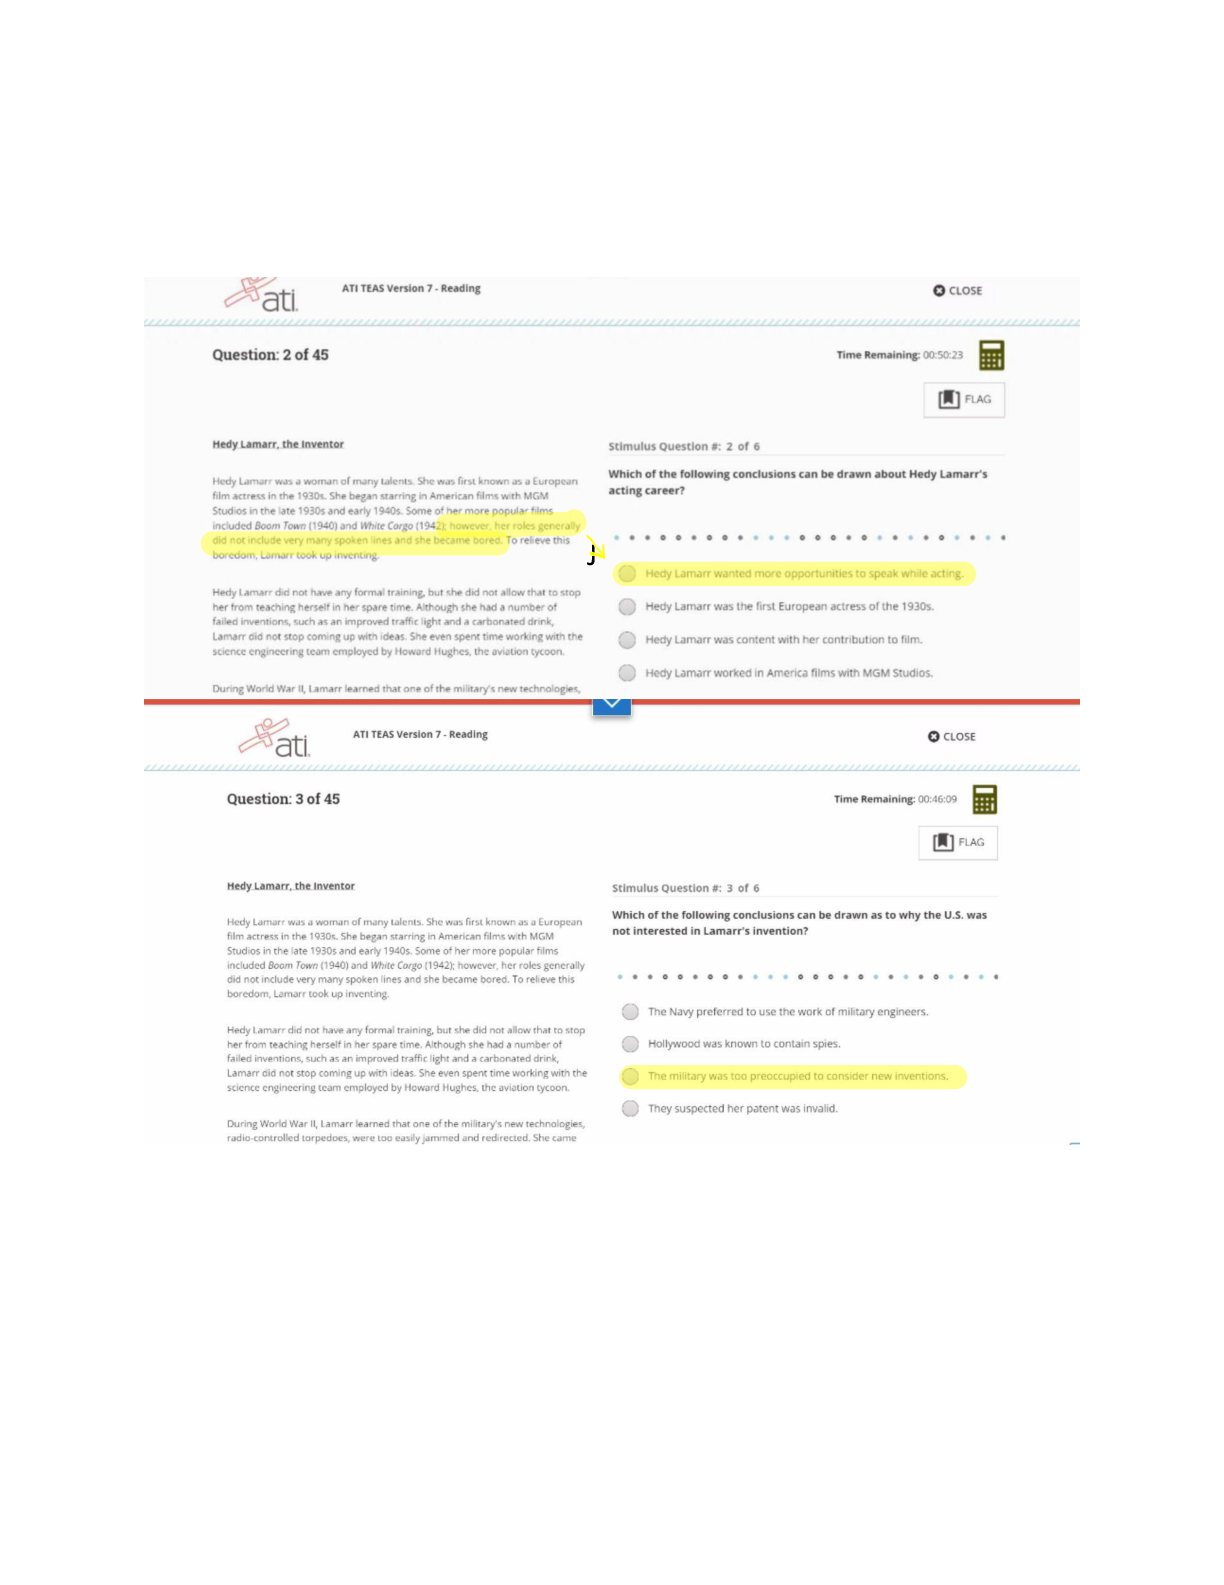
98.5% of the variation in age is explained by a linear relationship with yearly income.
The correlation coefficient, r, is 0.969.
98.5% of the variation in yearly income is explained by a linear relationship with age
...
98.5% of the variation in age is explained by a linear relationship with yearly income.
The correlation coefficient, r, is 0.969.
98.5% of the variation in yearly income is explained by a linear relationship with age.
The correlation coefficient, r, is 0.992
98.5% of the variation in yearly income is explained by a nonlinear relationship with age.
The correlation coefficient, r, is 0.992.
RATIONALE
The coefficient of determination measures the percent of variation in the outcome, y, explained by the regression. So a value of 0.9846 tells us the regression with age, x,
can explain about 98.5% of the variation in income, y.
We can also note that r = .
CONCEPT
Coefficient of Determination/r^2
2
The first quartile (Q1) value from the above box plot is __________.
40
33
29
52
RATIONALE
Note the value for Q1 is the left edge of the box, which is 33.
CONCEPT
Five Number Summary and Boxplots
3
The manager of a mall conducted a survey among two groups (n1 = 100, n2 = 100) of visitors to the mall on different days. She found that the first group spent an average
of 60 minutes in the mall, while the second group spent an average of 90 minutes in the mall.
If the manager wishes to see the difference in the average times spent by the two groups in the mall, which of the following sets shows the null hypothesis and
alternative hypothesis?
Null Hypothesis: There is at least some difference in the average times spent by the two groups in the mall.
Alternative Hypothesis: The difference in the average times spent by the two groups in the mall is 30 minutes.
9/18/2020 Sophia :: Welcome
https://strayer.sophia.org/spcc/introduction-to-statistics-2/milestone_take_feedbacks/6220477 4/14
Null Hypothesis: There is at least some difference in the average times spent by the two groups in the mall.
Alternative Hypothesis: There is no difference in the average times spent by the two groups in the mall.
Null Hypothesis: There is no difference in the average times spent by the two groups in the mall.
Alternative Hypothesis: There is at least some difference in the average times spent by the two groups in the mall.
Null Hypothesis: There is no difference in the average times spent by the two groups in the mall.
Alternative Hypothesis: There is a difference in the average times spent by the two groups in the mall, with a standard deviation of 30 minutes.
RATIONALE
Recall that the null hypothesis is always of no difference.
So the null hypothesis (Ho) is that the mean time spent at the mall for the first group = mean time for the second group. This would indicate no difference between the
two groups.
The alternative hypothesis (Ha) is that there is difference in the mean time spent at the mall between the two groups.
[Show More]