Basic Statistics > A-Level Question Paper > introduction to statistics unit 5 milestone 5 (All)
introduction to statistics unit 5 milestone 5
Document Content and Description Below
Last updated: 2 years ago
Preview 1 out of 23 pages
Instant download

Buy this Document to get the Full Access Instantly
Provided by Students Who Aced it
We Verify Document Content to Gurantee Accuracy
Reviews( 0 )
Document information
Connected school, study & course
About the document
Uploaded On
Nov 05, 2023
Number of pages
23
Written in
All

Additional information
This document has been written for:
Uploaded
Nov 05, 2023
Downloads
0
Views
143
Document Keyword Tags
Recommended For You
Get more on A-Level Question Paper »


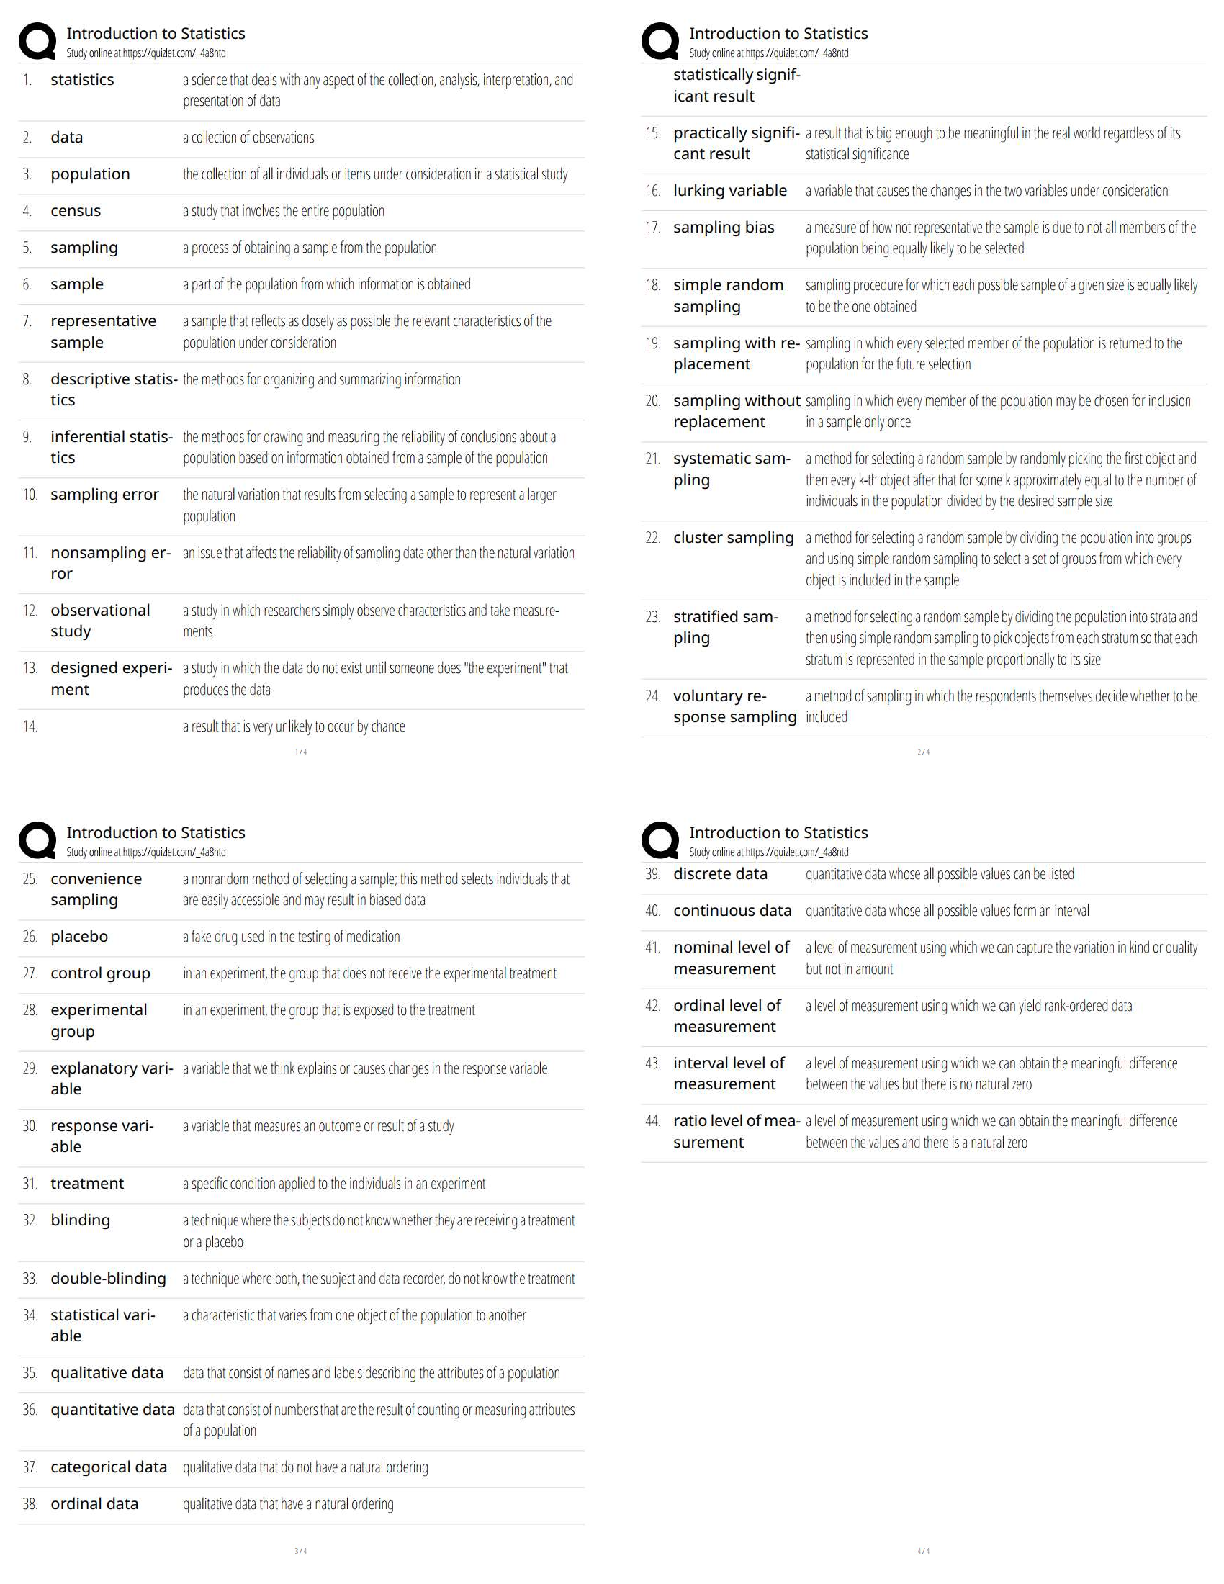
Basic Business Statistics Concepts and Applications 14th Editi...
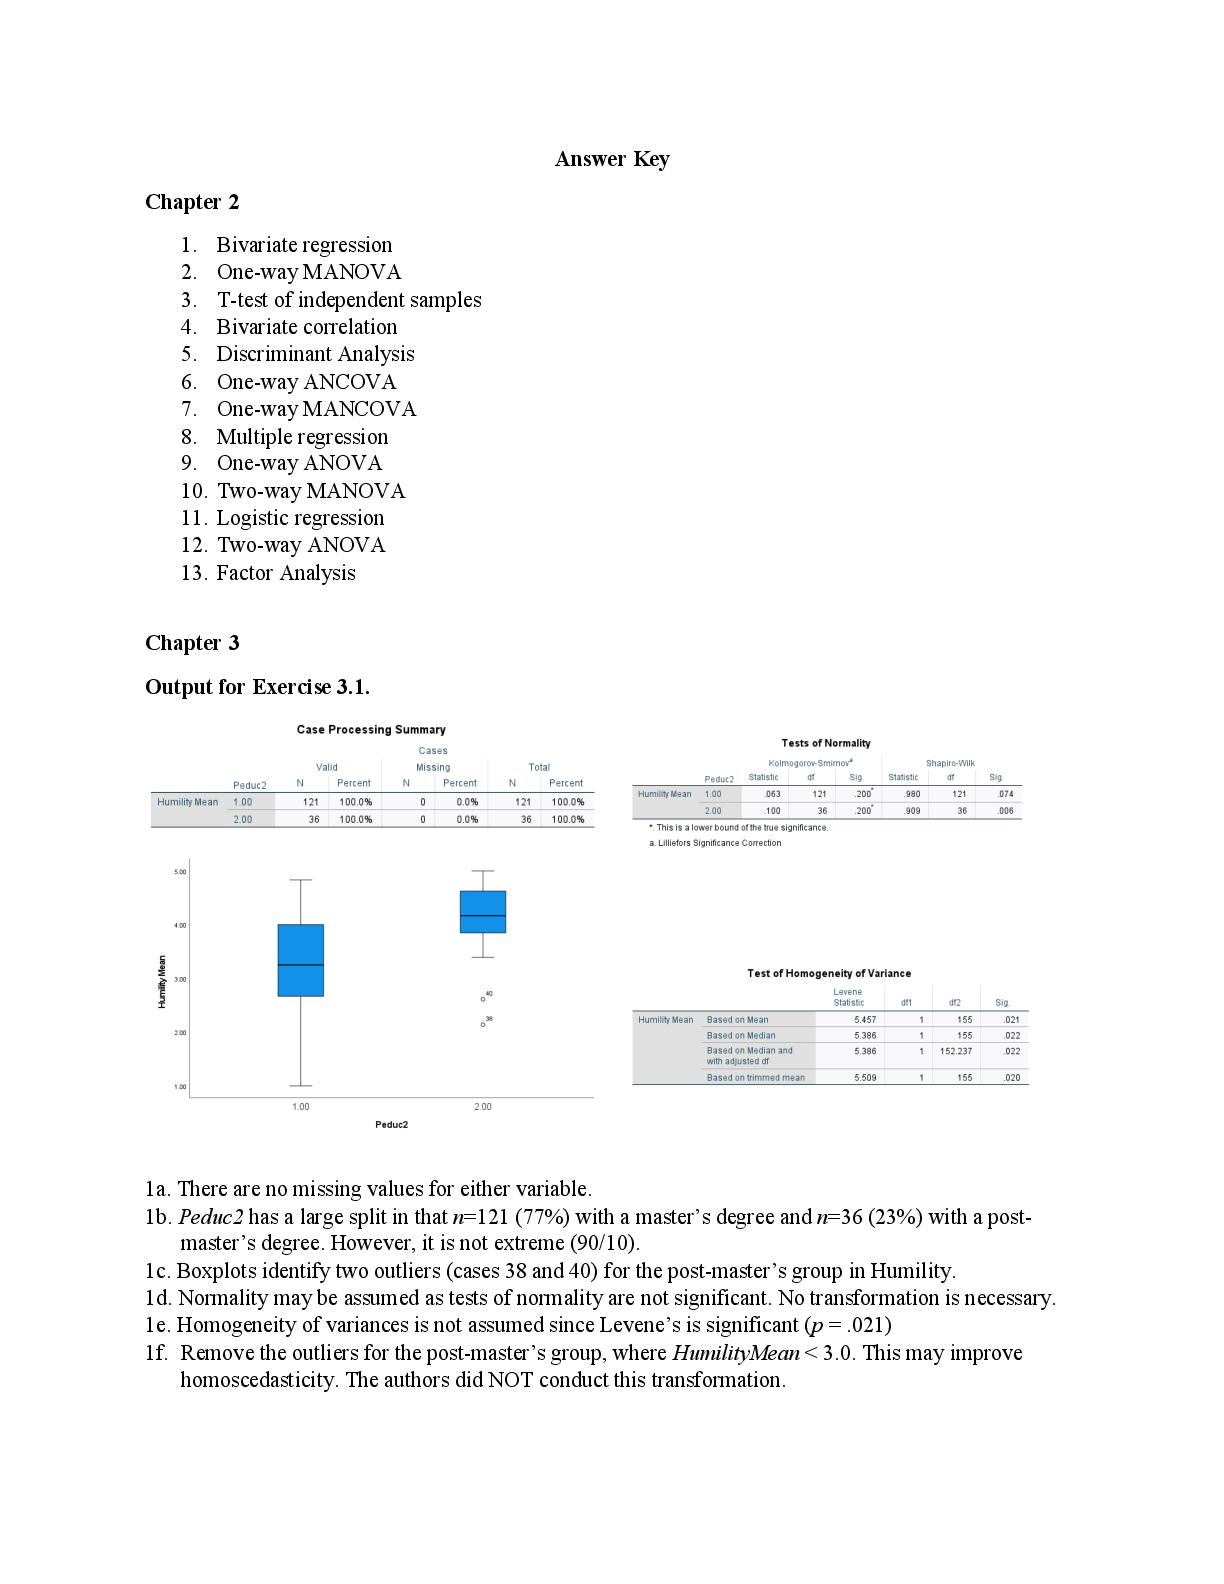
Solutions Manual for Advanced and Multivariate Statistical Met...
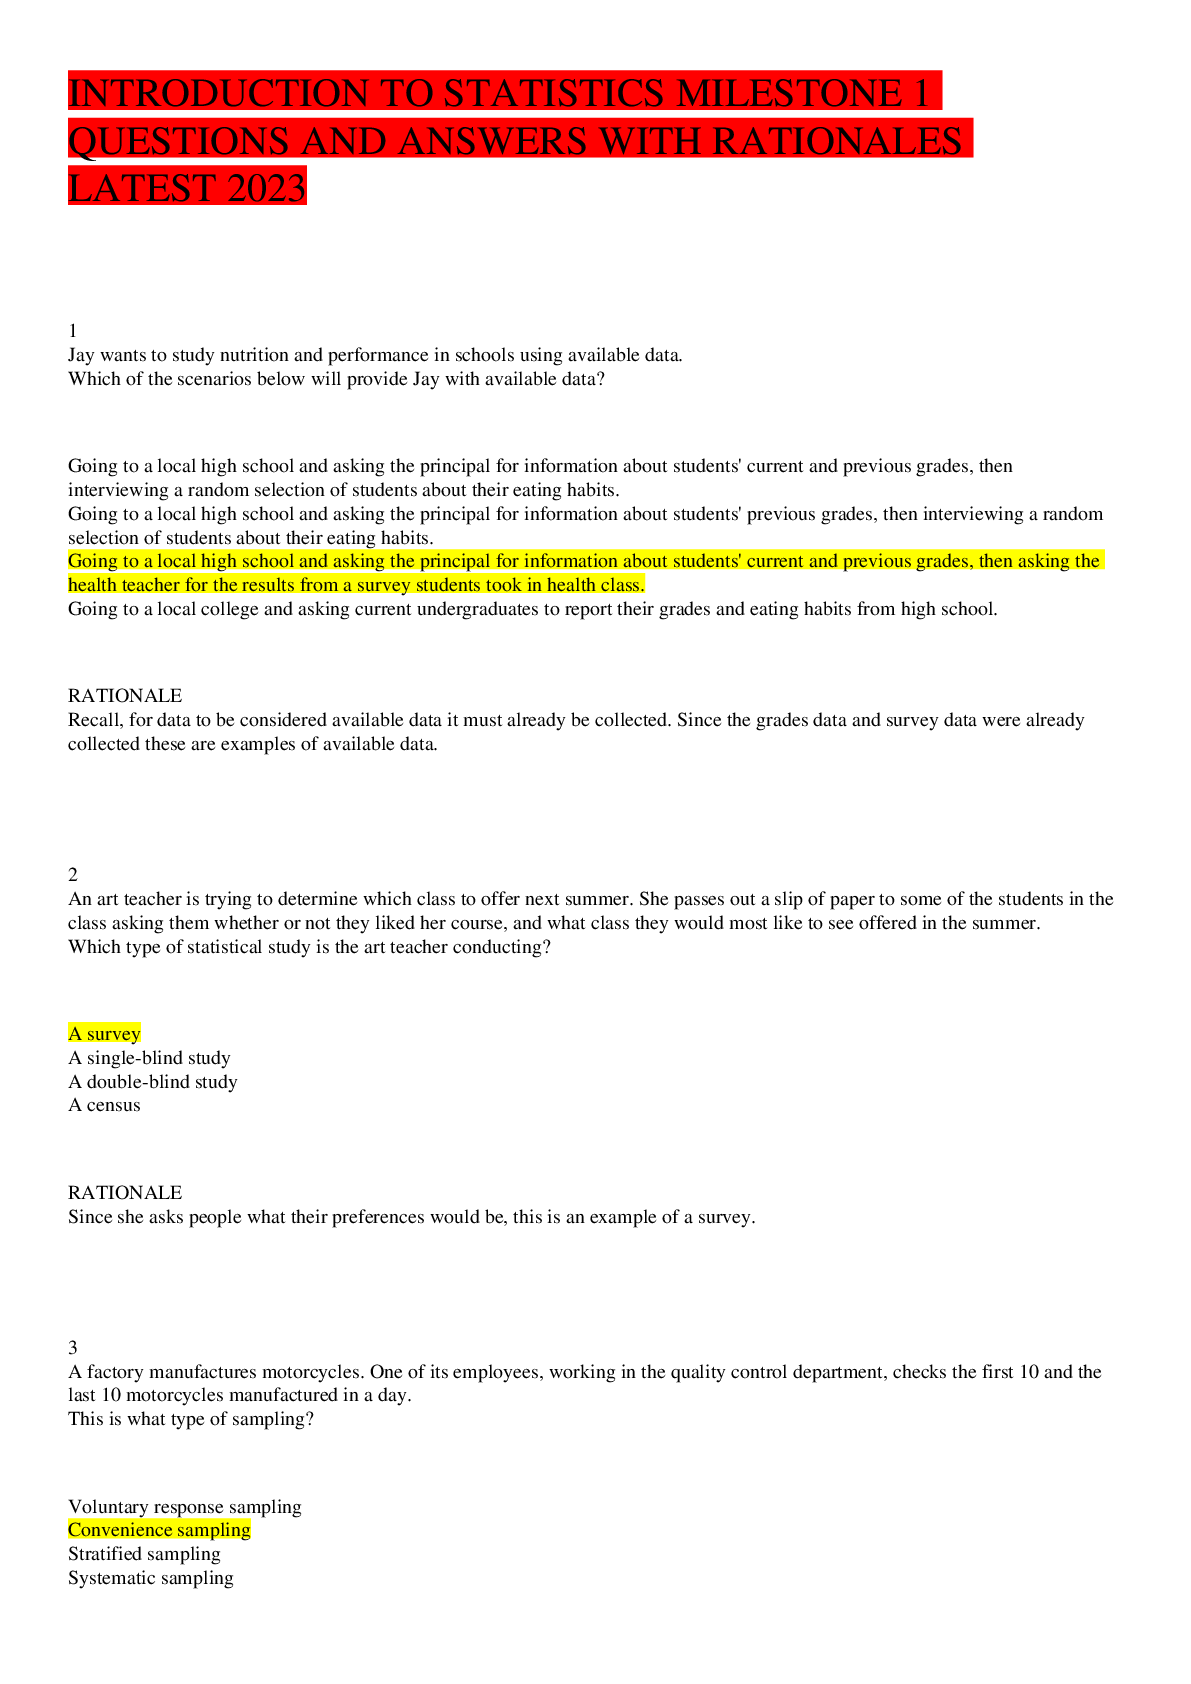
INTRODUCTION TO STATISTICS MILESTONE 1 QUESTIONS AND ANSWERS W...
Test Bank for Statistical Techniques in Business and Economics...
Test Bank For Elementary Statistics Picturing the World, 8th E...
Test Bank for Applied Statistics in Business and Economics, 20...
Solutions Manual For Fundamentals of Statistics: Informed Deci...
Solutions Manual For Elementary Statistics Using the TI-83 84...

Solutions Manual For Applied Statistics for Business and Econo...
Solution Manual for Fundamentals of Biostatistics 8th Edition...

Solution Manual Mathematical Statistics with Applications Stu...
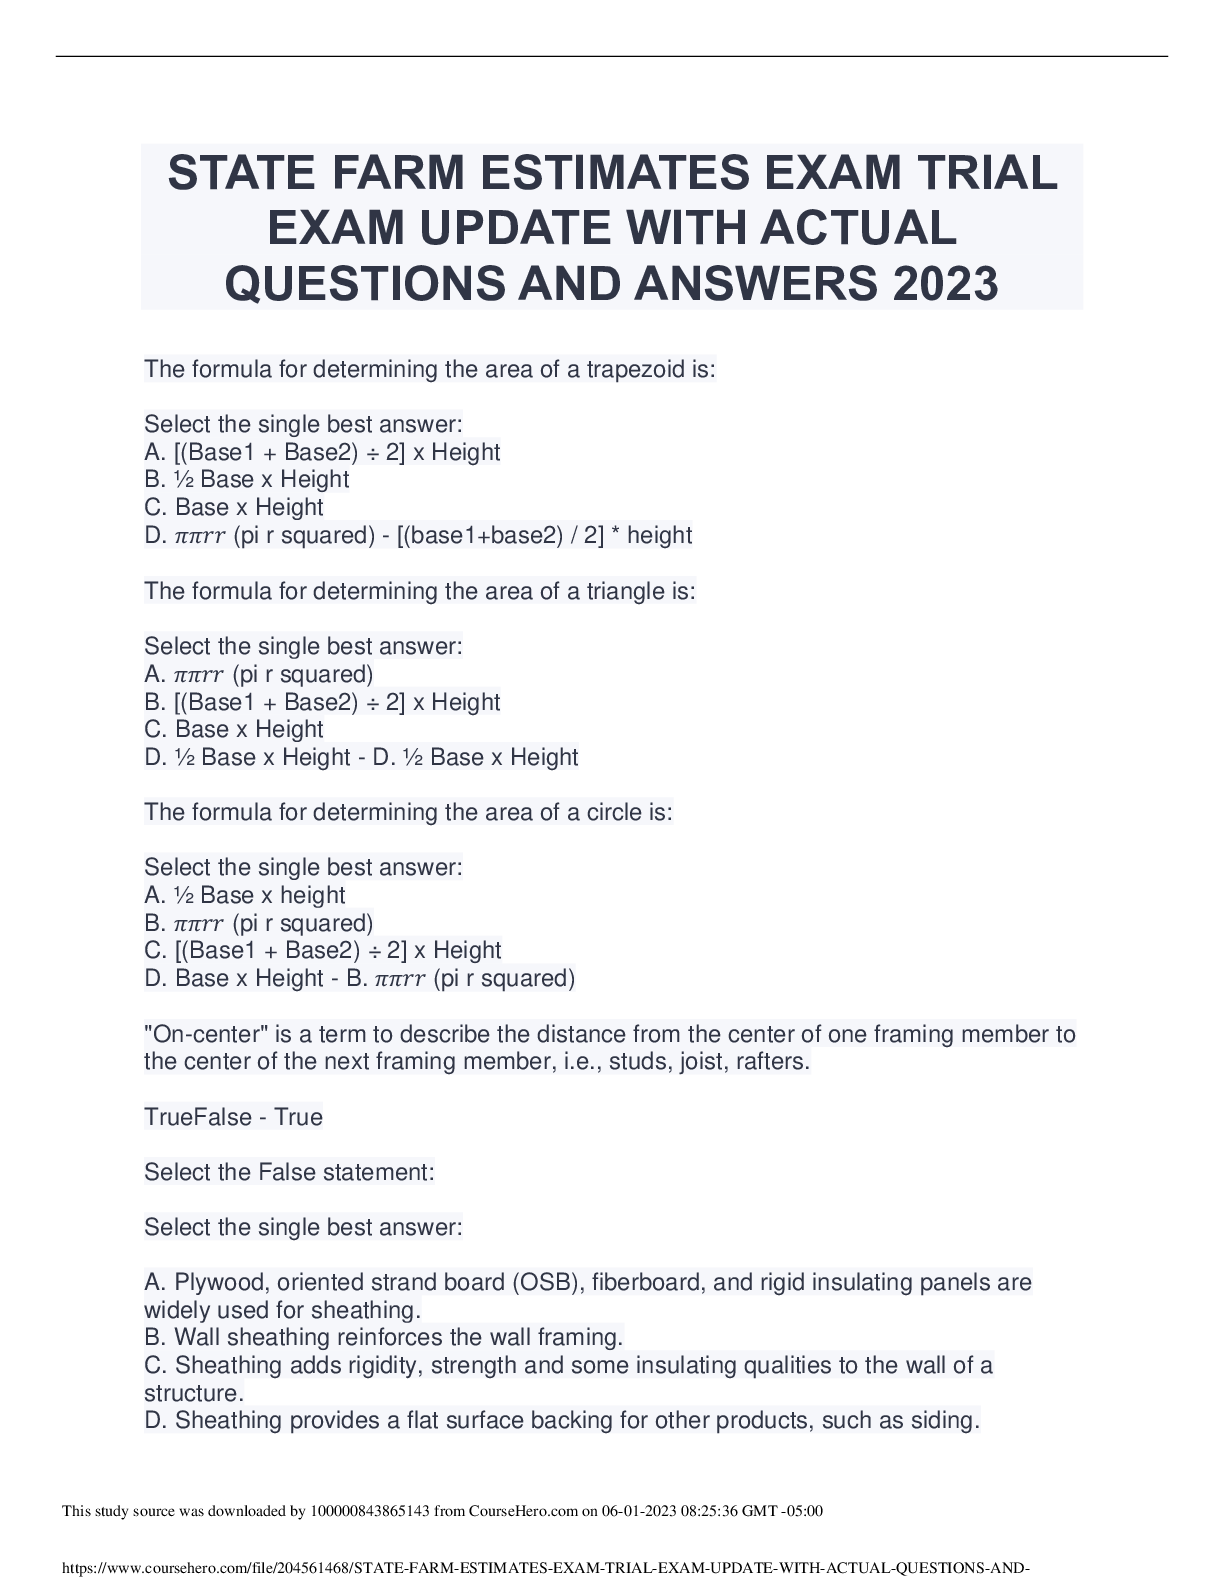
State Farm Estimatics Exam | Actual Exam 2023 (100% Correct An...