Mathematics > SOLUTIONS MANUAL > Solution Manual - Mathematical Statistics with Applications 7th edition, Wackerly (All)
Solution Manual - Mathematical Statistics with Applications 7th edition, Wackerly
Document Content and Description Below
Last updated: 1 year ago
Preview 1 out of 333 pages
Instant download
Buy this Document to get the Full Access Instantly
Provided by Students Who Aced it
We Verify Document Content to Gurantee Accuracy
Reviews( 0 )
Document information
Connected school, study & course
About the document
Uploaded On
Feb 16, 2024
Number of pages
333
Written in
All

Additional information
This document has been written for:
Uploaded
Feb 16, 2024
Downloads
0
Views
172
Document Keyword Tags
Recommended For You
Get more on SOLUTIONS MANUAL »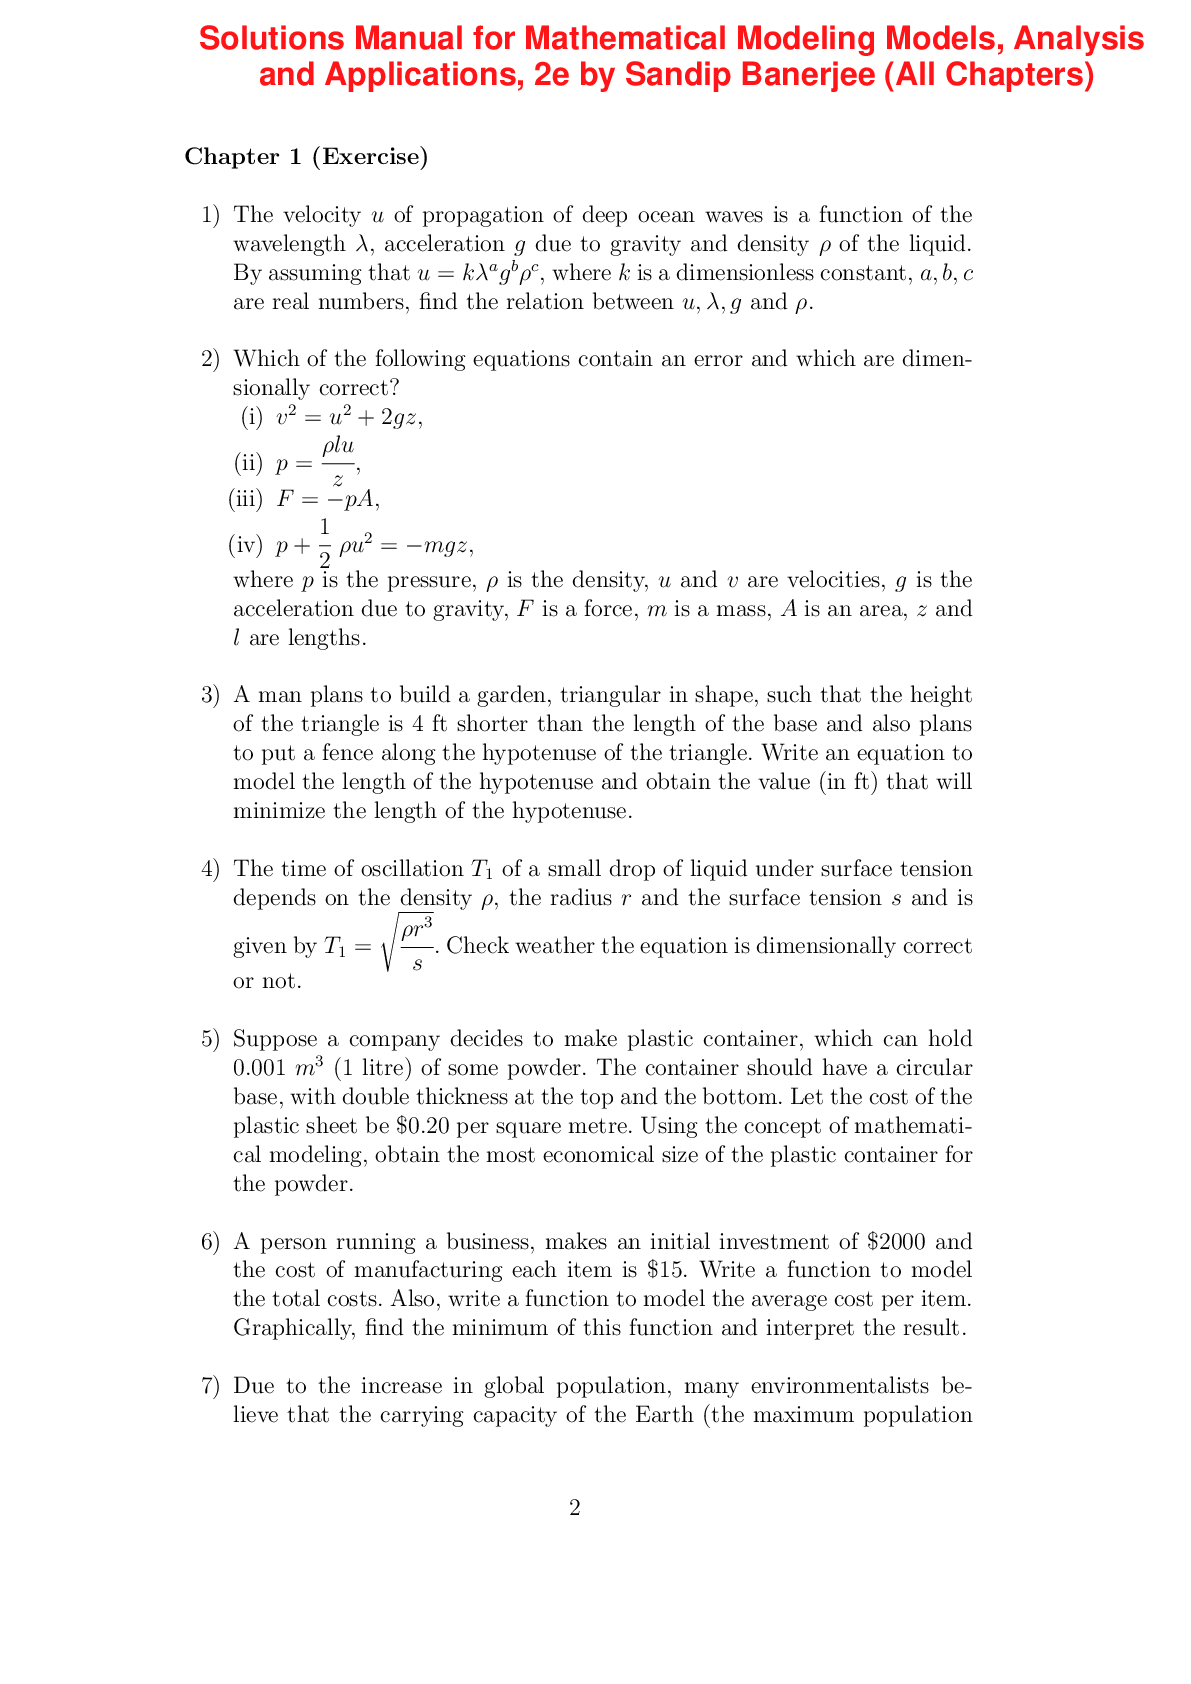
Mathematical Modeling Models, Analysis and Applications, 2e by...
Finite Mathematics & Its Applications, 13e Larry Goldstein, Da...
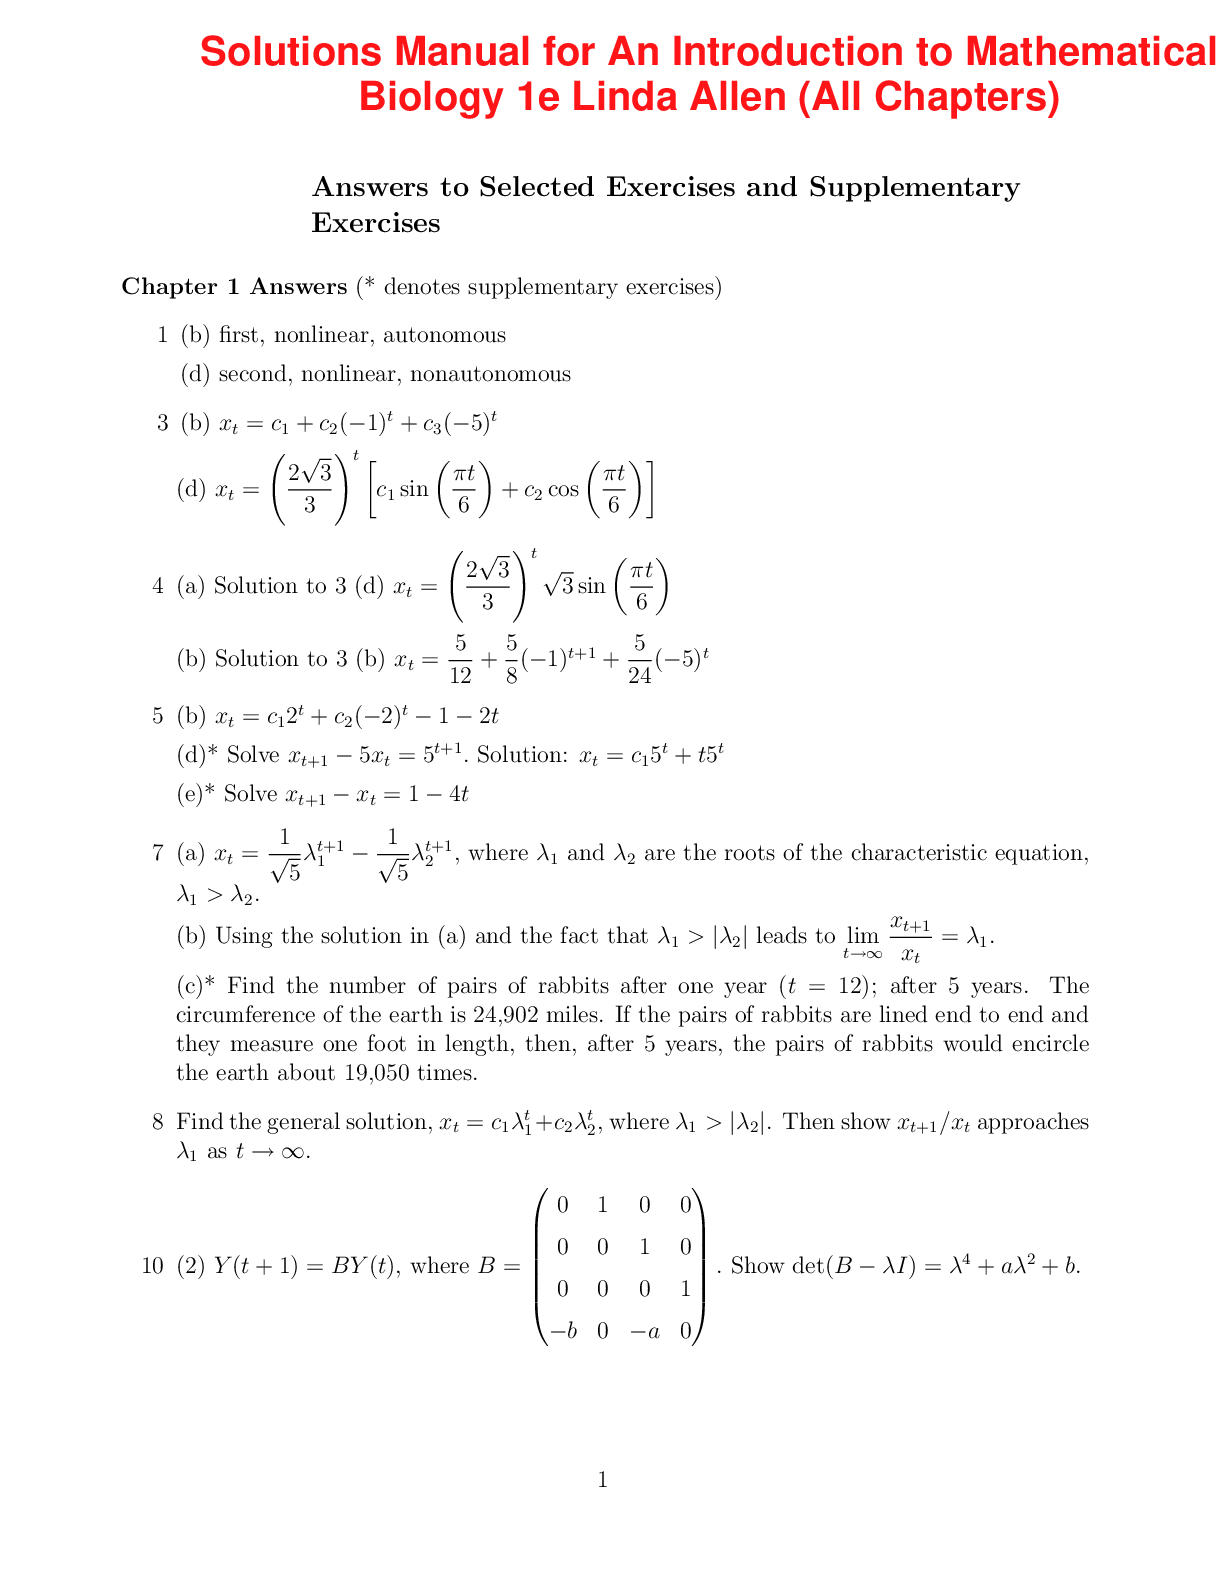
An Introduction to Mathematical Biology 1st Edition By Linda A...
Discrete Mathematics and Its Applications 8th Edition by Kenne...
![Preview of eBook [PDF] Journey Into Discrete Mathematics Vol 41 By Owen D. Byer, Deirdre L. Smeltzer,](https://browseimages.nyc3.digitaloceanspaces.com/paper-images/2026/04/07/6jkpv7ap2026-04-07-04-3269d5076c4b92f.png)

Probability & Statistics Homework 2: Theoretical Probability:...

Solution Manual Mathematical Statistics with Applications Stu...
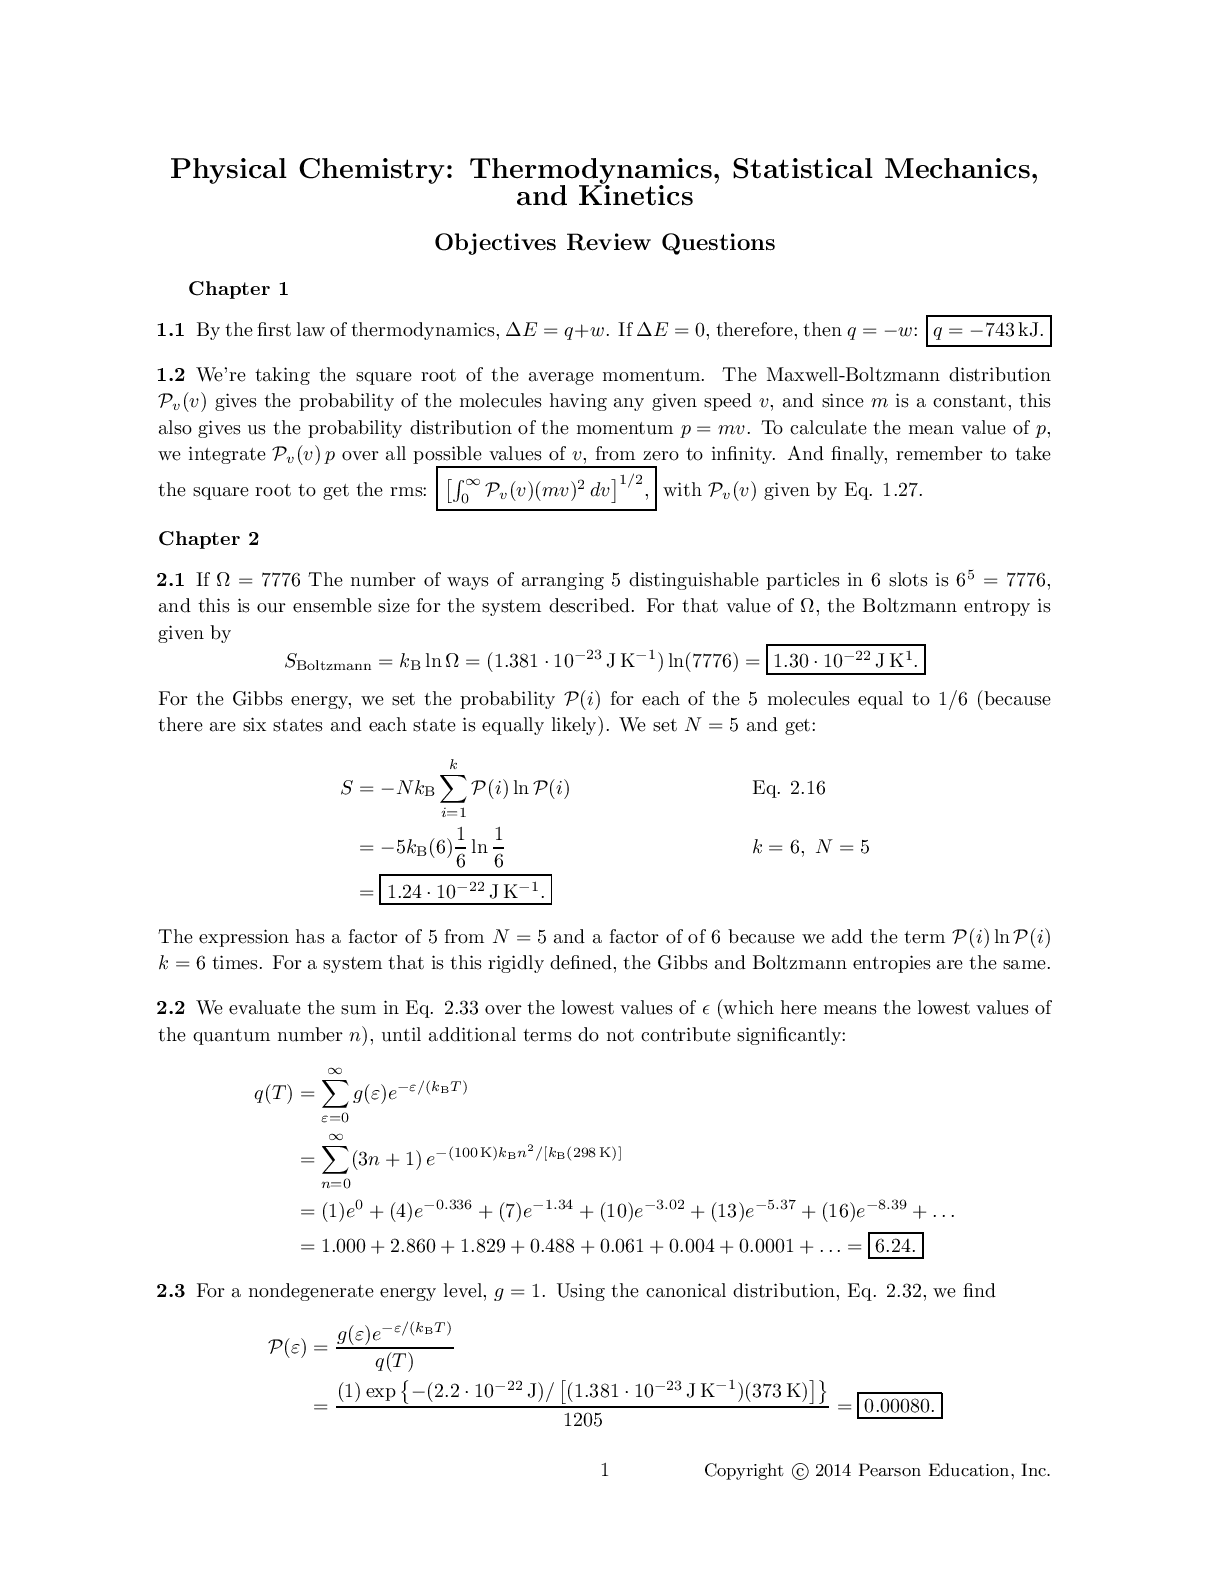
Physical Chemistry Thermodynamics Statistical Mechanics and Ki...
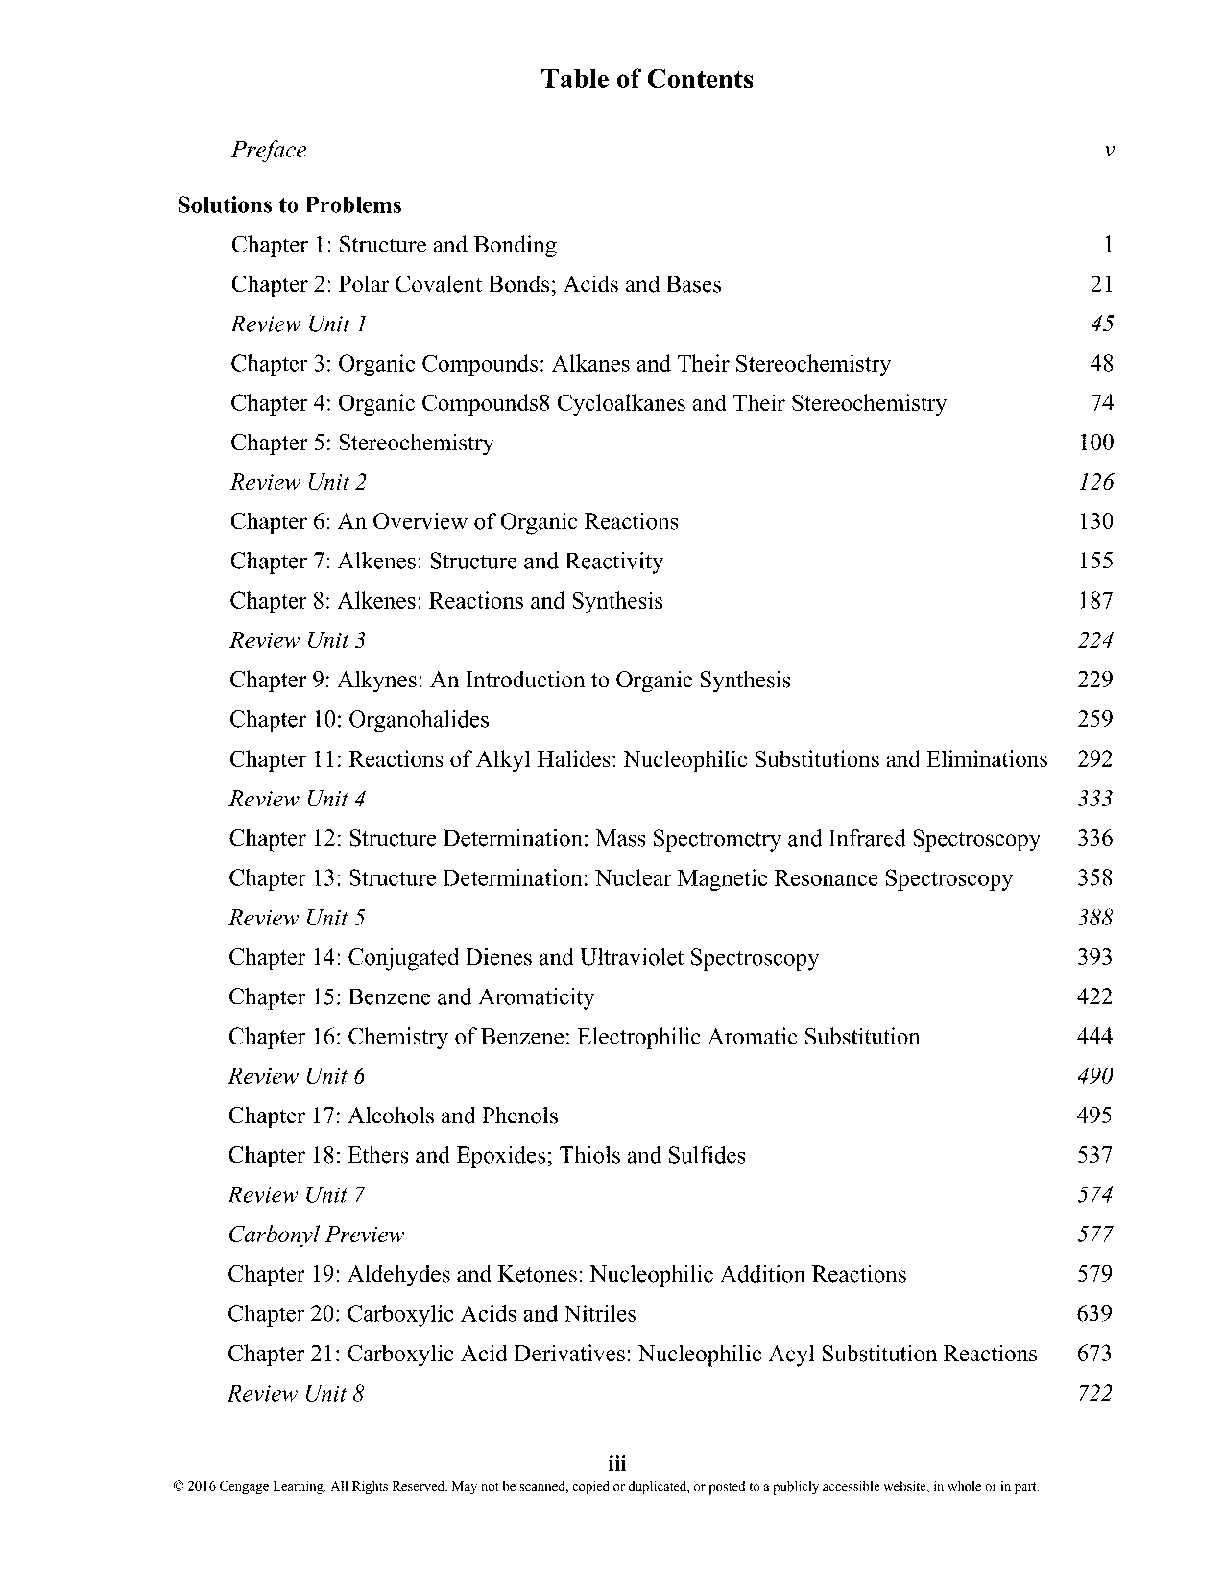
Solutions Manual for Organic Chemistry 9th Edition by John McM...
![Preview of [eTextbook] [PDF]Abdul-Majid Wazwaz-A First Course in Integral Equations_ Solutions Manual](https://browseimages.nyc3.digitaloceanspaces.com/paper-images/2025/Jan/15/X5ucEewu2025-01-15-07-136787deb987ab5.png)
 for Linear Algebra and Its Applications (Thomas Polaski, Judith McDonald -David C.png)