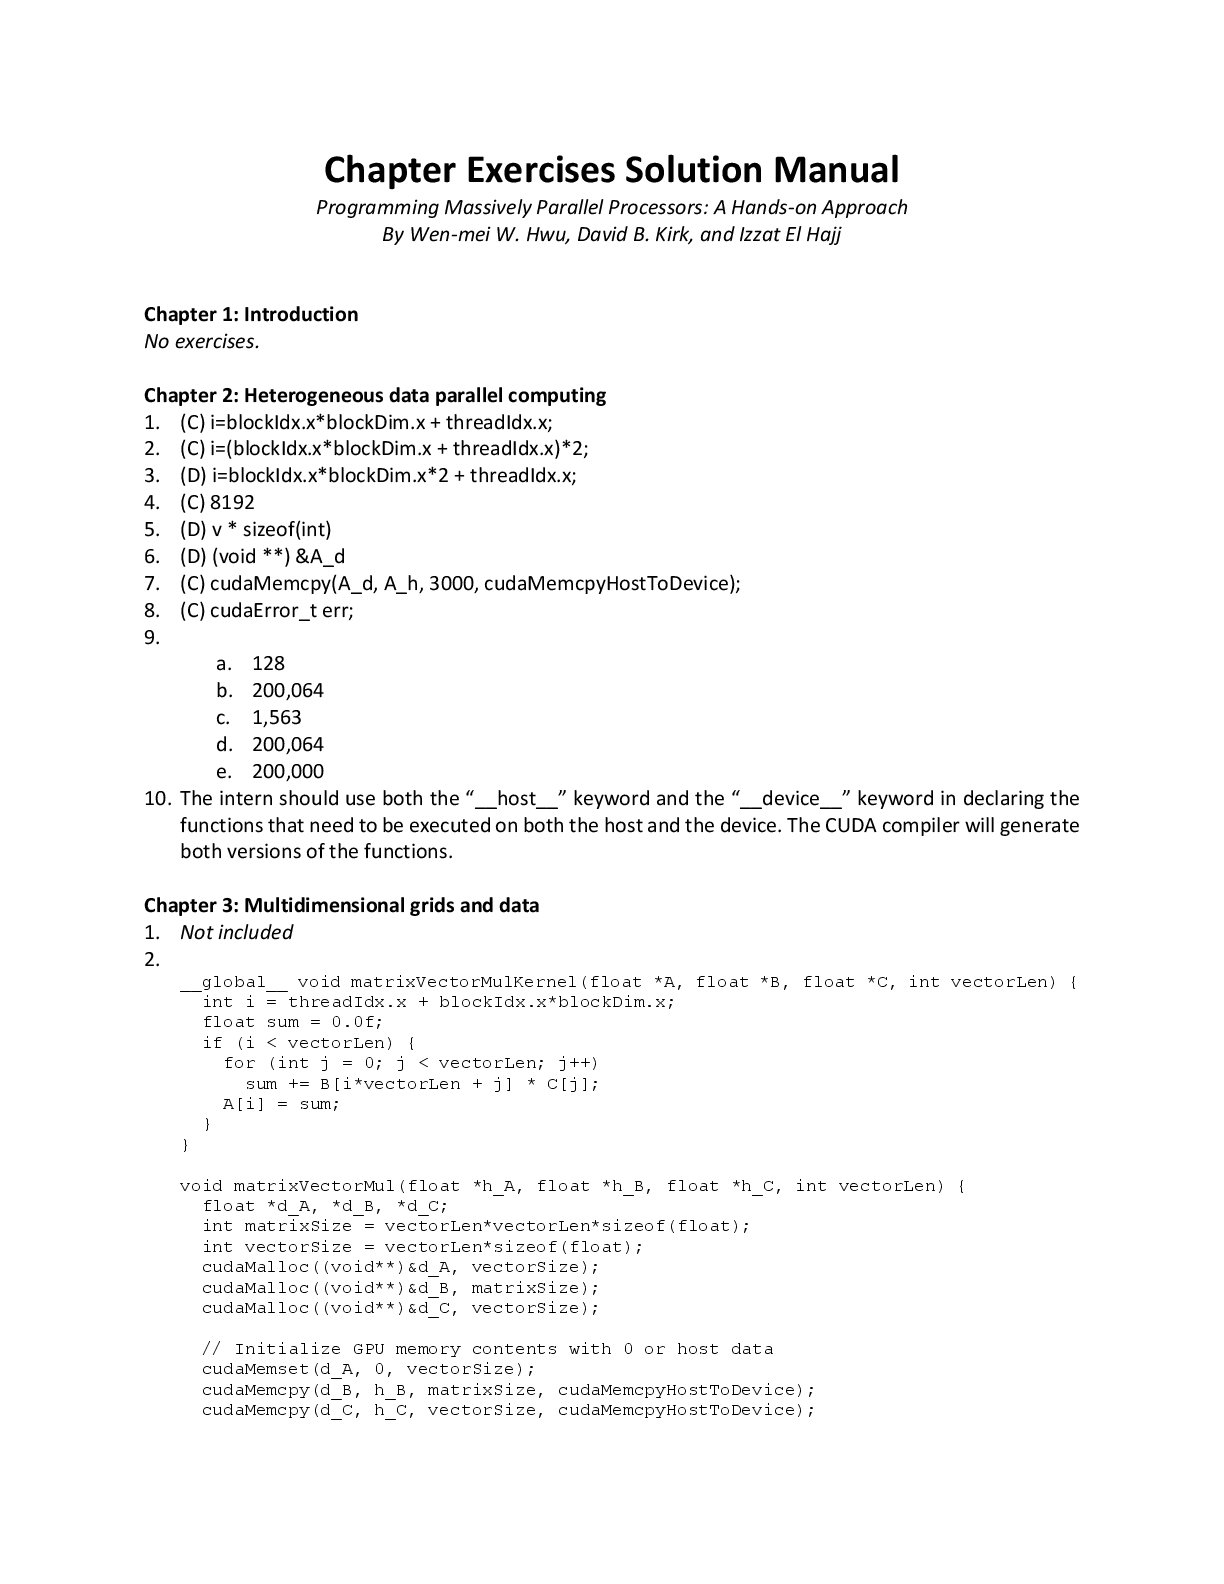
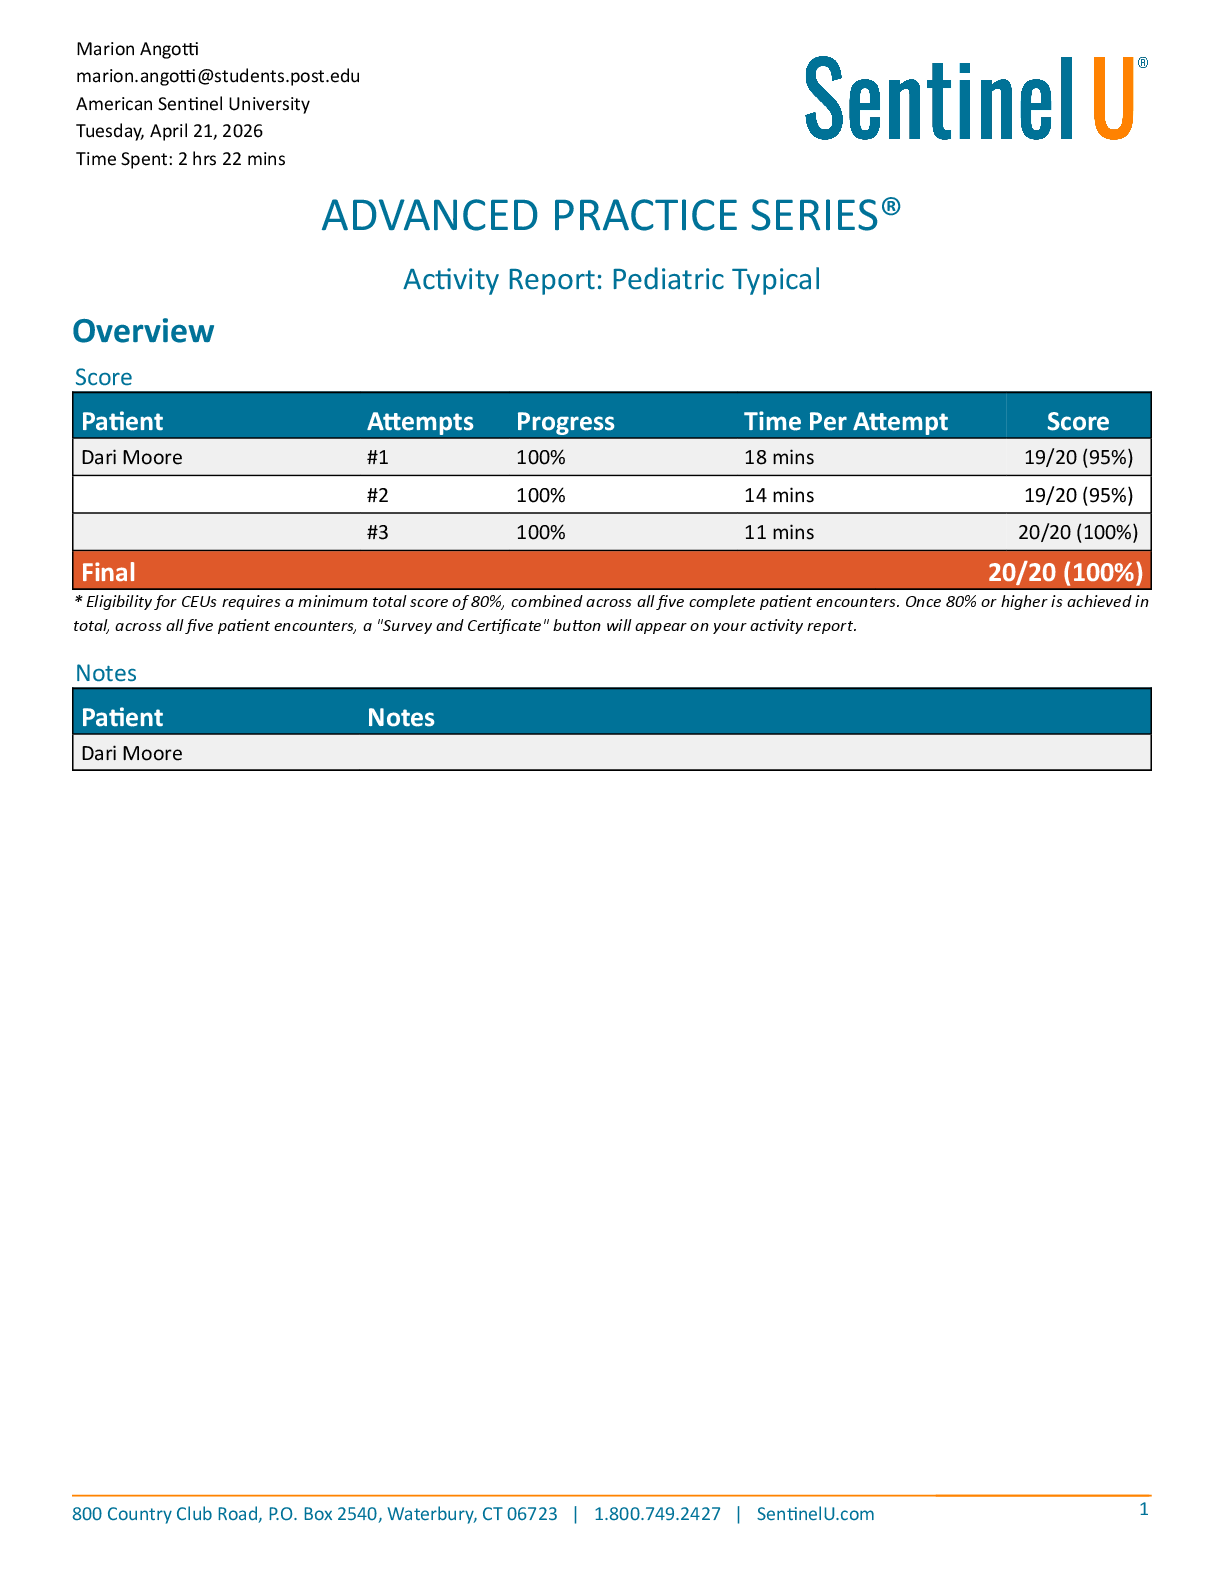
Mid-term1 Solutions. GT Learners: Practice Problems for Midterm 1 - Sample solutions | Practice Problems for Midterm 1: Topics 1-5 | CSE6040x Courseware | edX
9/16/2018 GT Learners: Practice Problems for Midterm 1 - S
...
Mid-term1 Solutions. GT Learners: Practice Problems for Midterm 1 - Sample solutions | Practice Problems for Midterm 1: Topics 1-5 | CSE6040x Courseware | edX
9/16/2018 GT Learners: Practice Problems for Midterm 1 - Sample solutions | Practice Problems for Midterm 1: Topics 1-5 | CSE6040x GT Learners: Practice Problems for Midterm 1 - Sample solutions
Problem 0: Two algorithms to calculate sample variance
This problem is related to floating-point arithmetic and the sample variance, a commonly used measure in statistics. However, the problem should go quickly
-- so, if you find yourself spending a lot of time on it, you may be overthinking it or consider returning to it later.
There are two exercises, numbered 0 and 1, which are worth a total of ten (10) points.
Setup
Python has a built-in function, statistics.variance (https://docs.python.org/3.5/library/statistics.html#statistics.variance), that computes the sample
variance. However, for this problem we want you to implement it from scratch in two different ways and compare their accuracy. (The test codes will use
Python's function as a baseline for comparison against your implementations.)
In [1]: # Run this cell.
from statistics import variance
SAVE_VARIANCE = variance # Ignore me
A baseline algorithm to compute the sample variance
Suppose we observe samples from a much larger population. Denote these observations by . Then the sample mean (sample average), ,
is defined to be
Given both the samples and the sample mean, a standard formula for the (unbiased) sample variance, , is
Exercise 0 (5 points). Write a function, var_method_0(x), that implements this formula for the sample variance given a list x[:] of observed sample
values.
Remember not to use Python's built-in variance().
9/16/2018 GT Learners: Practice Problems for Midterm 1 - Sample solutions | Practice Problems for Midterm 1: Topics 1-5 | CSE6040x A one-pass algorithm
If there are a huge number of samples, the preceding formula can be slow. The reason is that it makes two passes (or loops) over the data: once to sum the
samples and another to sum the squares of the samples.
So if there are a huge number of samples and these were stored on disk, for instance, you would have to read each sample from disk twice. (For reference,
the cost of accessing data on disk can be orders of magnitude slower than reading it from memory.)
However, there is an alternative that would touch each observation only once. It is based on this formula:
In exact arithmetic, it is the same as the previous formula. And it can be implemented using only one pass of the data, using an algorithm of the following
form:
n - 1
Data: n=100000 samples from a Gaussian with mean 10000000.0 and standard deviation 100.0
Python's variance function computed 10063.170554187718.
Your var_method_0(X) computed 10063.17055418769.
The relative difference is |you - python| / |python| ~= 2.7113563172029763e-15.
Data: n=100000 samples from a Gaussian with mean 10000000.0 and standard deviation 100.0
Python's variance function computed 10003.635238752606.
Your var_method_0(X) computed 10003.635238752513.
The relative difference is |you - python| / |python| ~= 9.273474828577053e-15.
Data: n=100000 samples from a Gaussian with mean 10000000.0 and standard deviation 100.0
Python's variance function computed 10030.563682314065.
Your var_method_0(X) computed 10030.563682314121.
The relative difference is |you - python| / |python| ~= 5.6216852109065725e-15.
Data: n=100000 samples from a Gaussian with mean 10000000.0 and standard deviation 100.0
Python's variance function computed 10019.621991875878.
Your var_method_0(X) computed 10019.62199187604.
The relative difference is |you - python| / |python| ~= 1.6157301847000327e-14.
Data: n=100000 samples from a Gaussian with mean 10000000.0 and standard deviation 100.0
Python's variance function computed 10015.134069715146.
Your var_method_0(X) computed 10015.134069715245.
The relative difference is |you - python| / |python| ~= 9.80769973798963e-15.
(Passed!)
9/16/2018 GT Learners: Practice Problems for Midterm 1 - Sample solutions | Practice Problems for Midterm 1: Topics 1-5 | CSE6040x Courseware | edX
https://courses.edx.org/courses/course-v1:GTx+CSE6040x+2T2019/courseware/699d28ed10b24b31b66d2bd82dd165fd/99e95a611b384ef98e70838a5eb90598/2?ac… 3/57
Exercise 1 (5 points). Implement a function, var_method_1(x), for the one-pass scheme shown above.
The test cell below will run several experiments comparing its accuracy to the accuracy of the first method. You should observe that the one-pass method
can be highly inaccurate!
In [4]: def var_method_1(x):
n = len(x)
### BEGIN SOLUTION
s, s2 = 0.0, 0.0
for x_i in x:
s += x_i
s2 += x_i*x_i
return (s2 - (s*s/n)) / (n-1)
### END SOLUTION
In [5]: # Test cell: `exercise_1_test`
from random import gauss
from statistics import variance
n = 100000
mu = 1e7
sigma = 1.0
for _ in range(5): # 5 trials
X = [gauss(mu, sigma) for _ in range(n)]
var_py = variance(X)
try:
del variance
var_you_0 = var_method_0(X)
var_you_1 = var_method_1(X)
except NameError as n:
if n.args[0] == "name 'variance' is not defined":
assert False, "Did you try to use `variance()` instead of implementing it from scratch?"
else:
raise n
finally:
variance = SAVE_VARIANCE
rel_diff_0 = abs(var_you_0 - var_py) / var_py
rel_diff_1 = abs(var_you_1 - var_py) / var_py
print("\nData: n={} samples from a Gaussian with mean {} and standard deviation {}".format(n, mu, sigm
a))
print("\tPython's variance function computed {}.".format(var_py))
print("\tvar_method_0(X) computed {}, with a relative difference of {}.".format(var_you_0, rel_diff_0
))
assert rel_diff_0 <= n*(2.0**(-52)), "The relative difference is larger than expected."
print("\tvar_method_1(X) computed {}, with a relative difference of {}.".format(var_you_1, rel_diff_1
))
assert rel_diff_1 > n*(2.0**(-52)), "The relative difference is smaller than expected!"
print("\n(Passed!)")
Data: n=100000 samples from a Gaussian with mean 10000000.0 and standard deviation 1.0
Python's variance function computed 0.9967722534664155.
var_method_0(X) computed 0.9967722534664016, with a relative difference of 1.3922726841113907e-1
4.
var_method_1(X) computed -0.26624266242662425, with a relative difference of 1.2671048090481332.
Data: n=100000 samples from a Gaussian with mean 10000000.0 and standard deviation 1.0
Python's variance function computed 0.9962388060583474.
var_method_0(X) computed 0.9962388060583466, with a relative difference of 7.800901877256258e-16.
var_method_1(X) computed 0.36864368643686435, with a relative difference of 0.6299645384268702.
Data: n=100000 samples from a Gaussian with mean 10000000.0 and standard deviation 1.0
Python's variance function computed 1.0085503515385184.
var_method_0(X) computed 1.0085503515385292, with a relative difference of 1.0787944919883359e-1
4.
var_method_1(X) computed 3.358753587535875, with a relative difference of 2.3302785353375572.
Data: n=100000 samples from a Gaussian with mean 10000000.0 and standard deviation 1.0
Python's variance function computed 1.0070187098361663.
var_method_0(X) computed 1.0070187098361865, with a relative difference of 2.0065227041774834e-1
/99e95a611b384ef98e70838a5eb90598/2?ac… 4/57
Fin! If you've reached this point and all tests above pass, you are ready to submit your solution to this problem. Don't forget to save you work prior to
submitting.
In [6]: print("\n(This notebook ran to completion.)")
var_method_0(X) computed 1.0102993140540029, with a relative difference of 2.637372135202717e-14.
var_method_1(X) computed -0.7782477824778248, with a relative difference of 1.7703140758900349.
(Passed!)
(This notebook ran to completion.)
Problem 1: Boozy Containers
This problem is a review of Python's built-in container data structures (https://docs.python.org/3/tutorial/datastructures.html), or simply, containers. These
include lists, sets, tuples, and dictionaries.
Below, there are four (4) exercises, numbered 0-3, which relate to basic principles of using containers. They are worth a total of ten (10) points.
The dataset: Student alcohol consumption
The data files for this problem pertain to a study of student alcohol consumption (https://www.kaggle.com/uciml/student-alcohol-consumption) and its
effects on academic performance. The following cell downloads these files (if they aren't already available).
In [1]: import requests
import os
import hashlib
import io
def download(file, url_suffix=None, checksum=None):
if url_suffix is None:
url_suffix = file
if not os.path.exists(file):
if os.path.exists('.voc'):
url = 'https://cse6040.gatech.edu/datasets/{}'.format(url_suffix)
else:
url = 'https://github.com/cse6040/labs-fa17/raw/master/datasets/{}'.format(url_suffix)
print("Downloading: {} ...".format(url))
r = requests.get(url)
with open(file, 'w', encoding=r.encoding) as f:
f.write(r.text)
if checksum is not None:
with io.open(file, 'r', encoding='utf-8', errors='replace') as f:
body = f.read()
body_checksum = hashlib.md5(body.encode('utf-8')).hexdigest()
assert body_checksum == checksum, \
"Downloaded file '{}' has incorrect checksum: '{}' instead of '{}'".format(file, body_chec
ksum, checksum)
download(filename, url suffix='ksac/{}'.format(filename), checksum=checksum)
9/16/2018 GT Learners: Practice Problems for Midterm 1 - Sample solutions | Practice Problems for Midterm 1: Topics 1-5 | CSE6040x Courseware | edX
https://courses.edx.org/courses/course-v1:GTx+CSE6040x+2T2019/courseware/699d28ed10b24b31b66d2bd82dd165fd/99e95a611b384ef98e70838a5eb90598/2?ac… 5/57
( , _ {} ( ), )
print("\n(All data appears to be ready.)")
Here is some code to show you the first few lines of each file:
In [2]: def dump_head(filename, max_lines=5):
from sys import stdout
from math import log10, floor
lines = []
with open(filename) as fp:
for _ in range(max_lines):
lines.append(fp.readline())
stdout.write("\n=== First {} lines of: '{}' ===\n\n".format(max_lines, filename))
for line_num, text in enumerate(lines):
fmt = "[{{:0{}d}}] {{}}".format(floor(log10(max_lines))+1)
stdout.write(fmt.format(line_num, text))
stdout.write('.\n.\n.\n')
dump_head('student-mat.csv');
dump_head('student-por.csv');
What is this data? Each of the two file fragments shown above is in comma-separated values (CSV) format. Each encodes a data table about students, their
alcohol consumption, test scores, and other demographic attributes, as explained later.
The first row is a list of column headings, separated by commas. These are the attributes.
Each subsequent row corresponds to the data for a particular student.
The numbers in brackets (e.g., [0], [1]) are only line numbers and do not exist in the actual file.
Of the two files, the first is data for a math class; the second file is for a Portuguese language class.
The read_csv() function, below, will read in these files using Python's csv module (https://docs.python.org/3/library/csv.html).
The important detail is that this function returns two lists: a list of the column names, header, and a list of lists, named data_rows, which holds the rows. In
particular, data_rows[i] is a list of the values that appear in the i-th data row, which you can see by comparing the sample output below to the raw file
data above.
'student-mat.csv' is ready!
'student-por.csv' is ready!
(All data appears to be ready.)
=== First 5 lines of: 'student-mat.csv' ===
[0] school,sex,age,address,famsize,Pstatus,Medu,Fedu,Mjob,Fjob,reason,guardian,traveltime,studytime,failu
9/16/2018 GT Learners: Practice Problems for Midterm 1 - Sample solutions | Practice Problems for Midterm 1: Topics 1-5 | CSE6040x Courseware | edX
with open(filename) as fp:
from csv import reader
data_rows = list(reader(fp))
header = data_rows.pop(0)
return (header, data_rows)
# Read the math class data
math_header, math_data_rows = read_csv('student-mat.csv')
# Read the Portuguese class data
port_header, port_data_rows = read_csv('student-por.csv')
# Print a sample of the data
def print_sample(header, data, num_rows=5):
from math import floor, log10
fmt = "Row {{:0{}d}}: {{}}".format(floor(log10(num_rows))+1)
string_rows = [fmt.format(i, str(r)) for i, r in enumerate(data[:num_rows])]
print("--> Header ({} columns): {}".format(len(header), header))
print("\n--> First {} of {} rows:\n{}".format(num_rows,
len(data),
'\n'.join(string_rows)))
print("=== Math data ===\n")
print_sample(math_header, math_data_rows)
The function only separates the fields by comma; it doesn't do any additional postprocessing. So all the data elements are treated as strings, even though
you can see that some are clearly numerical values. You'll need this fact in Exercise 3.
Exercise 0 (2 points). Complete the function, lookup_value(col_name, row_id, header, data_rows), to look up a particular value in the data
when stored as shown above. In particular, the parameters of the function are
col_name: Name of the column, e.g., 'school', 'address', 'freetime'.
row_id: The desired row number, starting at 0 (the first data row).
header, data_rows: The list of column names and data rows, respectively.
For example, consider the math data shown above. Then,
lookup_value('age', 0, math_header, math_data_rows) == '18'
lookup_value('G2', 3, math_header, math_data_rows) == '14'
Hint. Consider list.index() (https://docs.python.org/3/tutorial/datastructures.html).
In [4]: def lookup_value(col_name, row_id, header, data_rows):
assert col_name in header, "{} not in {}".format(col_name, header)
assert 0 <= row_id < len(data_rows)
### BEGIN SOLUTION
col_id = header.index(col_name)
9/16/2018 GT Learners: Practice Problems for Midterm 1 - Sample solutions | Practice Problems for Midterm 1: Topics 1-5 | CSE6040x Courseware | edX
https://courses.edx.org/courses/course- col_name = sample(math_header, 1)[0]
print("\n(Passed!)")
Exercise 1 (3 points). Suppose we wish to extract a list of all values stored in a given column of the table. Complete the function,
lookup_column_values(col, header, data_rows), which takes as input the column name col, list of column names header, and rows
data_rows, and returns a list of all the values stored in that column.
For example, the first five entries of the returned list when reference the 'age' column of the math class data should satisfy:
values = lookup_column_values('age', math_header, math_data_rows)
assert values[:5] == ['18', '17', '15', '15', '16']
In [6]: def lookup_column_values(col, header, data_rows):
assert col in header
(Passed!)
9/16/2018 GT Learners: Practice Problems for Midterm 1 - Sample solutions | Practice Problems for Midterm 1: Topics 1-5 | CSE6040x Courseware | edX
https://courses.edx.org/courses/course-v1:GTx+CSE6040x+2T2019/courseware/699d28ed10b24b31b66d2bd82dd165fd/99e95a611b384ef98e70838a5eb90598/2?ac… 8/57
, ''.join(values)))
print("\nSpot-checking some additional cases...")
assert ''.join(lookup_column_values('activities', math_header, math_data_rows)) == 'nononoyesnoyesnononoye
data_rows), so that it returns these values, as a list.
The ordering of unique values in your output does not matter.
First five values of 'age' column in the math data:
['18', '17', '15', '15', '16']
Spot-checking some additional cases...
(Passed!)
9/16/2018 GT Learners: Practice Problems for Midterm 1 - Sample solutions | Practice Problems for Midterm 1: Topics 1-5 | CSE6040x Courseware | edX
https://courses.edx.org/courses/course-v1:GTx+CSE6040x+2T2019/courseware/699d28ed10b24b31b66d2bd82dd165fd/99e95a611b384ef98e70838a5eb90598/2?a… 10/57
In [8]: def get_unique_values(col, header, data_rows):
assert col in header
### BEGIN SOLUTION
return list(set(lookup_column_values(col, header, data_rows)))
### END SOLUTION
In [9]: # Test cell: `exercise_2_test`
A simple analysis task. The column 'Dalc' contains the student's self-reported drinking frequency during the weekday. The values are 1 (very low amount
of drinking) to 5 (very high amount of drinking); if your function above works correctly then you should see that in the output of the following cell:
In [10]: print("Unique values of 'Dalc':", get_unique_values('Dalc', math_header, math_data_rows))
Similarly, Walc is the self-reported drinking frequency on the same scale, but for the weekend (instead of weekday).
Now, suppose we wish to know whether there is a relationship between these drinking frequencies and the final math grade, which appears in column 'G3'
(on a scale of 0-20, where 0 is a "low" grade and 20 is a "high" grade).
Exercise 3 (4 points). Create a dictionary named dw_avg_grade that will help with this analysis. For this exercise, we only care about the math grades
Checking ages...
Spot checking some additional cases...
(Passed!)
Unique values of 'Dalc': ['4', '5', '1', '2', '3']
https://courses.edx.org/courses/course-v1:GTx+CSE6040x+2T2019/courseware/699d28ed10b24b31b66d2bd82dd165fd/99e95a611b384ef98e70838a5eb90598/2?a… 11/57
For your dictionary, dw_avg_grade, the keys and values should be defined as follows.
1. Each key should be a tuple, (a, b), where a is the 'Dalc' rating and b is the 'Walc' rating. You should convert these ratings from strings to
integers. You only need to consider keys that actually occur in the data.
2. Each corresponding value should be the average test score, rounded to two decimal places.
Hint. To get you started, we've used your lookup_column_values() function to extract the relevant columns for analysis. From there,
consider breaking this problem up into several parts:
1. Counting the number of occurrences of (Dalc, Walc) pairs.
2. Summing the grades for each pair.
3. Dividing the latter by the former to get the mean. Use round() (https://docs.python.org/3/library/functions.html#round) to do the
rounding.
(9/16/2018 GT Learners: Practice Problems for Midterm 1 - Sample solutions | Practice Problems for Midterm 1: Topics 1-5 | CSE6040x Courseware | edX
https://courses.edx.org/courses/course-v1:GTx+CSE6040x+2T2019/courseware/699d28ed10b24b31b66d2bd82dd165fd/99e95a611b384ef98e70838a5eb90598/2?a… 12/57
Fin! If you've reached this point and all tests above pass, you are ready to submit your solution to this problem. Don't forget to save you work prior to
submitting.
(This notebook ran to completion.)
9/16/2018 GT Learners: Practice Problems for Midterm 1 - Sample solutions | Practice Problems for Midterm 1: Topics 1-5 | CSE6040x Courseware | edX
Problem 2: DNA Sequence Analysis
This problem is about strings and regular expressions. It has four (4) exercises, numbered 0-3. They are worth a total of ten (10) points.
In [1]: import re # You'll need this module
DNA Sequence Analysis
Your friend is a biologist who is studying a particular DNA sequence. The sequence is a string built from an alphabet of four possible letters, A, G, C, and T.
Biologists refer to each of these letters a base.
Here is an example of a DNA fragment as a string of bases.
9/16/2018 GT Learners: Practice Problems for Midterm 1 - Sample solutions | Practice Problems for Midterm 1: Topics 1-5 | CSE6040x Courseware | edX
Exercise 0 (2 point). Complete the function, count_bases(s). It takes as input a DNA sequence as a string, s. It should compute the number of
occurrences of each base (i.e., 'A', 'C', 'G', and 'T') in s. It should then return these counts in a dictionary whose keys are the bases.
Enzyme "scissors." Your friend is interested in what will happen to the sequence if she uses certain "restriction enzymes" to cut it. The enzymes work by
scanning the DNA sequence from left to right for a particular pattern. It then cuts the DNA wherever it finds a match.
A biologist's notation. Your friend does not know about regular expressions. Instead, she uses a special notation
(https://en.wikipedia.org/wiki/Nucleic_acid_sequence) that other biologists use to describe base patterns. These are "extra letters" that have a special
meaning.
For example, the special letter N denotes any base, i.e., any single occurrence of an A, C, G, or T. Therefore, when a biologist writes, ANT, that means AAT,
ACT, AGT, or ATT.
Here is the complete set of special letters:
Exercise 1 (4 points). Given a string in the biologist's notation, complete the function bio_to_regex(pattern_bio) so that it returns an equivalent
pattern in Python's regular expression language.
If your function is correct, then the following code would also work:
9/16/2018 GT Learners: Practice Problems for Midterm 1 - Sample solutions | Practice Problems for Midterm 1: Topics 1-5 | CSE6040x Courseware | edX
Restriction sites. When an enzyme cuts the string, it does it in a certain location with respect to the target pattern. This information is encoded as a
restriction site.
The way a biologist specifies the restriction site is with a special notation that embeds the cut in the pattern. For example, there is one enzyme that has a
restriction site of the form, ANT|AAT, where the vertical bar, '|', shows where the enzyme will split the sequence. So, if the input DNA sequence were
GCATAGTAATGTATTAATGGC
then there would two matches:.
Exercise 3 (5 points). Complete the function, sim_cuts(site_pattern, s), below. The first argument, site_pattern, is the biologist's restriction site
pattern, e.g., ANT|AAT, where there may be an embedded cut. The second argument, s, is the DNA sequence to cut. The function should return the
fragments in the sequence order.
For the preceding example,
sim_cuts('ANT|AAT', 'GCATAGTAATGTATTAATGGC') == ['GCATAGT', 'AATGTATT', 'AATGGC']
Note. There are two test cells, below. Both must pass for full credit, but if only one passes, you'll at least get some partial credit.
(Passed first group of tests!)
(Passed second set of tests!)
9/16/2018 GT Learners: Practice Problems for Midterm 1 - Sample solutions | Practice Problems for Midterm 1: Topics 1-5 | CSE6040x (Passed first test of Exercise 3; two more to go in the next cell.)
9/16/2018 GT Learners: Practice Problems for Midterm 1 - Sample solutions | Practice Problems for Midterm 1: Topics 1-5 | CSE6040x
https://courses.edx.org/courses/course-v1:GTx+CSE6040x+2T2019/courseware/699d28ed10b24b31b66d2bd82dd165fd/99e95a611b384ef98e70838a5eb90598/2?a… 18/57
Fin! If you've reached this point and all tests above pass, your biologist friend thanks you and you are ready to submit your solution to this problem. Don't
forget to save you work prior to submitting.
Portions of this problem were inspired by a fun book called Python for Biologists (https://pythonforbiologists.com/python-books).
Problem 3: Scans
This problem is about a useful computational primitive known as a scan. It has four (4) exercises, which are worth a total of ten (10) points.
By way of set up, the module will revolve around a possibly new function for you called accumulate(), which is available in the itertools
(https://docs.python.org/3/library/itertools.html) module. Run the following code cell to preload it.
In [1]: from itertools import accumulate
SAVE_ACCUMULATE = accumulate # You may ignore this line, which some test cells will use
Background: Cumulative sums
Consider a sequence of values, . Its cumulative sum (or running sum) is
9/16/2018 GT Learners: Practice Problems for Midterm 1 - Sample solutions | Practice Problems for Midterm 1: Topics 1-5 | CSE6040x Courseware | edX
The accumulate() function makes it easy to compute cumulative sums.
Exercise 0 (1 point). Run the following code cell. (Yes, that's it -- one free point with no coding required!)
In [2]: L = list(accumulate([5, 3, -4, 20, 2, 9, 0, -1]))
function returns a certain object, which is why list() is used to convert its result into a list.
Scans
A cumulative sum is one example of a more general primitive also known as a scan.
Let be any associative function of two values. Associative means that . For example, addition is associative: suppose that
; then it is true that . The scan of a sequence with respect to is
The accumulate() function lets you implement these kinds of scans easily, too. For example, convince yourself that computing the minimum of two values,
, is also associative. Then you can implement a minimum scan, or min-scan for short, as follows:
Exercise 1 (1 point). Run the following cell and make sure its output makes sense to you. (Yes, that's it -- no coding required.)
In [3]: def min_scan(X):
return list(accumulate(X, min))
print('min_scan({}) == {}'.format(L, min_scan(L)))
print("\n(Passed!)")
Exercise 2: Line-of-sight (3 points). Suppose a camera is fixed at a certain height in front of a bunch of obstacles of varying heights at different locations.
You wish to determine all locations in which the camera's view is obstructed.
For example, in this cartoon, the camera's view is obstructed at all positions starting at 8:
9/16/2018 GT Learners: Practice Problems for Midterm 1 - Sample solutions | Practice Problems for Midterm 1: Topics 1-5 | CSE6040x Courseware | edX,
get_obstruction(X, h), so that it returns a list of all positions at which the camera is obstructed. For data corresponding to the above figure, this
function would return [8, 9, 10, 11, 12].
An obstacle obstructs the camera if its height is greater than or equal to the height of the camera. For this exercise, your code must use
accumulate() in some way.
Application: When to buy a stock? Suppose you have the price of a stock on consecutive days. For example, here is a list of stock prices observed on 14
consecutive days (assume these are numbered from 0 to 13, corresponding to the indices):
prices = [13, 11, 10, 8, 5, 8, 9, 6, 7, 7, 10, 7, 4, 3]
Suppose you buy on day i and sell on day j, where j > i. Then prices[j] - prices[i] measures your profit (or loss, if negative).
Exercise 3 (5 points). Implement a function, max_profit(prices), to compute the best possible profit you could have made given a list of prices.
In the example above, that profit turns out to be 5. That's because you can buy on day 4, whose price is prices[4] == 5, and then sell on day 10, whose
price is prices[10] == 10; it turns out there is no other combination will beat that profit.
There are two constraints on your solution:
1. You must use accumulate(). There is a (relatively) simple and fast solution that does so.
2. If only a loss is possible, your function should return 0.
9/16/2018 GT Learners: Practice Problems for Midterm 1 - Sample solutions | Practice Problems for Midterm 1: Topics 1-5 | CSE6040x Courseware | edX
https://courses.edx.org/courses/course- Testing: prices=[5, 5]
==> Your code's maximum profit: 13
Problem 4: Change Detection
In this problem, you will implement a computational primitive used in time-series analysis. This technique is the cumulative sum, or CuSum
(https://en.wikipedia.org/wiki/CUSUM), method.
This problem has 5 exercises, numbered 0 through 4 and worth 2 points each.
Motivating example. Consider a steam heater in manufacturing plant. A sensor monitors the heater's temperature every second. The plant considers the
safe operating limit of the heater to be an average of . You are asked to design an algorithm to raise an alarm when the heater is operating
significantly outside this limit.
The catch is that the sensor occasionally reports an erroneous value.
Therefore, you don't want to raise an alert too early for a single errant temperature. Yet, you also don't want to wait too long to raise an alarm. The CuSum
primitive will help you in your task.
400 ∘F
9/16/2018 GT Learners: Practice Problems for Midterm 1 - Sample solutions | Practice Problems for Midterm 1: Topics 1-5 | CSE6040x Courseware | edX
https://courses.edx.org/courses/course-v1:GTx+CSE6040x+2T2019/courseware/699d28ed10b24b31b66d2bd82dd165fd/99e95a611b384ef98e70838a5eb90598/2?a… 23/57
Definition: CuSum. Let denote the current time. The CuSum primitive calculates a value, , by the formula
where
is the value of the function at time ;
is the value of the function at time ;
is a predetermined mean value, either from an expert or possibly calculated over a range of observed data;
and is the observed value of the temperature sensor at time .
Take a moment to convince yourself that is always at least zero, and that it is computed by updating the previous value, , by the difference between
the current observation ( ) and an expected mean value ( ).
The analysis. You wish to raise an alarm only when the value of crosses a predetermined threshold value, , i.e., when .
Let's break down this analysis task into smaller parts.
print("\n(Passed!)")
Now that you have calculated the mean, the next step is to implement the function for calculating CuSum.
Exercise 1 (2 points). Write a function, cusum(x, mu), that takes a list of observed temperatures, x, and mean parameter mu as inputs, and then returns a
list of the cumulative sum values at each time.
Recall that these CuSum values are defined by
Assume that , that is, the value at , which is "before" , is zero.
If no such element is found in CS, the function should return -1.
Putting it all together. Recall that you've now built the following functions:
calc_mean(L): returns the mean of L;
cusum(x, mu): returns the CuSum for the sequence x[:], given mu; and
get_index(CS, alpha): returns the position in CS that exceeds a threshold alpha.
Now let's put all the pieces of this puzzle together!
Exercise 3 (2 points). Write a function, raise_alarm(x, alpha), that takes a list of observed temperatures, x, and a threshold, alpha, as inputs, and
returns the first element as a pair (tuple), (index, element), such that the CuSum at time index exceeds alpha.
For the mean ( ), use the mean of x. And if no CuSum value exceeds the threshold, your function should return (-1, None).
Here is an example that should raise an alarm:
d 10 = (15, 027, 809 mod 10)
= 9.
9/16/2018 GT Learners: Practice Problems for Midterm 1 - Sample solutions | Practice Problems for Midterm 1: Topics 1-5 | CSE6040x Courseware | edX
https://courses.edx.org/courses/course-v1:GTx+CSE6040x+2T2019/courseware/699d28ed10b24b31b66d2bd82dd165fd/99e95a611b384ef98e70838a5eb90598/2?a… 40/57
that represents the hash table buckets. Your function should add the given (key,
value) tuple to the list, implementing the separate chaining logic if there is a collision.
And if an identical key already exists in the hash table, your function should replace the current value with this new value.
A reasonable algorithm for this problem would be the following:
1. Compute the bucket ID for the given key.
2. If the bucket is empty, append (key, value) to that bucket.
3. If the bucket is not empty, then there are two cases: a. If key is already in the bucket, then update the old value with the given value. b. If key is
not yet in the bucket, then simply append (key, value) to the bucket.
You may assume that every element of buckets is a valid list object. (It might be empty, but it will be a list.)
Exercise 3 (3 points): Use your functions from the first three exercises to create a hash table from the above dataset, hash_table_data. Store this table in
a variable named table.
In other words, iterate through hash_table_data and insert each (name, phone number) pair into your table.
You will have to choose a specific size for your table. In practice, the size is often chosen to try to achieve a certain *load factor," which is defined as
where is the number of items (i.e., key-value pairs) you expect to store and is the number of buckets. Common load factor values are 0.5 or 0.75.
Remember that there are 1,000 entries in the hash_table_data dataset, so choose your number of buckets accordingly.
You will be graded in two ways. The first test cell, worth one point, will test a correct import of the data into your table. The next test cell will test how your
hash_insert() and hash_search() functions work with your newly created table.
the kernel and run the entire notebook from top-to-bottom to make sure you did
everything correctly. If that is working, try submitting this problem. (Recall that you must submit and pass the autograder to get credit for your work.)
(Passed!)
(Passed!)
Problem 7: Hamlet Sentence Generator
Who needs Shakespeare when we've got Python? In the following series of exercises, we will create a function that will generate Shakesepearan-sounding
phrases. All of the words in our phrase generator come from Act 3, Scene 1 of Shakespeare's Hamlet.
But we won't just be stringing random words together. To make our phrases sound (slightly) coherent, every new word in our phrase will be a word that
followed the previous word in the original Shakespearean text.
We will accomplish this in three steps. First, we will tidy the text of the scene, breaking each sentence into an ordered list of the words in that sentence.
Second, we will create a dictionary where the keys are words from the text, and the values are lists of the words that immediately follow the key words in the
dialogue. Finally, we will create a phrase generator that will use that dictionary by starting with a key word, randomly selecting a word from the list of words
that follows it, adding that word to our phrase, and repeating the process.
Here's the text of Hamlet Act 3, Scene 1. Run the next code cell
Problem 9: Maximum likelihood and floating-point
This problem concerns floating-point arithmetic, motivated by the statistical concept of maximum likelihood estimation. It has four exercises, numbered 0-3,
and is worth a total of ten (10) points.
Setup. This problem involves a number of functions from the Python standard library. Here are some of them; run the code cell below to make them available
for use.
In [1]: # The test cells need these:
from random import choice, randint, uniform, shuffle
from math import isclose
# You'll need these in Exercises 1 & 3:
from math import exp, sqrt, pi, log
Products
Suppose you are given a collection of data values, named , , , . Mathematically, we denote their sum as
In Python, it's easy to implement this formula using the sum() function, which can sum the elements of any iterable collection, like a list:
sum([1, 2, 3, 4, 5]) == 15
9/16/2018 GT Learners: Practice Problems for Midterm 1 - Sample solutions | Practice Problems for Midterm 1: Topics 1-5 | CSE6040x Courseware | edX
https://courses.edx.org/courses/course-v1:GTx+CSE6040x+2T2019/courseware/699d28ed10b24b31b66d2bd82dd165fd/99e95a611b384ef98e70838a5eb90598/2?a… 53/57
Exercise 0 (3 points). Write a function, product(x), that returns the product of a collection of numbers x.
In [3]: def product(x):
### BEGIN SOLUTION
return product__method1(x)
def product__method0(x):
p = 1
for xi in x:
p *= xi
return p
def product__method1(x):
from functools import reduce
from operator import mul
return reduce(mul, x)
msg = "{} values: [{}]".format(n, msg_values)
print(msg)
While denotes the variance, the standard deviation is . You may assume .
Exercise 1 (1 point). Write a function gaussian0(x, mu, sigma) that returns given one floating-point value x, a mean value mu, and standard
deviation sigma.
For example,
gaussian0(1.0, 0.0, 1.0)
should return the value .
In the signature below, mu and sigma are set to accept default values of 0.0 and 1.0, respectively. But your function should work for any
| Practice Problems for Midterm 1: Topics 1-5 | CSE6040x Courseware | edX
https://courses.edx.org/courses/course- for k in range(1, 6):
check_gaussian0(k=k)
print("\n(Passed!)")
Exercise 2 (1 point). Suppose you are now given a list of values, , , , . Write a function, gaussians(), that returns the collection of values,
[7.674273364934753e-13, 2.2075380785334786e-06, 0.0056592223086500545]
(Passed!)
9/16/2018 GT Learners: Practice Problems for Midterm 1 - Sample solutions | Practice Problems for Midterm 1: Topics 1-5 | CSE6040x Courseware | edX
https://courses.edx.org/courses/course-v1:GTx+CSE6040x+2T2019/courseware/699d28ed10b24b31b66d2bd82dd165fd/99e95a611b384ef98e70838a5eb90598/2?a… 56/57
In statistics, one technique to fit a function to data is a procedure known as maximum likelihood estimation (MLE). At the heart of this method, one needs to
calculate a special function known as the likelihood function, or just the likelihood. Here is how it is defined.
Let , , , denote a set of input data points. The likelihood of these data, , is defined to be
where is some probability density function that you believe is a good model of the data. The MLE procedure tries to choose model parameters that
maximize .
In this problem, let's suppose for simplicity that is a normal or Gaussian distribution with mean and variance , meaning that . Here is a
straightforward way to implement in Python.
The problem is that you might need to multiply many small values. Then, due to the limits of finite-precision arithmetic, the likelihood can quickly go to zero,
becoming meaningless, even for a small number of data points.
In [11]: # Generate many random values
N = [int(2**k) for k in range(8)]
X = [uniform(-10, 10) for _ in range(max(N))]
# Evaluate the likelihood for different numbers of these values:
for n in N:
print("n={}: likelihood ~= {}.".format(n, likelihood_gaussian(X[:n])))
Recall that the smallest representable value in double-precision floating-point is . Therefore, if the true exponent falls below that value, we cannot
store it. You should see this behavior above.
One alternative is to compute the log-likelihood, which is defined simply as the (natural) logarithm of the likelihood:
Log-transforming the likelihood has a nice feature: the location of the maximum value will not change. Therefore, maximizing the log-likelihood is equivalent
to maximizing the (plain) likelihood.
Let's repeat the experiment above but also print the log-likelihood along with the likelihood:
In [12]: for n in N:
the likelihood. Therefore, you can calculate it for a much larger number of data points.
But the problem persists: just taking doesn't help. When rounds to zero, taking the produces minus infinity. For this last exercise, you
need to fix this problem.
Exercise 3 (5 points). Using the fact that and are inverses of one another, i.e., , come up with a way to compute the log-likelihood that
can handle larger values of n.
For example, in the case of n=128, your function should produce a finite value rather than .
Hint. In addition to the inverse relationship between and , use the algebraic fact that to derive a different
msg
print("\n(Passed!)")
Fin! This cell marks the end of this problem. If everything works, congratulations! If you haven't done so already, be sure to submit it to get the credit you
deserve.
[Show More]


![Preview of [eBook] [PDF] Advancing Your Career Concepts of Professional Nursing, 7th Edition By Rose](https://scholarfriends.com/storage/eBook Advancing Your Career Concepts of Professional Nursing, 7e Rose Kearney-Nunnery.png)

![Preview of eBook [PDF] Database and Application Security By R. Sarma Danturthi](https://browseimages.nyc3.digitaloceanspaces.com/paper-images/2026/03/24/OZbtiHK12026-03-24-06-3669c2af88aa830.png)
![Preview of eBook [PDF] Python Polars The Definitive Guide By Jeroen Janssens, Thijs Nieuwdorp](https://browseimages.nyc3.digitaloceanspaces.com/paper-images/2026/03/19/B6nd3pj72026-03-19-04-5469bb5772c297e.png)
![Preview of eBook [PDF] Python Distilled 1st Edition By David M. Beazley](https://browseimages.nyc3.digitaloceanspaces.com/paper-images/2026/03/19/BlMP5pss2026-03-19-04-5269bb56f4a3a0a.png)