MATH 221 Homework_ Statistics for Decision-Making 1 | Grade A Formula
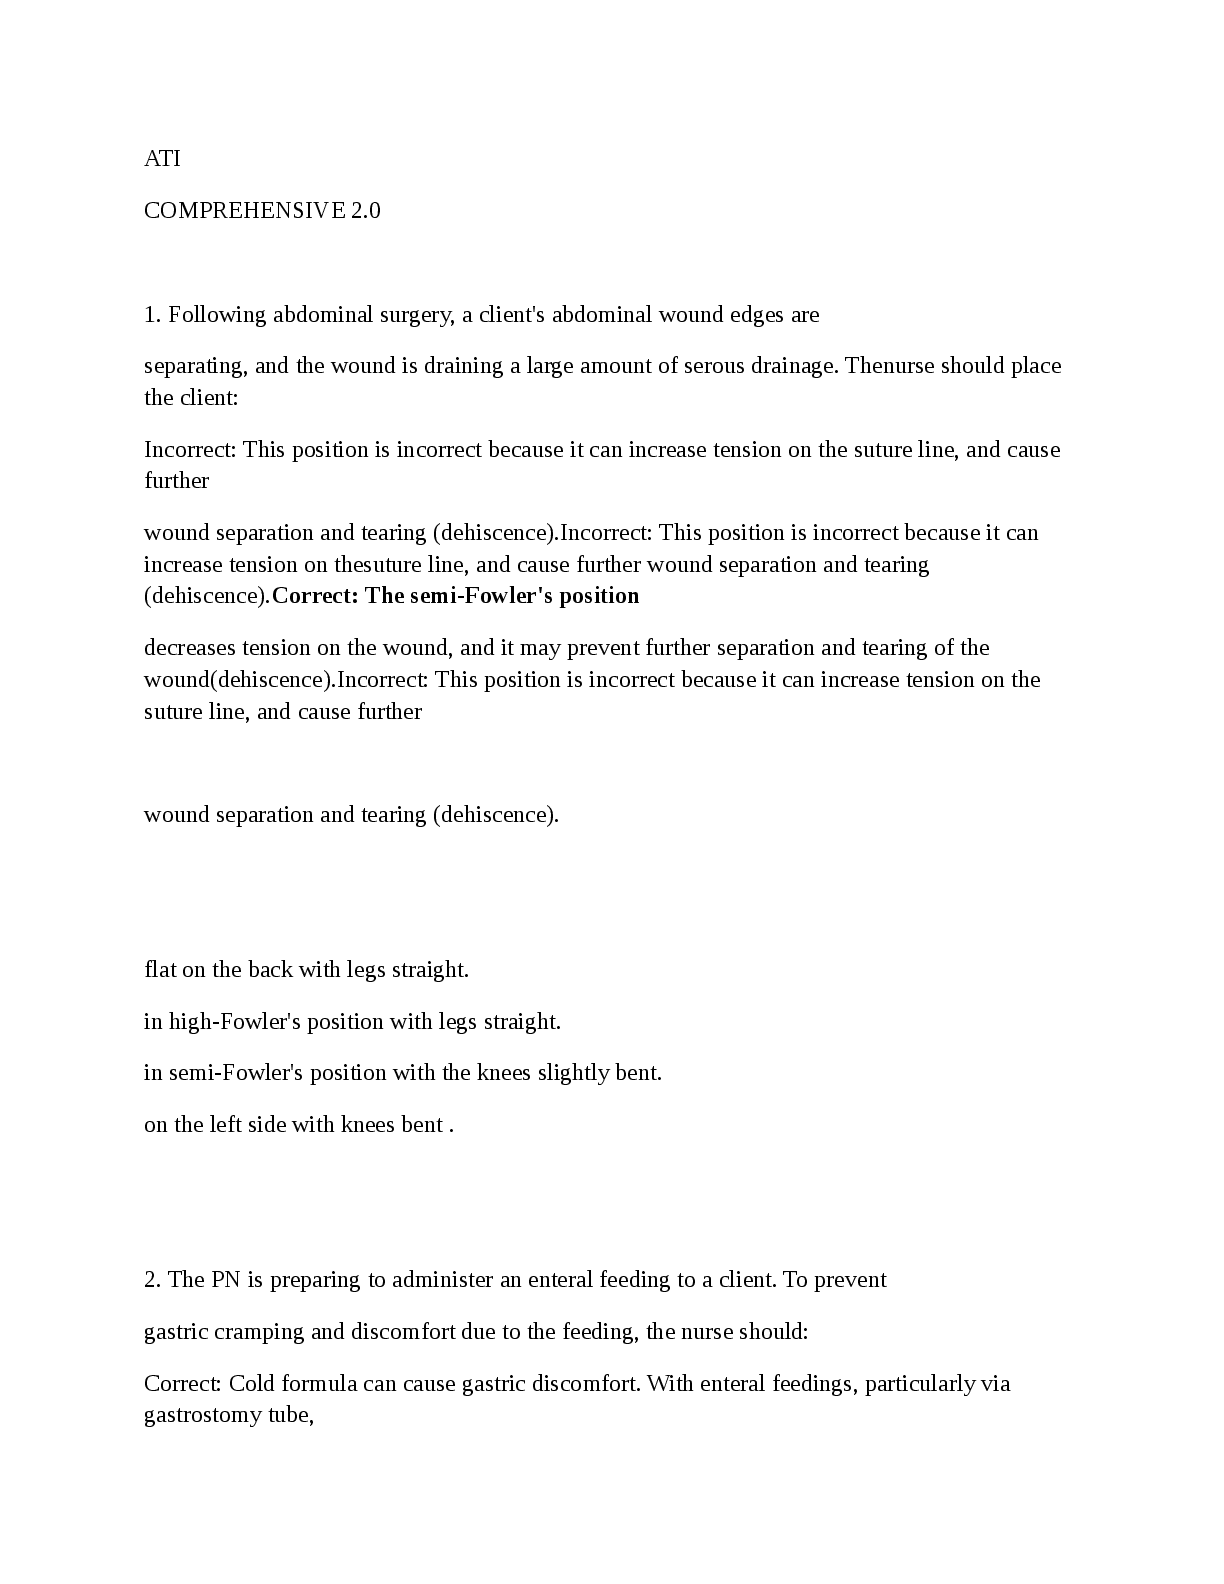
A recent survey of the alumni of a university inOf all DeVry students, a study found that 43% of them are business
majors. The 43% would be consider
...
MATH 221 Homework_ Statistics for Decision-Making 1 | Grade A Formula
A recent survey of the alumni of a university inOf all DeVry students, a study found that 43% of them are business
majors. The 43% would be considered a:
dicated that the average salary of 10,000 of its 200,000 graduates was $130,000. The $130,000 would be considered a:
Based on past experience, it is predicted that 31% of registered voters in Oklahoma will vote in the next primary. The 31% would be considered an example of:
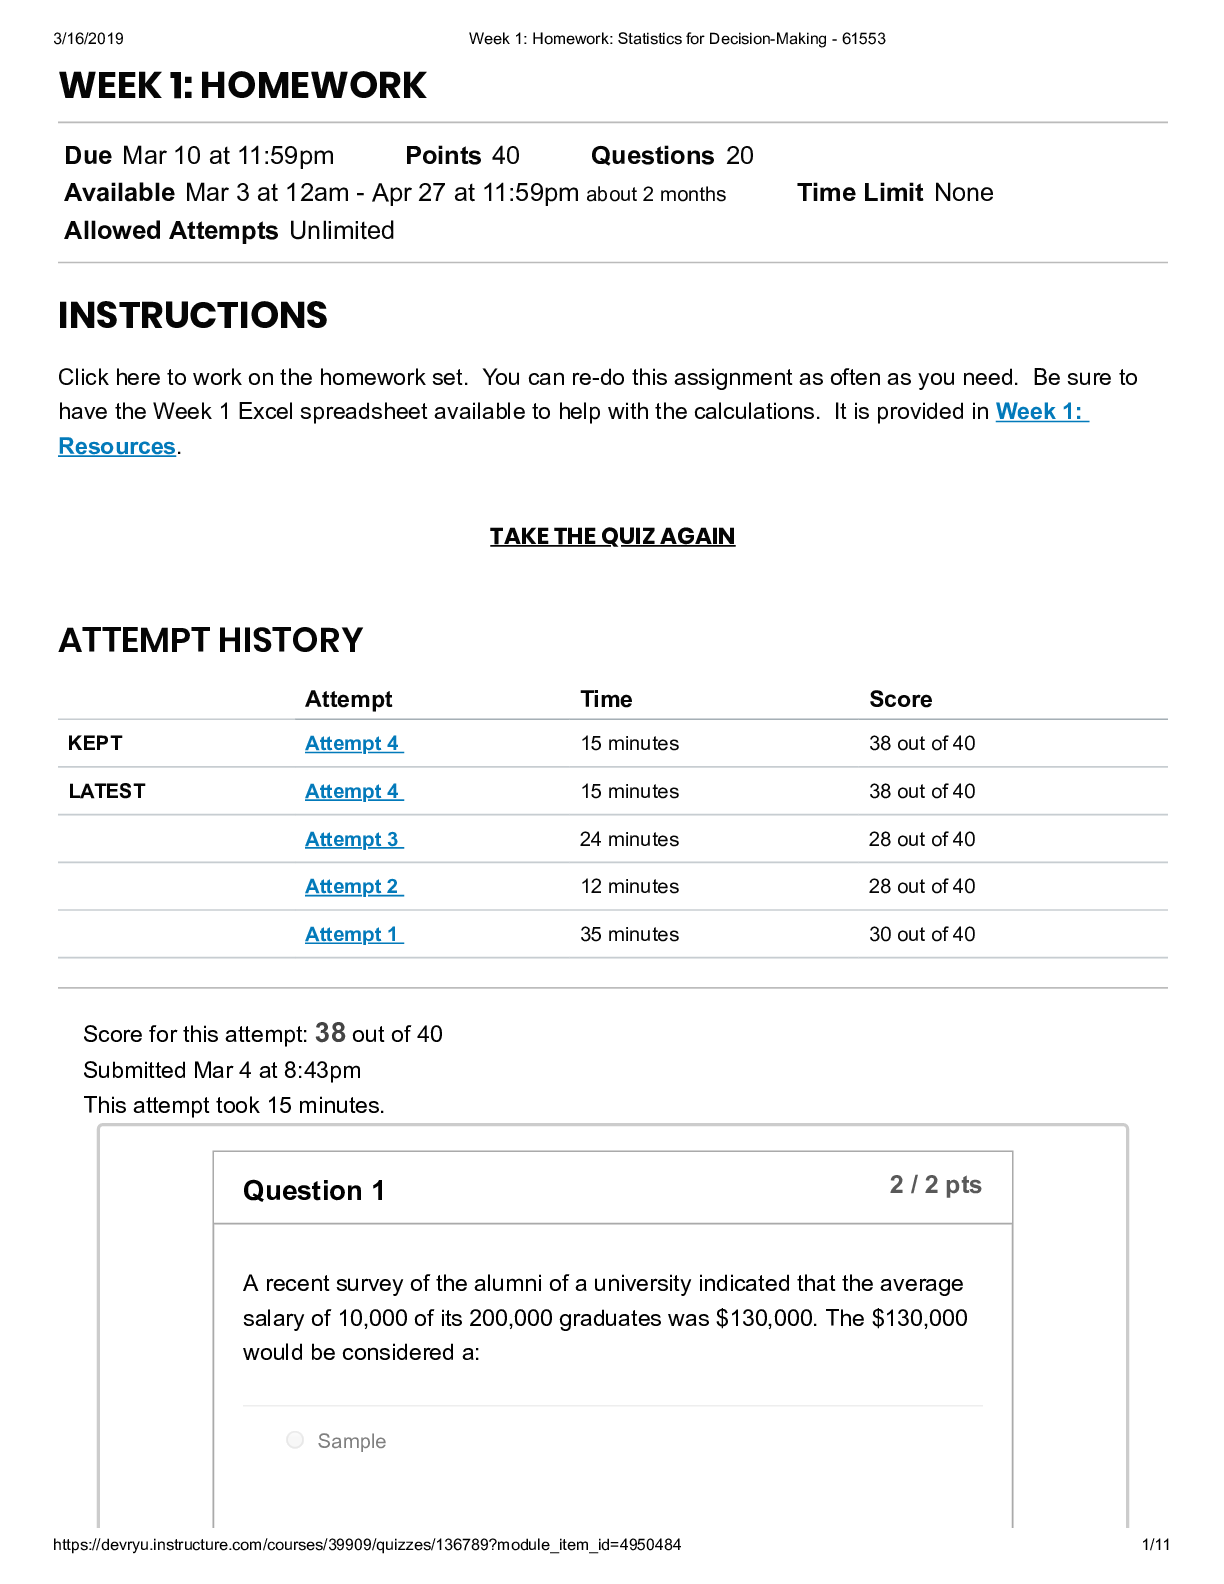
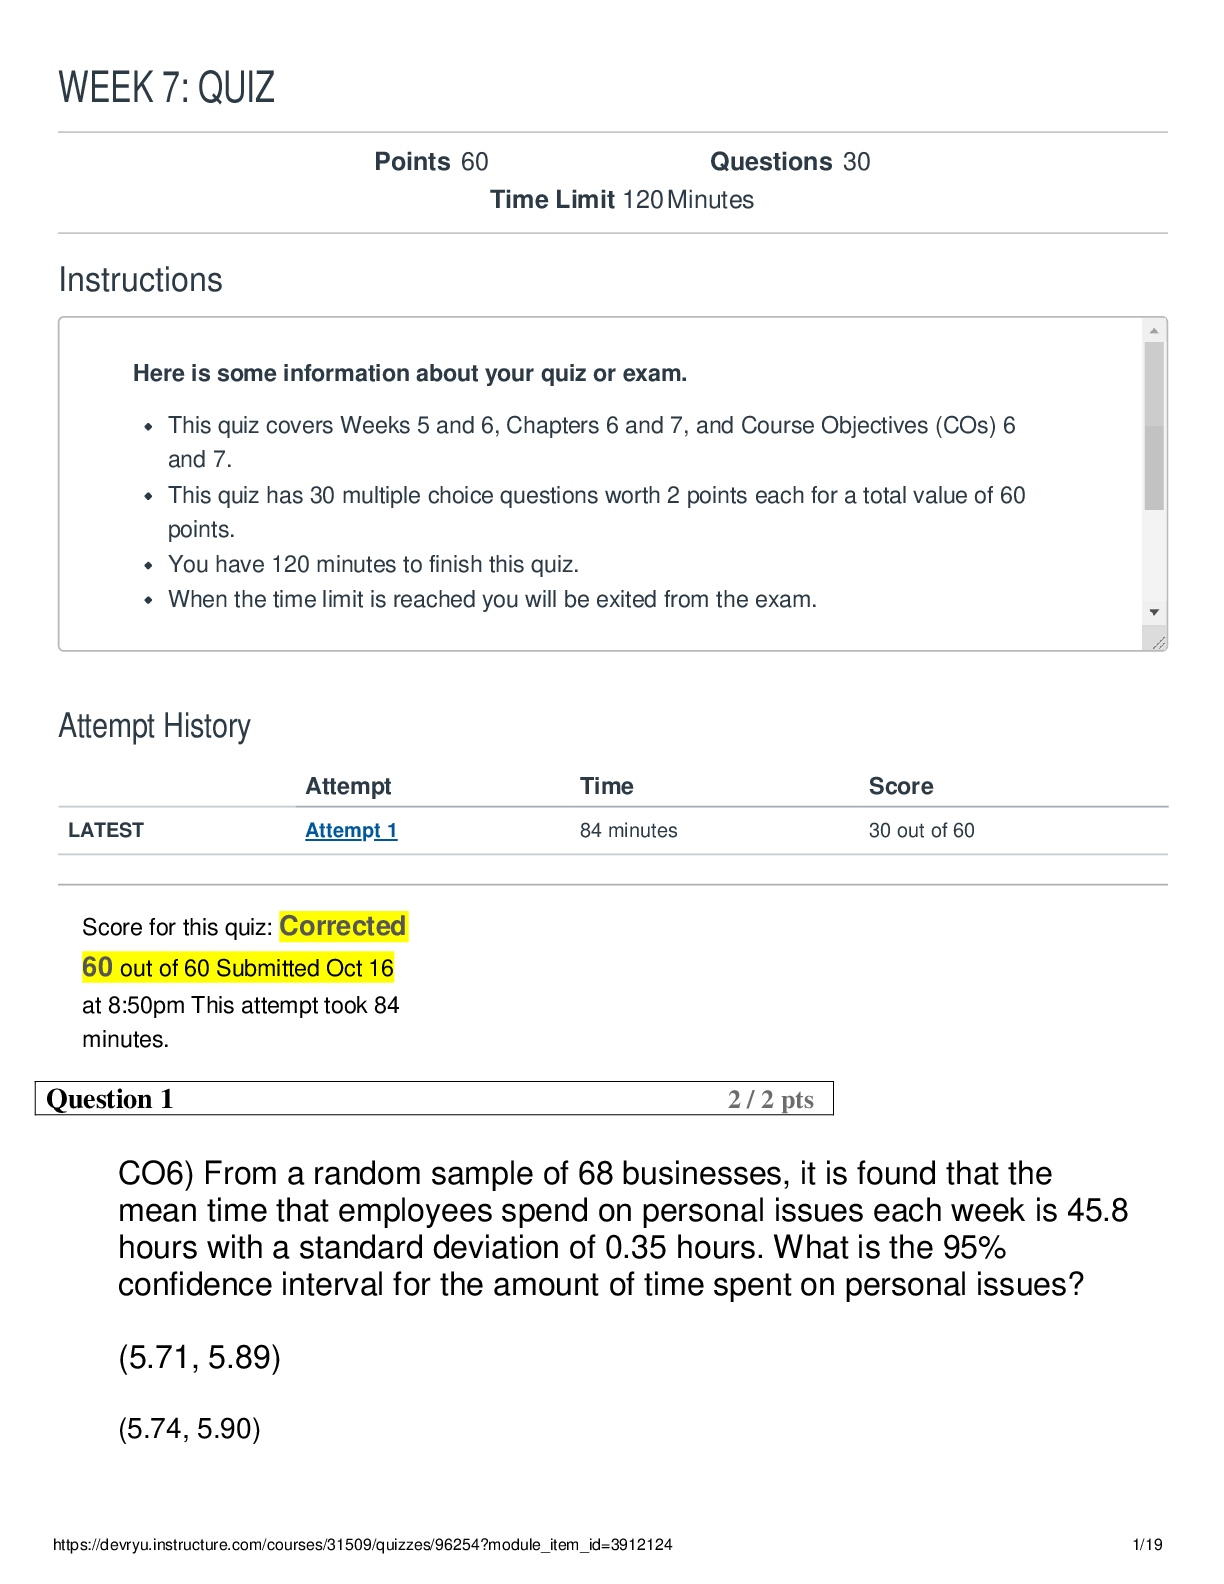
WEEK 1: HOMEWORK
MATH 221 Homework_ Statistics for Decision-Making Week 1
This attempt took 15 minutes.
Question 1 2 / 2 pts
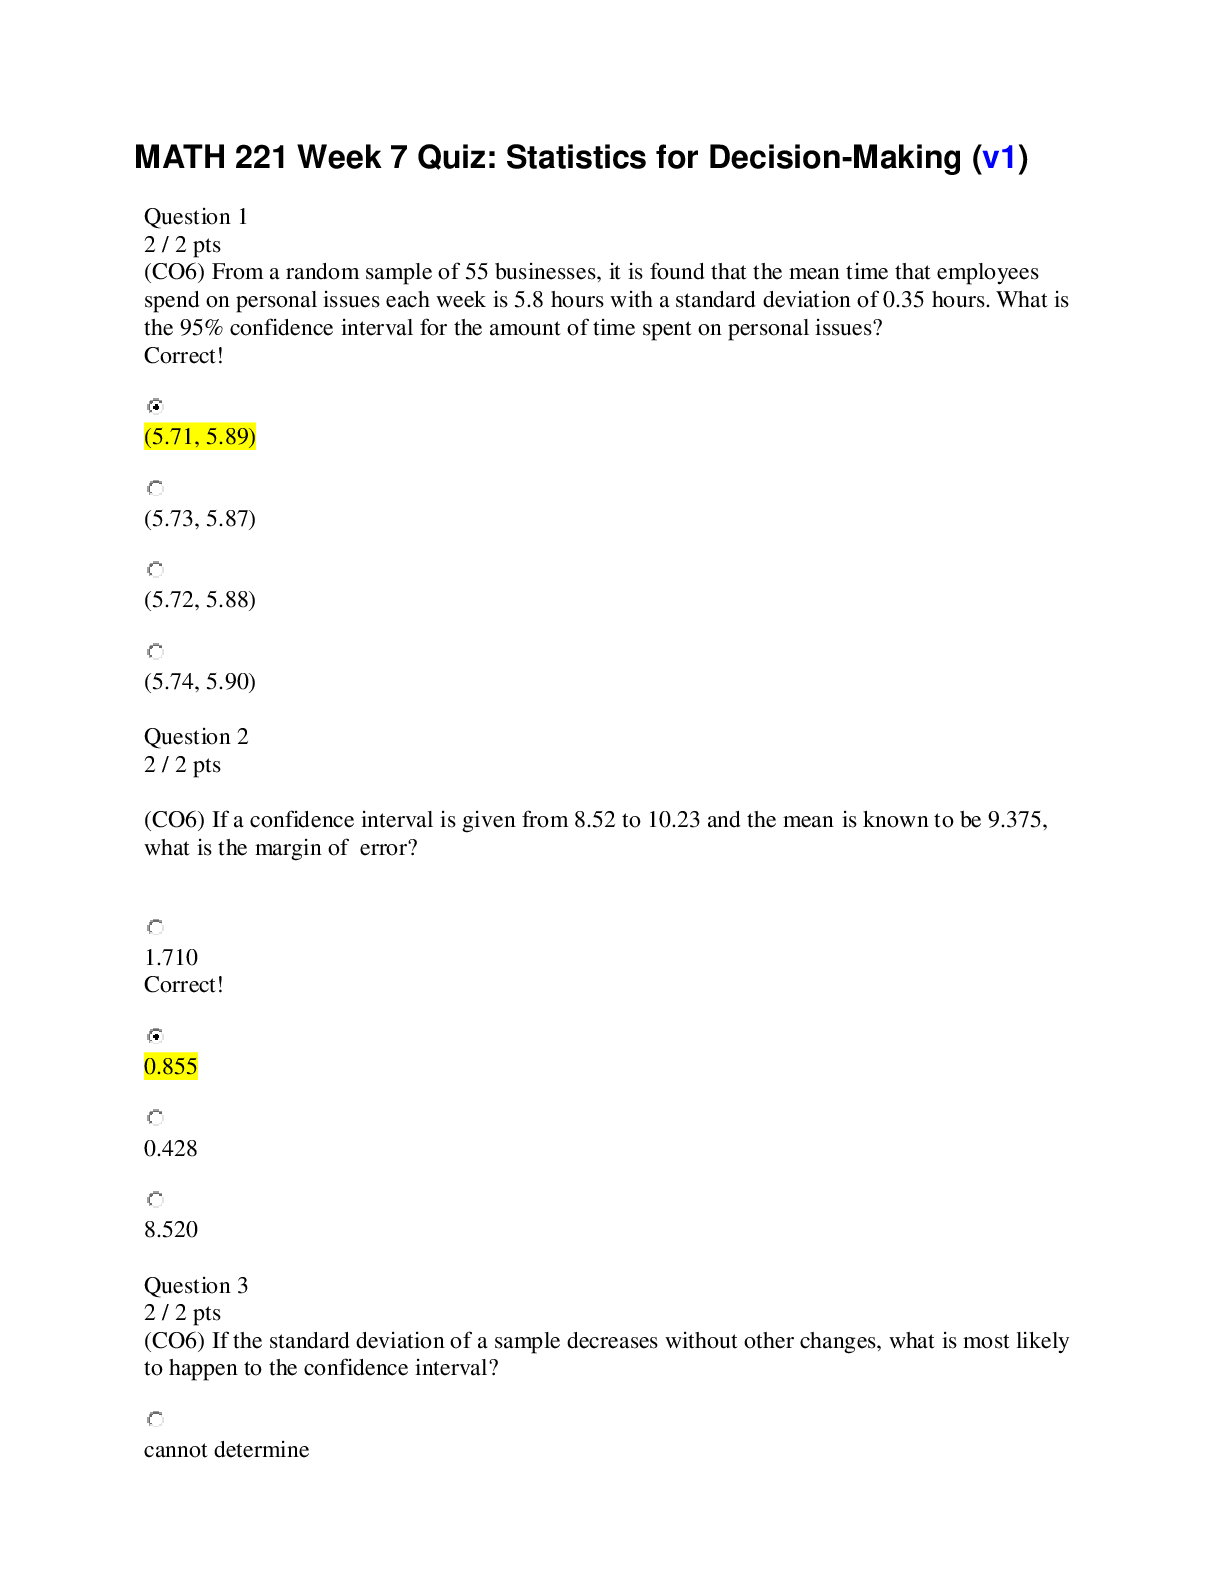
A recent survey of the alumni of a university indicated that the average salary of 10,000 of its 200,000 graduates was $130,000. The $130,000 would be considered a:
Sample
Population
Correct!
Statistic
Parameter
Correct Answe
You Answered
Based on past experience, it is predicted that 31% of registered voters in Oklahoma will vote in the next primary. The 31% would be considered an example of:
Descriptive statistics
Correct!
Inferential statistics
Qualitative data
A sample
Question 4 2 / 2 pts
The milligrams of tar in 30 cigarettes would be considered:
Nominal data
Ordinal data
Interval data
Correct! Ratio data
Question 5 2 / 2 pts
Marriage status (married, single, etc.) of the faculty at a university would be considered:
Correct! Qualitative data Ordinal data Ratio data Quantitative data
Question 6 2 / 2 pts
The amount of fat in grams in 58 cookies would be considered:
Correct!
Ratio data
Interval data
Nominal data
Ordinal data
Correct!
A personnel director at a large company would like to determine whether the company cafeteria is widely used by employees. She calls each employee and asks them whether they usually bring their own lunch, eat at the company cafeteria, or go out for lunch. This study design would be considered:
Experimental
Simulation
Observational
Correct!
Survey
Correct!
Correct!
Correct!
Correct!
If data set A has a smaller standard deviation than data set B, what would be different about their distributions?
Data set A would have a larger mean
Correct!
Data set A would have more data near the center of the distribution
Data set A would have flatter distribution with more data in each tail
Data set A would have most of its data to one side of the distribution
Correct!
Which of the following data sets would you expect to have the highest standard deviation?
Correct!
Ages of people taking college classes (in years)
Amount of soda in an unopened can (in ounces)
The number of phones a person owns
Weight of an orange (in ounces)
Correct!
In manufacturing, cluster sampling could be used to determine if the machines are operating correctly. Which of the following best describes this type of sampling?
Correct!
Products are put into groups and all are included from several randomly selected groups
Products are put into groups and some are randomly selected from each group
Samples are randomly selected throughout the day
Every 10th product in the line is selected
Correct!
Question 19
Match the terms and their definitions
2 / 2 pts
Correct!
Vertical bar chart that shows frequency on the y- axis
Histogram
Correct!
A sample where the population is divided into groups and several groups are randomly selected from all from those selected groups are sampled
Cluster sample
Correct!
Collection of all counts that are of interest
Population
Correct!
A subset or part of a population
Correct!
A sample where the population is divided into groups and several are randomly sampled form each group
Correct!
Consists of attributes, labels, or nonnumerical entries
Question 20
Match the terms and their definitions
2 / 2 pts
Correct!
The most frequent number appearing in a dataset
Mode
Correct!
The average
Mean
Correct!
The percentage of data that falls within 1, 2, or 3 standard deviations of the mean in a symmetrical, bell-shaped distribution
Empirical Rule
Correct!
The square root of the variance
Standard deviation
Correct!
Show how far a particular data point is from the mean in terms of the
Standard score
number of standard deviations
Quiz Score: 38 out of 40
[Show More]


![Preview of eBook [PDF] Matrix Structural Analysis and the Finite Element Methods Using Scilab and Oct](https://browseimages.nyc3.digitaloceanspaces.com/paper-images/2024/Aug/30/UsWQ8IZw2024-08-30-02-0366d1a6fc9e250.png)